Overview
Our proposal’s goal is to establish a high-speed rail system on the Northeast Corridor (NEC) between Boston and Washington. As the corridor is also used by commuter trains most of the way, the proposal also includes commuter rail modernization, speeding up the trains and regularizing service frequency. For both intercity and commuter trains, the aim is to use already-committed large spending programs, such as the Gateway tunnel between New Jersey and New York, to redesign service. We then propose lower-budget ancillary projects to take maximum advantage of existing and under-construction infrastructure, prioritizing both speed and reliability.
This way, we believe that an infrastructure program totaling about $12.5 billion and new high-speed trainsets costing about $4.5 billion, both in 2024 prices, are enough to build a high-speed rail network permitting trains to reduce the trip times on the Boston-New York and New York-Washington segments to 1:56 each. Today, Amtrak takes 3:40 and 3:00 on those two segments, respectively. The capacity we plan on permits high-speed trains to run on the NEC every 10 minutes around New York, and every 15 minutes near Boston and Washington.
Past proposals have been more expensive, running into the hundreds of billions of dollars.[1] Our proposal avoids such costs by adopting global best practices, in four ways. The first two concern total integration of planning, first between intercity and commuter rail, and second between infrastructure and operations, rather than siloing those aspects, leading to overbuilding. The third concerns separation of expansion from maintenance planning, while the fourth concerns technical standards.
- We plan intercity and commuter rail improvements with coordinated timetables in tandem. The $12.5 billion figure for infrastructure includes $3 billion in electrification and high platforms to speed up the commuter trains using the NEC, so that faster intercity trains don’t get stuck behind them.
- We integrate infrastructure planning, rolling stock purchases, and the timetable. This means rebuilding the timetable from the ground up based on simple, repeating patterns. Where it’s possible to avoid adding new tracks for capacity through better scheduling, we do so. Where it’s not, we propose strategic bypasses and overtakes, aiming to boost both speed and capacity where possible.
- We separate out new infrastructure planning from infrastructure maintenance and renewal, which are routine, regular capital projects and should not be funded as if they were megaprojects.
- We dialogue with European vendors and employ European technical standards, which are generally legal per American regulations but not used in American railroading tradition. These allow us to propose systems that speed up the slowest sections near major stations, lifting the worst slow zones on the NEC. These also limit the costs of necessary repairs to the aging NEC catenary, using cutting-edge technology to avoid having to replace masts at high cost.
Best Industry Standards
Current American railroading practices are conservative, and based on engineering traditions accumulated over generations, with little learning from outside North America even as European and Asian rail technology has long surpassed the United States. Many elements, particularly speedups in station throats and other slow areas, are routine abroad but treated as Herculean efforts in the American rail industry. American expectations of rolling stock, procurement, and timetabling are all well behind routine projects in Europe and East Asia.
| Radius | Typical use | Current speed | Proposed speed |
|---|---|---|---|
| 873 m | Common radius in Connecticut (2°) | 112 km/h (70 mph) | 157 km/h (98 mph) |
| 582 m | 10 worst curves on NY-New Haven (3°) | 96 km/h (60 mph) | 128 km/h (80 mph) |
| 300 m | Sharpest curve (near Bridgeport) | 48 km/h (30 mph) | 92 km/h (57 mph) |
The proposed speed is based on safe limits in both American and European regulations, but practices today are conservative, often based on tradition or on what was thought safe for the trains of the middle of the 20th century.
The second speedup concerns the system used to let trains to switch from one track to another, called a switch or turnout. American turnout geometry is particularly antiquated, and the German geometry we propose is in theory 50% faster, in practice often more than that at major station throats. This way, we find a way to save 4 minutes on just the last mile into Grand Central through better system design
This and other changes in standards require small infrastructure repair changes at low cost, following the principle of slow zones first: it is much more advantageous to speed up a slow segment than a segment that is already fast. Most of the time savings we find between New York and Boston come from such speedups and not from raising the top speed. In contrast, a blanket speed limit to 260 km/h (162 mph) south of New York would only slow the trains by 2.5 minutes relative to our main proposal, in which they top out at 320 km/h (199 mph).
Commuter Rail Practices
The commuter rail lines using the NEC are some of the busiest in the United States. The New Haven Line and the NJ Transit NEC Line are by most definitions the two busiest lines.[2] The double-track North River Tunnel between New Jersey and Penn Station carries 24 trains per hour at the peak, near the practical maximum limit of a rail mainline, leading to the construction of the Gateway Program and its new Hudson River Tunnel to double this capacity.
And yet, American commuter rail practices are antiquated, and in urgent need of reform. The advocacy groups TransitMatters,[3] 5th Square,[4][5][6][7] ETA,[8] and TSTC,[9] have all written on this subject. In short, the mode has developed in a siloed way from the rest of mass transit, designed to just bring people in from the suburbs to city center. Timetabling is designed to favor such riders at the expense of all others, going back to postwar changes in how people were riding mass transit.[10][11][12]
The advocacy groups, looking to European and Japanese practices, have proposed a package of reforms, all aligning with urban mass transit practices. These are as follows:
- Frequent all-day service, rather than just at rush hour, with more regular stopping patterns
- Mode-neutral fares, charging the same as urban rail within the city, and allowing free transfers with buses in the suburbs
- More stations within the city, or at least not skipping the existing urban stations on most trains
- Electrification of all lines, and the purchase of new modern, self-propelled trains (so-called electric multiple units or EMUs)
- High platforms at all stations, to enable fast, wheelchair-accessible boarding
Most of these reforms concern integration with urban rail and buses. However, regular all-day frequency facilitates coordinated planning not just of commuter rail and urban rail and buses, but also of commuter and intercity rail. Today, the New Haven Line runs 16 trains per hour from the main line (and another four from branches) to Grand Central, making 13 different stopping patterns. We consolidate this to just two stopping patterns to Grand Central and one to Penn Station.
Moreover, electrification and high platforms both substantially increase speed and reliability: our schedule for the Providence Line, using EMUs and high-platform stations, shortens the Boston-Providence local trip time to 47 minutes from today’s 72. This is crucial for intercity rail improvements: speeding up the slower trains makes it easier to timetable the faster trains on shared track.
Scheduling Principles
At the heart of our proposal is coordinated, repetitive, top-down scheduling of commuter and intercity trains on the NEC. We simplify the schedules greatly, with fewer stopping patterns and fewer different types of trains: we remove the distinction between the Amtrak Northeast Regional and Acela trains, and reduce the number of stopping patterns on commuter rail. This way, instead of timetabling each daily train individually, we plan one half hour and repeat it all day, in what is called a Takt in the German-speaking world.
The reason behind the proposal’s Takt simplification is that it concentrates all conflicts between trains onto a small number of places, where infrastructure upgrades can fix the conflict. For example, the MBTA Providence Line and the MARC Penn Line are predominantly two-track and run both all-stop commuter trains and high-speed intercity trains making few or no stops. The Takt schedule ensures that the conflicts between faster and slower trains can be contained to specific points on those lines, where there are more than two tracks or where a strategic bypass can be built.
With reliable timetabling comes higher speed. It is not possible to timetable trains precisely when each train has a different stopping pattern and an irregular schedule. As a result, loosely-timetabled trains like those on the NEC today have to come with extensive schedule padding. About 20-25% of the technical running time appears to be added to the schedules today; on the LIRR, one advocate analysis finds that this figure is 28%.[13] In contrast, Swiss,[14] Dutch,[15] and Swedish[16] trains run punctually with just 7% padding. Switching from 25% to 7% padding would reduce trip times by 15%, purely through higher reliability.
Infrastructure Investments
We aim to minimize the required infrastructure spending allowing for high-speed running. Nonetheless, significant investments are unavoidable. We propose two investment scenarios, one low and one high, differing by $5 billion. The timetables are based on the low-investment scenario.
| Project | Cost (in million) | Notes |
|---|---|---|
| NY-DC constant tension catenary | $1,000 | More modern standards permit lower costs than in current plans |
| Kingston-New Haven bypass | $5,000 | |
| New Haven-Stamford bypasses | $3,900 | Excluding Milford; only in high investment |
| New Canaan junction (CP 235) | $300 | |
| Cos Cob Bridge replacement | $100 | Steeper grades and bypass alignment permit lower costs than in current plans |
| Greenwich-Port Chester bypass | $1,000 | Only in high investment |
| New Rochelle junction (CP 216) | $500 | |
| NJ Transit capacity investments | $1,700 | Hunter, Mid-Line Loop, Portal |
| Frankford Junction modification | $300 | |
| BWI Fourth Track | $600 | Cost can likely be lowered |
The above table includes three junctions labeled as such, and a fourth one at Hunter. Those are reliability projects first, replacing flat junctions between branches with flying junctions to grade-separate the NEC from those branches. Among those, a flying junction at CP 216 is practically nonnegotiable, to allow trains on the New Haven Line to go to Grand Central or Penn Station without conflicts with opposing traffic.
The larger projects are primarily for speed, but still have an important reliability measure. The catenary south of New York is in poor condition, and should be replaced based on modern standards, called constant tension in the United States (where it is considered a rare high-speed rail system) and auto-tension in Europe (where it is routine at all speeds). The most expensive item on the list, the New Haven-Kingston bypass, is 120 km (75 miles) long and saves 32 minutes for express New York-Boston trains.
Finally, this proposal also analyzes a series of potential bypasses on the New Haven Line, totaling $5 billion in addition to what is in the above table, saving a total of 7 minutes. These are not included in the main low-investment scenario with the accompanying timetables, but are included in a higher-investment scenario.
Policy Recommendations
Our proposal is based on integration of infrastructure planning, schedule planning, and rolling stock and other technical standards. As such, our recommendations start from a better framework for allowing such planning. Policymakers must be ready to address all of the following points to make the most of the NEC and allow low-cost high-speed rail service on it.
Coordinate planning NEC-wide
The federal government and state agencies must establish a coordinating planning body for the NEC, with the authority to plan schedules, infrastructure, and rolling stock purchases. This necessarily reduces the autonomy of each agency using the NEC, but in truth they are all deriving their funding from the same pot of FRA money for NEC improvements. There already is some coordination in the form of projects like NEC Future and now Connect 2035,[17] which essentially staple together different agency wishlists. To build high-speed rail on the NEC for $17 billion rather than $110 billion, it is necessary to go further with this coordination and instead build an integrated Northeastern Takt timetable, binding Amtrak and all commuter rail agencies.
Adopt best standards for systems and rolling stock
The best standards are well within American regulations in 2025, but are not within the American railroading tradition. These include lightly modified European equipment, modern implementations of such systems as turnouts and catenary, and lower-cost ways of delivering projects as we’ve recommended for subway construction.[18] It is particularly important to learn how to make the most of the higher performance specifications of modern equipment, including not just imported European trainsets but also back-of-the-house equipment like track laying machines. In the medium run, American railroad agencies should send their mid- and early-career staff to foreign conferences and symposiums to learn best practices and assimilate them domestically.
Fund the Connect 2035 projects required for high-speed schedules
Among the projects under discussion but not yet funded, there are ones that stand out as necessary to build. The federal government should fund them immediately, using remaining Bipartisan Infrastructure Law (BIL) funds. They may be critical enough that even without federal funding, state funding may be cost-effective.
The most important of those are the NJ Transit capacity improvements: Hunter Flyover, the Mid-Line Loop, and the mid-level movable version of the Portal South Bridge, which are projected to cost a total of $1.7 billion in 2024 prices. A grade separation of New Rochelle, at CP 216, is required as well and if anything more important than Hunter and Mid-Line, but is at an earlier stage of development, whereas the NJ Transit projects are ready for BIL construction funding.
Deprioritize Penn Expansion and other projects that can be avoided through better timetabling
The largest items on the Connect 2035 list are the expansion of New York Penn Station and its reconstruction. These do not further this goal of coordinated timetabling and should not proceed. The infrastructure investment section gives some details; for more details, see ETA’s report and simulations of Penn Station.[19] A handful of Penn Reconstruction vertical circulation work is prudent, but is a small fraction of the overall project, which lacks any itemized costs allowing the public or even the FRA to review its budget breakdown.
Remove State of Good Repair from the list of projects
Funding bridge replacements and state of good repair (SOGR) out of a pot of money designed for a megaproject leads to bloat, and designing a common capital program for both long-term maintenance and expansion leads to a program that works poorly for both. Megaprojects are inherently risky, and extravagant definitions of the projects decided long before any public debate are routine.[20] The one factor limiting cost growth is that they are flashy and the public comes to expect that the megaproject, such as a high-speed rail line or a subway line, will open. Maintenance and renewal lack this limit, and can only work if funded on an ongoing basis, based on regular performance metrics. SOGR in effect weds the worst problems of megaprojects (cost overruns) with the worst problems of non-megaproject investment (lack of visible progress checking the project).
Indeed, one can compare Connecticut’s SOGR program with rail renewal programs in Germany. Connecticut spent $700-900 million a year on rail infrastructure and equipment in 2017-21,[21] or about $990 million in 2024 prices, for a network comprising about 780 track-km (485 track-miles) and 370 route-km (230 route-miles). The long-term renewal of the Hanover-Würzburg line, required once in several decades (the line opened in 1991), was 850 million euros,[22] or $1.43 billion in 2024 prices, for 327 route-km of which 120 are in tunnel, or 654 track-km (406 track-miles). Once in a generation renewal in Germany costs only 70% more than the annual infrastructure cost in Connecticut, where renewal is a never-ending process in which at any point in time, some section of the New Haven Line is out of service and many are under slow orders.
In lieu of the failed SOGR program, we recommend that maintenance be funded on the same rolling basis as operations, and that methods be realigned with best practices, including highly mechanized trackwork using track laying machines working an entire section at once rather than labor-intensive manual inspections of the fixed plant.
Add strategic bypasses to the Connect 2035 list and begin design work on them immediately
There are projects on the Connect 2035 list that we recommend moving forward with and ones we recommend canceling. Then there are projects not on the list, or heavily modified from the list, that should be built. These are high priorities for planning, as they are in a less advanced state than the already approved projects just waiting for funding.
These include all of the bypasses that we outline, including not just the $5 billion New Haven-Kingston bypass, but also $5 billion in New Haven Line bypasses described in the high-investment scenario. In a low-investment scenario, it is likely that only the New Haven-Kingston bypass deserves to be funded for construction, as it saves 32 minutes whereas the New Haven Line bypasses save 7 minutes for about the same cost. However, it is better to preplan projects and then see how much money is available in capital expansion funding than to scramble for planning funds when money becomes available.[23]
This also includes a Cos Cob Bridge replacement. The replacement planned is not a critical project, and is excessively expensive at $4.25 billion for less than 2 kilometers (a little more than a mile) of trackwork.[24] Ordinarily, we would call for cancellation, as we do elsewhere. However, an alternative alignment incorporating rebuilding the bridge would ease some short, sharp curves, and is included, with suggestions for how to use more modern rail standards to reduce costs.
[1] For example, NEC Future’s preferred alternative is $107-112 billion in 2014 prices, cutting trip times to only 2:10 on New York-Washington and 2:45 on New York-Boston. https://www.fra.dot.gov/necfuture/pdfs/feis/summary.pdf
[2] This depends on whether all lines using the LIRR Main Line are lumped together, or treated as separate branches.
[3] TransitMatters, Regional Rail: Modernizing Commuter Rail, https://transitmatters.org/regional-rail
[4] Camille Boggan and Krista Guerrieri, “Regional Rail is on life support. Essential workers can bring it back.” WHYY, September 2020, https://whyy.org/articles/regional-rail-is-on-life-support-essential-workers-can-bring-it-back/.
[5] Daniel Trubman, “SEPTA’s survival demands investments that will grow ridership,” WHYY, June 2021, https://whyy.org/articles/septas-survival-demands-investments-that-will-grow-ridership/.
[6] 5th Square, “2020 Fair Fares Platform,” https://www.5thsq.org/fair_fares.
[7] 5th Square, “2024 Statewide Issue Platform,” https://www.5thsq.org/2024_issues
[8] Effective Transit Alliance, “Modernizing New York Commuter Rail,” November 2023, https://www.etany.org/modernizing-new-york-commuter-rail.
[9] Tri-State Transportation Campaign, “From Here to There: Regional Rail for Metro New York,” June 2022, https://tstc.org/wp-content/uploads/2022/06/Regional-Rail-for-Metro-New-York.pdf.
[10] Sandy Johnston, “Must (Only) the Rich Have Their Trains?”, master’s thesis, University at Albany: 2016, https://itineranturbanist.wordpress.com/wp-content/uploads/2016/05/final-paper-5-1.pdf; see discussion of the Chicago and Northwestern on pp. 76-84.
[11] Donald Eisele, “Application of Zone Theory to a Suburban Rail Transit Network,” Traffic Quarterly 22 (1), January 1968, pp. 49-67, https://drive.google.com/file/d/1b_6tkYDjDKW8EACmXdQ5zKKozdM2dVJf/view
[12] Donald Eisele, “Zone Theory of Suburban Rail
Transit Operations: Revisited,” Traffic Quarterly 32 (1), January 1978, pp. 5-22, https://drive.google.com/file/d/1reboDERI7KMWYKsJ7V8QSjOqvd_i8UMV/view?usp=drive_link.
[13] Patrick O’Hara, “Need for Speed: Improving LIRR and Metro-North train speeds,” The LIRR Today, February 2020, https://www.thelirrtoday.com/2020/02/improving-lirr-speeds.html.
[14] Marco Innao, “Run Time Allowances in Rail Planning and Travel Time Estimation: International Perspectives and Practices,” July 2024.
[15] Rob Goverde, “Railway timetable stability analysis using max-plus system theory,” Transportation Research Part B 41(2), February 2007, pp. 179-201, https://www.sciencedirect.com/science/article/pii/S0191261506000208.
[16] Piotr Łukasiewicz and Evert Andersson, “Green Train energy consumption: Estimations on high-speed rail operations,” part of KTH Railway Group Gröna Tåget, Stockholm, February 2009, https://www.kth.se/polopoly_fs/1.179876.1600689818!/Menu/general/column-content/attachment/GT%20Energy%20consumption%20slutl.pdf.
[17] https://nec-commission.com/connect-nec-2035/
[18] https://nec-commission.com/connect-nec-2035/
[19] ETA, “Penn Station Can Handle the Load: New York is Ready for Through-Running,” January 2025, https://www.etany.org/penn-station-can-handle-the-load.
[20] Chantal Cantarelli, Bent Flyvbjerg, Bert van Wee, and Eric Molin, “Lock-in and Its Influence on the Project Performance of Large-Scale Transportation Infrastructure Projects” Environment and Planning B: Planning and Design, vol. 37(5) (May 2010), pp. 792-807, https://arxiv.org/ftp/arxiv/papers/1307/1307.2177.pdf.
[21] Connecticut DOT, “New Haven line capacity and speed analysis: final report,” June 2021, https://cslib.contentdm.oclc.org/digital/collection/p128501coll2/id/751227, p. 24.
[22] Deutsche Bahn press release, “Modernisierung der Superlative für eine starke Schiene: Schnellfahrstrecke Hannover–Würzburg für 850 Millionen Euro rundum erneuert,” June 2024, https://www.deutschebahn.com/de/presse/presse-regional/pr-muenchen-de/aktuell/presseinformationen/Modernisierung-der-Superlative-fuer-eine-starke-Schiene-Schnellfahrstrecke-Hannover-Wuerzburg-fuer-850-Millionen-Euro-rundum-erneuert-12907810.
[23] We identify this scramble as one of the reasons for the cost blowout of the Green Line Extension in Boston: it sought planning funds from the same American Recovery and Reinvestment Act that it was also seeking funding for construction from, leading to rushed planning. See Transit Costs Project, “The Boston Case: The Story of the Green Line Extension,” May 2021, https://transitcosts.com/cases/.
[24] Federal Railroad Administration, “NEC Project Inventory,” April 2024, https://railroads.dot.gov/sites/fra.dot.gov/files/2024-04/2024%20NEC%20Project%20Inventory.pdf.
Technical Standards
This section goes over the technical standards for our proposal, used for timetabling the trains on the proposed high-speed rail infrastructure. These standards cover speed on curves and at railroad switches, especially important at major urban train stations. These standards are routine in most of Europe and Asia, and are generally allowed in the United States, but are not used in practice in American railroading, with rare exceptions.
Using these standards instead of American practice would significantly speed up the trains, particularly where they are at their slowest, based on the concept of slow zones first. Minutes can be shaved here and there by turning a 110 km/h (70 mph) zone into a 150 km/h (95 mph) zone, and even more can be saved by entering major urban stations at 40-50 km/h (25-30 mph) rather than at 15-25 km/h (10-15 mph). We find a saving of four minutes just in the last mile into Grand Central, through better design of the turnout system allowing lifting the current 10 mph speed limit and replacing it with partly 40 km/h (25 mph) and partly 60 km/h (35 mph) limits: the last six minutes into Grand Central are reduced to two minutes this way.
Curves
Superelevation and cant deficiency
The speed of a train on a curved track is limited by centrifugal force, using the following formula:
v2 = ar
where a is the acceleration due to centrifugal force, r is the curve radius, and v is the speed. For the formula to work without an additional numerical constant factor, all units need to be SI units, so v is measured in meters per second; in the rest of this document, we convert v to the more usual kilometers or miles per hour.[1]
To counteract the centrifugal force, tracks on curves are banked, which is called cant or superelevation. Passenger trains always go faster than the perfect balancing speed for the curve’s cant, incurring some residual centrifugal force.

Image Source: https://en.wikipedia.org/wiki/Cant_deficiency
The superelevation is measured in units of distance, which convert to units of acceleration with the formula 1,500 mm = 1 m/s^2 on standard-gauge track; the reason for 1,500 mm is that 1,435 mm gauge is measured from inner rail to inner rail and corresponds to about 1,500 mm between rail centerlines. The resultant centrifugal force can be measured in units of acceleration or distance, and in the latter case is called cant deficiency or underbalance; when the train runs slower than the balancing speed, for example if it is a freight train on a passenger line, it is said to be at cant excess. The sum of the cant deficiency and superelevation is called total equivalent cant.
The choice of cant is a compromise between the need to run the train fast and two things: first, the impact of slower trains on the line, including freight trains, or, near stations, local trains; and second, the risk of a train stopping on canted track, in which case the force of gravity would lean toward the inner track. As a result of the latter tradeoff, the maximum cant is usually similar to the maximum cant deficiency on the dominant type of train on the line, or slightly higher.
For our calculations, we use a maximum cant of 180 mm , and a maximum cant deficiency of 150 mm if the train’s speed is 250 km/h or below, or 130 mm otherwise. American regulations are essentially the same except for English/metric rounding artifacts differing by less than 2% from those metric values: 7” cant, 6” cant deficiency. These are limit values and are not to be used on new lines in unconstrained areas, but exist within global regulatory systems in constrained areas such as nearly the entire NEC. These may be compared as follows:
| System | Maximum cant | Maximum cant deficiency |
|---|---|---|
| Shinkansen | 200 mm[2][3] | 110 mm, or 175 mm with tilt |
| France | 180 mm | 160 mm on classical lines, 150 mm up to 250 km/h, 130 mm up to 300 km/h[4] |
| Germany | 180 mm | 150 mm up to 200 km/h, 130 mm up to 300 km/h |
| Sweden | 150 mm[5] | 150 mm, or 245 mm with tilt |
| Italy | 160 mm[6] | 140 mm up to 250 km/h[7] |
| US (current regulations) | 177.8 mm (7”) | Subject to FRA testing, but generally 152.4 mm (6”) without tilt[8] |
| US (current NEC practice) | 152.4 mm (6”) max; most curves are limited to 4-5” | 5” (Regional, south of New York), 3” (commuter rail, all Metro-North service); 7” with tilt (Acela only) |
Current NEC practice limits trains to a total equivalent cant of 10”, which is reduced to 8” between New Rochelle and New Haven, where the curves are some of the tightest on the line. The total equivalent cant we propose, 330 mm (13”), permits a 14% increase in the speed limit on most of the line and a 27% increase on the slowest section. This can be seen in the following table:
| Radius | Typical use | Current speed | Proposed speed |
|---|---|---|---|
| 3,360 m | Compromise curve on high-speed bypass | — | 300 km/h (186 mph) |
| 1,746 m | Common radius in MA, RI, NJ, PA, MD (1°) | 185 km/h (115 mph) | 217 km/h (135 mph) |
| 873 m | Common radius in CT (2°) | 112 km/h (70 mph) | 157 km/h (98 mph) |
| 350 m | Sharp radius near some stations | 72 km/h (45 mph) | 99 km/h (62 mph) |
American railroading traditionally measures curve radius in degrees of curvature, defined as the change in azimuth along a 100’ chord. Many curves have a radius equal to a whole or low-denominator fraction number of degrees: relatively straight segments such as in Rhode Island and Massachusetts and south of New York are built to a 1° standard, and most of the New Haven Line is built to a 2° standard, albeit with multiple tighter curves.
Modifying curve superelevation
To modify the cant deficiency allowed on a curve, all that is required is to allow the trainsets to run faster, subject to FRA testing and certification. In contrast, modifying the superelevation requires physical reconstruction.
Today, on modern railroads, this is done with track laying machines. These are work trains that use the tracks themselves to move along the corridor, and automatically replace different aspects of the fixed plant. The most advanced machines replace the rails, ties, and ballast; in multiple interviews with vendors, we were told that they can move 500 meters an hour while working, or about 1.5 km (just less than a mile) per nighttime work window, which would do the 730 km (454 mi), mixed two- and four-track NEC in four years. Changing the superelevation angle is part of the work, and can also be done by a more routine track laying machine without replacing the rails. Moreover, the superelevation angle can be changed independently of the subgrade drainage angle. Amtrak currently owns two such machines, but Metro-North does not and still does manual track inspections.
The cost of operation of such machines is too low to include in the overall project. The cost of the complete renewal of the Hanover-Würzburg line, 327 km in length of which 120 km are in tunnel, was 850 million euros,[9] or $1.43 billion in 2024 prices. This included total replacement of rails and ties, and renewal work on bridges and tunnels. We don’t expect that such work is required on the NEC, but if it is, it should be costed at $3 billion.
Curve modifications
In various places, the plan calls for curve easements in order to increase the allowable speed. Throughout this, we assume the maximum available cant and cant deficiency are used: 180 mm cant, 150 mm cant deficiency at low and medium speeds transitioning to 130 mm at high speeds.
In practice, one modifies a curve by moving the tracks slightly inward along it. For example, this is a modification of a curve in Kingston, currently with radius 1,431 m (4,695’), to radius 3,200 m (10,499’), speeding it from 202 km/h (126 mph) to 293 km/h (182 mph).

The maximum lateral displacement of the curve, from radius R to radius R’, over a change in absolute azimuth of angle α, is given by the formula (R’ – R)(sec(α/2) – 1); in the case of the above curve, α is 30° (the azimuth is 51° south of the curve and 21° north of it), and the formula outputs 62.4 meters (205’).
Turnouts
When a rail track diverges into two, for example at a junction, at a multi-track rail terminal, or for an overtake, a mechanism that lets the train change tracks must be placed. It is called a turnout or a switch.

Image Source: http://www.railroadfastenings.com/uploads/railway-turnout-and-railway-turnout-components.jpg
The turnout in the diagram, like nearly all in the United States, is based on 19th-century secant standards: the curve of the turnout is not perfectly smooth, and the rails are straight through the frog. Since the 1920s, a new turnout geometry has developed, initially in Germany, since globally, in which the point is finer so as to make the curve perfectly smooth (hence its English name tangential) and usually the curve continues through the frog, allowing a higher speed within the same footprint.
Turnout curves are especially sensitive, because it is not possible to superelevate them. Moreover, the maximum cant deficiency is reduced even with tangential standards, to 110 mm in Germany. Thus, squeezing the highest curve radius possible and highest cant deficiency through tangential standards and curved frogs is necessary.
Turnouts are defined by the tangent of the angle at the frog. German turnouts use the language of 1:n, whereas American ones call the same one #n. Typical turnouts in the United States are #8, #10, and #12. The American rule of thumb is that the maximum speed is twice the turnout number in mph, or about 3.2 in km/h. In contrast, Germany’s tangential geometry with curved frogs can achieve more than 50% higher speeds, about 5-5.5 km/h (3.1-3.4 mph) times the number:
1:7.5: 40 km/h
1:9: 50 km/
1:12: 60 km/h
1:14: 80 km/h
1:18.5: 100 km/h
1:26.5: 130 km/h
On running track on the Northeast Corridor, Amtrak has installed higher-speed turnouts, which use tangential geometry and also have higher switch numbers with longer leads, to allow trains to diverge at higher speeds. However, tangential geometry is not used on most of the corridor, especially not at station interlockings. This is because Amtrak and Northeastern rail agencies in general view tangential switches as a special high-speed rail treatment rather than a standard switch technology used everywhere.
Instead of these current assumptions, we propose that all turnouts to be used by intercity or commuter trains be upgraded to tangential standards, with curved frogs. This is particularly important at station interlockings. The Grand Central Terminal interlocking has 181 switches, of which most do not need to be used in regular service. The switches in the throat of the station nearly a mile out, CP 1, are #12, while those closer to the platforms, about 400 to 600 meters out, are a combination of #6.5, #7, and #8. All service is schedulable on the tracks using #8 switches. With the right scheduling, therefore, the speed in the throat can be raised to 40 km/h in the last 600 meters and 60 km/h in the next kilometer, up from a blanket 10 mph limit today. This would save every train entering Grand Central a total of 4 minutes on just the last mile. At Penn Station, going from a blanket 15 mph limit to 50 km/h would save about a minute on each side.
The cost of a turnout depends on its number, with larger numbers costing more. The hard cost in Chemnitz for a 1:9 is 105,000€, or 138,867€ if a control tower is included, with the actual cost including soft costs about 50% higher;[10] this is about $200,000 per unit in 2024 prices. A project in Essen has cost 200,000€ ($355,000 in 2024 prices) with the switch number unspecified.[11] A rail professional at the MBTA cited a similar number, $250,000 per turnout in 2021 prices for a #10, or about $300,000 in today’s prices.
We estimate the combined number of turnouts at the interlockings at South Station, Penn Station, 30th Street Station, and Washington Union Station at 250. With intermediate station and running line switches, and with the aforementioned 181 Grand Central switches, we estimate the cost of systemwide replacement at $200 million.
Rolling Stock
We assume that all trainsets used on the NEC and its branches are electric multiple units (EMUs). Practically the entire global industries of both high-speed and commuter rolling stock is EMUs. The only non-EMU high-speed trainsets are TGV derivatives, including the Avelia product sold by Alstom, such as the Avelia Liberty in the United States. We moreover assume that the commuter rail EMUs to be used are based on best global practices, which are found in Europe; American EMUs, based on conservative designs from the 1990s or earlier, are heavier and more expensive, and recent orders have had to mix them with unpowered cars to get a favorable cost, reducing their power-to-weight ratios.
In our timetable simulations, we use a power-to-weight ratio of 20 kW/t and an initial acceleration rate of 0.65 m/s2 for the high-speed trainset. This is in line with the performance specifications of European high-speed EMUs including the Velaro Novo,[12] the Hitachi (formerly Bombardier) Zefiro,[13] and likely the CAF Oaris.[14] All three trainsets were shortlisted for High Speed 2, which chose the Zefiro. For commuter rail, we use a power-to-weight ratio of 18 kW/t and an initial acceleration rate of 1.2 m/s2, in line with the technical data of modern European EMUs like the Stadler FLIRT[15][16] or the Siemens Mireo.[17][18]
The Avelia Liberty is difficult to exactly compare with the modeled EMU. It has lower acceleration specifications, but its ability to tilt allows it to achieve higher cant deficiency, up to 7 inches. Overall, we expect these two effects to cancel out in real-world performance, provided Avelia reliability is high.
That said, additional trainsets must be procured for this proposal. There are only 28 Avelias in the Amtrak order, each 212 meters (8.5 cars) long. In contrast, our timetable expects ridership to rise to the point of filling a train every 10 minutes. Even with the speedups we describe in the scheduling and infrastructure investment sections, about 55 trainsets will be required, each 400 meters (16 cars) long to accommodate higher passenger capacity. The Avelias have lower capacity than the EMUs, as their power cars consume 15% of the train’s length.
The costs of the commuter trains are not included in this proposal. Our rolling stock database suggests that these would come to about $3 million per US-length car (25 meters); Chinese and Turkish commuter trains are even cheaper.[19] This is lower than the costs of recent American rolling stock orders, which have been beset by problems, such as divergence from the standards in the largest global markets over time. FRA regulations over the 2010s were realigned with European norms, with input from the vendors, requiring some additional testing but little additional cost.[20] Nonetheless, American agencies have almost never made use of them. Even in cases when they did, such as Caltrain, the client was ill-informed of best practices, leading to problems in project delivery.[21] Better project delivery should permit agencies to buy these more modern trains, which not only have higher performance than the current equipment but also lower upfront and lifecycle costs.
We do include the cost of purchasing new high-speed trains for the network. High Speed 2’s rolling stock order came to £1.97 billion ($3 billion) for 54 200-meter trainsets including 12 years of maintenance. This includes a premium for construction in the United Kingdom itself. In Italy, an order for 40 Zefiro trainsets cost 28.7 million € ($41.6 million) per set.[22] At the HS2 costs, the required fleet for the NEC would cost $6 billion, whereas at the Italian one, it would cost $4.5 billion. The ongoing ICE 3 Velaro order is marginally more expensive than the Italian Zefiro order.[23] We strongly encourage the United States to acquiesce to importing trainsets to get them at the Continental European cost.
[1] If the formula is in non-SI metric units, with v expressed in km/h, then the formula is v2 = 12.96ar. If the formula is in English units, with v in mph, a in mph/second, and r in feet, then the formula is v2 = 0.692ar.
[2] Asahi Mochizuki, “JRTR Speed-up Story 2: Part 2: Speeding-up Conventional Lines and Shinkansen,” JRTR No. 58, October 2011, https://www.ejrcf.or.jp/jrtr/jrtr58/pdf/51-60web.pdf.
[3] David Briginshaw, “Shinkansen: half a century of speed,” IRJ, October 2014, https://www.railjournal.com/in_depth/shinkansen-half-a-century-of-speed/.
[4] Pierre Morom, “La pendulation des trains de voyageurs: Les matériels,” Revue générale des chemins de fer N. 9, 2005, pp. 33-67, https://archive.wikiwix.com/cache/index2.php?url=http%3A%2F%2Fcat.inist.fr%2F%3FaModele%3DafficheN%26cpsidt%3D17143664#federation=archive.wikiwix.com&tab=url.
[5] Martin Lindahl, “Track geometry for high-speed railways: A literature survey and simulation of dynamic vehicle response,” master’s thesis, KTH: Stockholm 2021, https://silo.tips/download/track-geometry-for-high-speed-railways.
[6] Giuseppe Cantisani, Giuseppe Loprencipe, and Lorenzo Puzzo, “Parametri di riferimento per la definizione della geometria dei tracciati ferroviari: limiti di interoperabilità e normativi,” Conference: IV Convegno Nazionale Sicurezza ed Esercizio Ferroviario, Rome, October 2015, https://www.researchgate.net/profile/Giuseppe-Loprencipe/publication/283351036_Parametri_di_riferimento_per_la_definizione_della_geometria_dei_tracciati_ferroviari_limiti_di_interoperabilita_e_normativi/links/5636541d08ae88cf81bd112d/Parametri-di-riferimento-per-la-definizione-della-geometria-dei-tracciati-ferroviari-limiti-di-interoperabilita-e-normativi.pdf.
[7] Nuova Linea Torino Lione: Revisione del Progetto Definitivo: Opere Civili, Geometria, Tracciato, Relazioni Tecniche: Relazione Tecnica di Tracciato http://via.regione.piemonte.it/torinolione/5-%20C3.A%20OPERE%20CIVILI/C3A_23-GEOMETRIA/C3A_23-02-TRACCIATO/C3A_23-02-00-Relazioni%20Tecniche/PD2_C3A_0270_23-02-00_10-01_relazione%20tracciato_B_F.pdf
[8] Federal Register, Vehicle/Track Interaction Safety Standards; High-Speed and High Cant Deficiency Operations, a rule by the Federal Railroad Administration, March 2013, https://www.federalregister.gov/documents/2013/03/13/2013-04679/vehicletrack-interaction-safety-standards-high-speed-and-high-cant-deficiency-operations. The text suggests a train can even meet the standards (0.15 g lateral acceleration taking carbody suspension into account) with 7” cant deficiency, but it also says that the results are similar to limit values in Europe, which are 150-160 mm.
[9] Federal Register, Vehicle/Track Interaction Safety Standards; High-Speed and High Cant Deficiency Operations, a rule by the Federal Railroad Administration, March 2013, https://www.federalregister.gov/documents/2013/03/13/2013-04679/vehicletrack-interaction-safety-standards-high-speed-and-high-cant-deficiency-operations. The text suggests a train can even meet the standards (0.15 g lateral acceleration taking carbody suspension into account) with 7” cant deficiency, but it also says that the results are similar to limit values in Europe, which are 150-160 mm.
[10] VerkehrsConsult Dresden-Berlin, Chemnitzer Modell – Stufe 4: Norderweiterung nach Limbach-Oberfrohna, Kostenschätzung, June 2022, https://www.chemnitz.de/fileadmin/chemnitz/media/unsere-stadt/verkehr/bus_und_bahn/chemnitzer_modell/cm4l_20220601_anhang9_kostenschaetzung_feinplanung.pdf.
[11] Vera Eckardt, “200.000 Euro für Weiche: Bahn bittet Museumsbahn zur Kasse,” WAZ, August 2016, https://www.waz.de/staedte/essen/article12059274/200-000-euro-fuer-weiche-bahn-bittet-museumsbahn-zur-kasse.html.
[12] Siemens press release, “Velaro Novo – the new vehicle concept for high-speed trains,” Berlin, September 2018, https://assets.new.siemens.com/siemens/assets/api/uuid:fe879294-8094-4f10-a45a-1d51509e5800/backgrounder-velaronovo-e.pdf. The initial acceleration of 0.65 m/s2 is imputed from a starting tractive effort of 275 kN and a mass of 420 t for the 360 km/h variant.
[13] Diego Canetta, Bombardier Transportation, “ETR1000/V300ZEFIRO: Il treno del futuro,” July 2015, https://www.cifi.it/UplDocumenti/AV_Freccia1000/BOMBARDIER%20ETR1000.pdf. The initial acceleration described in this datasheet is 0.7 m/s2.
[14] European Register of Authorised Types of Vehicles 13-175-0001-3-001, CAF Oaris, https://eratv.era.europa.eu/Eratv/Home/View/13-175-0001-3-001. No initial acceleration is indicated, but the power-to-weight ratio when full is 20.9 kW/t.
[15] Stadler, FLIRT 160 km/h technical data sheet, https://www.stadlerrail.com/api/docs/x/dda445987e/flirt-160_neutral_en.pdf.
[16] Nederlandse Spoorwegen, “Sprinter (Stadler/Flirt),” 2017, https://www.ns.nl/binaries/_ht_1502695330220/content/assets/ns-en/about-ns/2017/flirt.pdf. The explicit assumption is that the mass of a passenger at the capacity quoted in the data sheet is 70 kg.
[17] Siemens brochure, “Mireo Smart – focused on efficiency,” https://assets.new.siemens.com/siemens/assets/api/uuid:3a02c155-f27e-4d59-8bcd-2413bbfbcc50/siemens-mobility-mireo-smart-data-sheet.pdf.
[18] Alpha Trains, “Technical Details – Mireo,” https://www.alphatrains.eu/en/fleet/trainfinder/?lid=90&iid=3&name=MIREO#trains.
[19] Transit Costs Project, “Rolling Stock Costs,” 2025, https://transitcosts.com/rolling-stock-data/.
[20] Federal Register, Passenger Equipment Safety Standards; Standards for Alternative Compliance and High-Speed Trainsets, a rule by the Federal Railroad Administration, November 2018, https://www.federalregister.gov/documents/2018/11/21/2018-25020/passenger-equipment-safety-standards-standards-for-alternative-compliance-and-high-speed-trainsets.
[21] Martin Ritter, “High quality railway vehicles: North American Market,” Stadler, October 2017, https://slideplayer.com/slide/13671652/.
[22] Fer Press, “Oltre un miliardo di euro per 40 nuovi Frecciarossa 1000. Siglato accordo con Hitachi Rail,” November 2023, https://www.ferpress.it/oltre-un-miliardo-di-euro-per-40-nuovi-frecciarossa-1000-siglato-accordo-con-hitachi-rail/.
[23] Railway Technology, “ICE 3neo High-Speed Trains, Germany,” October 2023, https://www.railway-technology.com/projects/ice-3neo-high-speed-trains-germany/?cf-view.
Commuter Rail Improvements
We consider commuter and intercity trains in tandem, as both use the NEC extensively. One of the most efficient ways of investing in the corridor is to improve the service and performance of local slow trains, which carry the majority of ridership. We do this without degrading local service—to the contrary, we improve it with more regular service, giving riders in such inner suburbs as Canton, Port Chester, Elizabeth, and New Carrollton fast commuter rail service with similar frequency to what the subway offers.
This is done through changing the paradigm of how commuter rail works, toward what many American advocates have come to call regional rail,[1] [2] following the longstanding terminology used by researchers such as Vukan Vuchic.[3] The upgrades involved in this paradigm shift move it toward systems like the RER in Paris, Crossrail and Thameslink in London, the S-Bahn networks of the German-speaking world, and similar networks in Japan, South Korea, Spain, Italy, and Scandinavia. The core elements include all of the following:
- Frequent all-day service, rather than just at rush hour, with more regular stopping patterns
- Mode-neutral fares, charging the same as urban rail within the city, potentially with higher fare zones in the suburbs
- More stations within the city to be opened for infill, to serve more city neighborhoods rather than just the suburbs
- Electrification of all lines, and the purchase of new EMUs
- High platforms at all stations, to enable fast, wheelchair-accessible boarding
Proposals for improvements along those lines have largely come from advocates, such as TransitMatters in Boston, 5th Square in Philadelphia,[4] [5] [6] [7] and ETA,[8] TransitCenter,[9] and TSTC in New York. Nolan Hicks’ Momentum proposal focuses on the last two elements, albeit at higher electrification costs than we find.[10]
Official response has occasionally adopted some of the proposed elements, but never the ground-up redesign around making those networks as useful as their European, Japanese, or Korean counterparts. In 2016, MBTA general manager Frank DePaola even said, “Commuter rail is commuter rail. It’s not transit. It’s designed to bring people into the city in the morning and take them home at night.”[11] This mentality means that reforms are not seriously considered if they turn commuter rail into a more subway-like system, even if their benefit-cost ratio is very high.
The rest of this section goes over the issues of frequency, infill stations, electrification, and high platforms; fares are not covered as they do not pertain to integration with intercity rail, only local urban mass transit. Among the four issues covered, electrification and high platforms require capital investment, which we find to total $3 billion in 2024 prices, split as $820 million on electrification and $2.2 billion on high platforms.
Frequency and Schedule Regularity
Mass transit service must be frequent to be useful for passengers. The bus redesign consultant Jarrett Walker has attracted considerable notice from both agencies and advocates with the expression “frequency is freedom.”[12]
The minimum useful frequency depends on the length of the trip.[13][14][15][16] The elasticity of ridership with respect to frequency is considerable, which is why adding frequency can by itself raise ridership, independently of the need to provide additional capacity. In the literature we have reviewed, the elasticity ranges between 0.3 and 1. The values are higher when the wait time is a larger share of the overall trip, for example on a suburban bus that runs hourly serving much shorter trips. With an elasticity with respect to door-to-door travel time of perhaps -0.8 to -1, a good rule of thumb is that the maximum headway between vehicles at a station should be no more than half the shortest expected trip time.
Up until recently, American transit planning has considered frequency as only a tool for providing the required capacity. At the time frequency guidelines were designed, urban transit frequency was higher than today as peak ridership was higher and labor costs were lower, and so cuts from a subway train every 3 minutes to one every 5 minutes were not visible in ridership, as the trip length was typically much more than twice the longer peak headway. Off-peak ridership was deemed less important to plan around.
The situation today is different. Ridership is less peaky—in fact, while between 1960 and 2019, the total volume of travelers entering the Manhattan core rose from 3.35 to 3.86 million per working day, the volume of travelers entering at the peak hour, between 8 and 9 am, actually fell from 848,000 to 619,500.[17][18] It is critical to plan a frequency regime that works at all hours of day. Every high-ridership European or Japanese commuter line runs at most twice as much service at rush hour as in the midday off-peak. In contrast, the NEC commuter lines run at the following peak and midday frequencies:
| Line | Peak today | Base today | Proposed peak | Proposed base |
|---|---|---|---|---|
| Providence/Stoughton | 4 | 1 | 8 | 4 |
| New Haven | 20 | 4 | 24 | 18 |
| NJ Transit NEC | 12 | 3 | 18 | 12 |
| SEPTA Trenton | 3 | 1 | 3 | 3 |
| Wilmington | 2 | 1 | 3 | 3 |
| MARC Penn | 4 | 1 | 4 | 2 |
The other issue of concern is regularity of stopping patterns. Commuter rail was planned accordingly to only connect the suburbs to the central business district (CBD). In the 1950s and 60s, commuter railways even changed their schedules to shed urban trips and trips terminating short of the CBD, to focus on the core suburb-to-CBD market. At the time, schedules were already complex, with no clear patterns; trains generally stopped at the busier stations more often, but each was scheduled separately.
To focus on the core market and reduce scheduling complexity, planners invented zonal theory,[19][20] in which trains would be timetabled to have only a handful of peak trains serving each suburban station, in a zone with a few other stations with express service to the CBD. The zonal express was intended to simplify not just timetabling but also ticket collection: the zones in the express system were to be aligned with fare zones, so that all passengers on the train would be paying the same fare, facilitating manual ticket sales and collection by conductors. This system is supposed to guarantee faster travel to the CBD, but still has more complex timetables than simpler all-local or binary local-and-express patterns, and makes the schedule vulnerable to disruptions in practice.[21] It is not used on modern commuter lines globally, but is still normal on Metro-North, with its 13 different peak New Haven Line stopping patterns not including the branches.
To simplify schedules and enable suburb-to-suburb trips, we remove the zonal schedules where they are used and consolidate stopping patterns. Nowhere except on trains to New York do we retain express trains; see below on electrification and high platforms, as well as in the scheduling section on timetable padding, for an explanation of how this still allows the trains to run faster than today. We consolidate the New Haven Line’s current service to Grand Central to just two stopping patterns, local to Stamford and express beyond Stamford, and add just one, local to Stamford, for Penn Station trains.
The system we propose has implications to timetable reliability. If every train has a unique identity, then if it is delayed, it’s harder to use another train to substitute for it. Thus, the same train must still run, either delaying all trains behind it or running in the wrong sequence and causing further delays downstream. The less unique each train is, the easier it is to use other trains to substitute for it; a metro line with 40 trains per hour that has a train cancellation can just run 38 tph and it will be a bit more crowded. As a compromise, we run each train pattern in the New York suburbs every 10 minutes, and each pattern in the Boston and Washington suburbs every 15.
For our overall high-speed rail proposal, the frequency proposed is a train every 30 minutes to the local-only stations, such as New London, and a train every 10 or 15 to the rest, such as New Haven and Philadelphia, at which point the relationship between frequency and ridership saturates, and further increases in frequency are only justifiable if demand increases.
Infill Stations
The norm for high-performance commuter rail is to make regular stops every 1-3 km (about 0.5-2 mi), in both the city and the suburbs. In contrast, in the 1950s and 60s, American railroads removed urban stops, in order to focus on the suburban market.[22] To make commuter rail more useful for the urban market, some agencies have begun adding stops on lines dedicated to urban usage, most notably the MBTA Fairmount Line, which added four new stations in the 2010s; advocates have been pushing for even more on some lines. We do not include the costs of such projects in this report, but do look at how to timetable intercity trains with them.
Agencies or advocates propose further infill at two places on the NEC: in Boston on the Providence Line’s trunk, and in Queens on Penn Station Access.
Boston
Two stations on the Providence Line’s trunk, Forest Hills and Readville, are served by commuter branches that use the same trunk but not the Providence Line itself. Our timetables include Forest Hills but not Readville. Potentially, both stations could be included. The timetables could be adjusted easily given the locations of overtakes: Readville is itself an overtake location and it adds no schedule complexity for Providence Line commuter trains to stop there.
New York
Penn Station Access is not only connecting the New Haven Line to Penn Station, but also adding four infill stops in the Bronx and four-tracking most of the route, to reduce timetable dependence between intercity and commuter trains. However, no stops are included in Queens.
In Queens, three infill locations have been studied: at the Astoria N/W subway station, at Sunnyside Yards, and in Long Island City on Queens Boulevard near Queens Plaza. The first two were studied in early alternatives analyses and rejected due to construction difficulties and low projected ridership, as the operating assumptions did not include high frequency and subway fares but rather low off-peak frequency and premium fares.[23] The last was included on the MTA 20 Years Needs Assessment.[24]
In our timetables, there is leeway for two out of the three locations with practically no modification of the rest of the schedule. If all three are included, then the double-track Hell Gate Line from Parkchester to Sunnyside needs additional work to add more tracks, or alternatively the intercity trains can be delayed by about one minute.
Electrification
Every high-performance commuter line in the world runs electric trains, supplied by overhead wire or occasionally third rail, not batteries. Electric locomotives are rare and phased out and battery-electric locomotives even rarer, and nearly the entire industry uses EMUs, for all of the following reasons:[25][26]
- EMUs have more powerful motors than diesel trains and better traction than locomotive-hauled trains, and therefore accelerate much faster.
- Electric trains have much lower breakdown rates than diesel trains. The LIRR’s diesel fleet had a mean distance between failures in 2024 of 82,000 km (51,000 mi), but the contemporary M7 EMUs had an MDBF of 494,000 km (307,000 mi).[27] On Metro-North, the M7s had an MDBF of 1,200,000 km (746,000 mi) in 2024 and the M8s used on the New Haven Line 1,208,000 km (751,000 mi), while the MDBF of the diesel fleet, built partly contemporarily with the M7 and partly with the M8, was 64,000 km (40,000 mi).[28]
- EMUs have half the lifecycle costs of diesel trains.[29]
- EMUs have lower lifecycle costs than battery-electric vehicles, which some American agencies have chosen to procure in lieu of wiring,[30][31] on busy lines. In one German analysis, whether an EMU or a battery train (BEMU) is more cost-effective depends on the line’s peak frequency, with the breakeven point occurring around a two-car train every 30 minutes.[32] The upfront purchase cost of a BEMU appears to be about twice that of an EMU in our rolling stock cost database.[33]
- Electric trains emit no point-source pollution. While most air pollution from transportation comes from cars and trucks, areas near railways with high use of diesel trains have elevated local pollution levels.[34]
The speed benefits are of especial importance when timetabling slow and fast trains together, since the use of EMUs greatly speeds up the slow trains, particularly when they make many stops. The quantity of interest is the total stop penalty, summing up the time the train loses to acceleration and deceleration. The following table shows the various stop penalties in seconds, depending on the top speed of the line. Two types of EMU are included, the legacy M8 and modern European single-deck EMUs such as the Stadler FLIRT, the Alstom Coradia, and the Siemens Mireo. The locomotive-hauled trains are all assumed to be dragging six single-level cars full to standing capacity.[35]
| Train type | 100 km/h (62 mph) | 130 km/h (81 mph) | 160 km/h (99 mph) |
|---|---|---|---|
| EMU (modern) | 24.6 | 35 | 47.9 |
| EMU (legacy) | 30.3 | 44.7 | 63.5 |
| DMU | 33.2 | 50.3 | 73.4 |
| Electric locomotive | 58.6 | 77.4 | 97.2 |
| Diesel locomotive | 58.7 | 80.2 | 108.5 |
In theory, this means that going from diesel locomotives to EMUs on the Providence Line and the MARC Penn Line would by itself reduce trip times by 1 minute per stop at 160 km/h. In practice, the difference is larger. On long interstation stretches the diesel locomotive often does not go that fast since it would spend little time at top speed, wasting another 10-20 seconds per station.
Freight rail electrification proposals in the United States have come in at $2 million/km[36] (3.2 million/mi) or even less.[37] Notably, the $2 million/km figure is on a long stretch of the Southern Transcon, which is double-track and runs 60 trains per day with three to four locomotives each, requiring more power than all unelectrified American commuter lines (the busiest, the BNSF Line in Chicago, runs 89 single-locomotive trains per day). The RIA Electrification Cost Challenge claims a typical project should cost £1-1.5 million per single-track km,[38] or about $3.8-5.7 million/km ($6.1-9.1 million/mi) on a double-track line, and the UK has high costs for Europe. Germany claims a range of $2.4-6.3 million/km ($3.9-10.1 million/mi) for single-track electrification,[39] and other European costs have been toward the lower end even for double-track electrification, such as Paris-Troyes at $3.3 million/km[40] ($5.3 million/mi) and Lunderskov-Esbjerg at $4 million/km ($6.4 million/mi).[41] Italian costs average $2.4 million/km ($3.9 million/mi) largely on single track, inclusive of tunnel modification and other civil works.[42] We take the cost as $2 million/km on single track and $4 million/km on double track.
The following branches of the NEC need to be wired for the program:
| Line | Length | Double-track? | Cost |
|---|---|---|---|
| Fairmount | 15 km (9 mi) | Yes | $60 million |
| Franklin | 34 km (21 mi) | 9 km (6 mi) to Norwood Central | $85 million |
| Stoughton | 6 km (4 mi) | 1 km (0.6 mi) to Canton Center | $15 million |
| Waterbury | 46 km (29 mi) | No, only sporadic meets | $100 million |
| Danbury | 38 km (24 mi) | No, only sporadic meets | $90 million |
| Morristown | 27 km (17 mi) | 9 km (6 mi) to Lake Hopatcong | $70 million |
| Montclair-Boonton | 30 km (19 mi) | No | $60 million |
| Raritan Valley | 73 km (45 mi) | 47 km (29 mi) to Raritan | $240 million |
| North Jersey Coast | 25 km (16 mi) | Yes | $100 million |
| Total | 294 km (183 mi) | 106 km (66 mi) | $820 million |
The cost of purchasing new EMUs for commuter rail is not included. Commuter rail agencies buy trains on a rolling basis, and should procure new modern EMUs as they electrify, at lower cost than they buy non-EMU equipment.
High Platforms
Nearly all modern commuter rail systems in the world have level boarding, setting up trains and platforms of the same height. It is imperative to raise all platforms to the chosen boarding height. The benefits are about universal access: level boarding permits wheelchair users to board unaided, while also benefiting able-bodied users who have strollers, luggage, or bicycles. Even if all riders are able-bodied and travel light, it is much faster to board without the steps onto the platforms than with them.
For the purposes of timetabling, the metric is the length of time the train stays at the platform with its doors open, the dwell time. Level boarding both reduces the average dwell time and reduces the variability of the dwell time, as a passenger in a wheelchair, or a queue of passengers at a particular door, does not delay the train by as much.
Dwell times on busy commuter lines with level boarding are usually kept to 30 seconds,[43] except at the most central stations—for example, the RER has 55 second dwell times at Gare du Nord at rush hour,[44] the busiest station in the system, with ridership per train approaching that of New York Penn Station. Stockholm has 42-second dwells at most stations.[45] Passengers readily observe 30-second dwell times on S-Bahn networks, some city center stations excepted.[46]
Without level boarding, dwell times are considerably longer and more variable. Caltrain averages 58 seconds, and has dwell times longer than 90 seconds 11% of the time.[47] At rush hour, the MBTA has to timetable four minutes for dwelling at Mansfield, the busiest station at the peak on the Providence Line, to take into account the possibility of a larger than anticipated dwell time. In contrast, in Paris on the RER A, the dwell time is longer than 90 seconds only 3% of the time even on the central section,[48] where the busier stations have more than 100,000 boardings per weekday and the least busy, Nation, has about 14,000.[49]
The TRB likewise finds that level boarding roughly halves the time it takes each passenger to get on or off the train, comparing light rail lines with and without it.[50] A train designed around level boarding also has better flow than a train designed around its absence: non-level-boarding lines on the NEC operate in an environment of mixed heights, so they have doors at the vestibule ends of the car, with manually-operated trap doors for use at stations with low platforms. Even when there is level boarding, such doors are so narrow and poorly located that it takes a passenger 1.8 seconds to use them, twice the time required at a wide door located mid-car or at the quarter-point—and if the doors are still operated manually, then only half the doors even open at current commuter rail practice.[51]
As explained in the scheduling section below, our proposal uses tight timetabling, on which the technical travel time is only padded by 7% to produce the final schedule. This is only possible if there is level boarding, or at worst near-level boarding, with one step between the platform and train, as sometimes happens at legacy European systems with platform heights varying by 20-40 cm. Without level boarding, the schedule padding must be increased. Thus, in theory, level boarding saves passengers about 30 seconds per busy suburban stop, decreasing on less busy lines than the Providence Line or Caltrain, but in practice the saving is greater as the extent of padding can be adjusted downward.
The cost of high platforms is set based on American levels, due to vigorous programs already in progress. The LIRR is already entirely high-platform and east-of-Hudson Metro-North is completing the last stations on the Waterbury Branch, leaving only three part-time flag stops on the Hudson and Harlem Line with low platforms. The most difficult station locations are in Newton, where the MBTA’s ongoing project is constrained by I-90, with little space for the platforms, let alone for staging; the projected cost per station there is $45 million, whereas at most other places in the system the costs quoted are $25-30 million, also matching SEPTA costs.[52] NJ Transit’s 2020 capital plan cites the cost as $790 million for 30 stations in 2020 prices, which is $32 million per station in 2024 prices.[53] Metro-North’s last six stations to be upgraded, on the Waterbury Branch, are costing a total of $135 million.[54][55] MARC’s remaining low-platform stations are being upgraded as well. The total scope of the program, beyond the above $790 million and existing SEPTA and MBTA projects, is as follows:
| Agency | Lines included | Stations | Cost |
|---|---|---|---|
| MBTA | Providence, Stoughton, Franklin, Fairmount | 20 | $500 million |
| NJ Transit | NJ Coast, Morris and Essex, Montclair-Boonton | 42[56] | $1.2 billion |
| SEPTA | Trenton, Wilmington | 18 | $500 million |
The total cost of this is therefore $2.2 billion.
[1] TransitMatters, Regional Rail: Modernizing Commuter Rail, https://transitmatters.org/regional-rail
[2] Tri-State Transportation Campaign, “From Here to There: Regional Rail for Metro New York,” June 2022, https://tstc.org/wp-content/uploads/2022/06/Regional-Rail-for-Metro-New-York.pdf.
[3] Vukan Vuchic, “Recent Transit Developments in North America”; Proceedings of the Symposium on Public Transport Futures, Nottingham, April 1986, pp. 69-84. https://repository.upenn.edu/server/api/core/bitstreams/853f39a7-389a-442e-942e-aaeebbe33d0c/content
[4] Camille Boggan and Krista Guerrieri, “Regional Rail is on life support. Essential workers can bring it back.” WHYY, September 2020, https://whyy.org/articles/regional-rail-is-on-life-support-essential-workers-can-bring-it-back/.
[5] Daniel Trubman, “SEPTA’s survival demands investments that will grow ridership,” WHYY, June 2021, https://whyy.org/articles/septas-survival-demands-investments-that-will-grow-ridership/.
[6] 5th Square, “2020 Fair Fares Platform,” https://www.5thsq.org/fair_fares.
[7] 5th Square, “2024 Statewide Issue Platform,” https://www.5thsq.org/2024_issues
[8] Effective Transit Alliance, “Modernizing New York Commuter Rail,” November 2023, https://www.etany.org/modernizing-new-york-commuter-rail.
[9] TransitCenter, “Renewing the New York Railroads: How Affordable, Frequent Metro-North and LIRR Service Can Grow Ridership and Expand Opportunity,” December 2022, https://transitcenter.org/wp-content/uploads/2022/12/Renewing-the-Railroads_RGB_Online-1.pdf.
[10] Nolan Hicks, Momentum, NYU Marron Institute, April 2025, https://transitcosts.com/wp-content/uploads/Momentum-V2a3-Ch1-12.pdf.
[11] Matt Robare, “Parkway residents voice concerns over commuter rail fares,” Wicked Local, March 2016, https://www.wickedlocal.com/story/transcript-tab/2016/03/10/parkway-residents-voice-concerns-over/32414785007/.
[12] Jarrett Walker, Human Transit, Island Press, 2011: https://humantransit.org/book.
[13] Armando Lago, Patrick Mayworm, and Matthew McEnroe, “Ridership Response to Changes in Transit Services,” Transportation Research Board, 818 (1981), pp. 13–19, https://onlinepubs.trb.org/Onlinepubs/trr/1981/818/818-003.pdf.
[14] Todd Litman, “Transit Price Elasticities and Cross-Elasticities,” Journal of Public Transportation, 7 (2) (April 2004), pp. 37–58, https://www.sciencedirect.com/science/article/pii/S1077291X22003861.
[15] Joe Totten and David Levinson, “Cross-Elasticities in Frequencies and Ridership for Urban Local Routes,” Journal of Public Transportation, 19 (3) (July 2016), pp. 117–125, https://digitalcommons.usf.edu/cgi/viewcontent.cgi?referer=&httpsredir=1&article=1487&context=jpt.
[16] Hiroyuki Iseki, Brian D. Taylor, and Mark Miller, “The Effects of Out-of-Vehicle Time on Travel Behavior: Implications for Transit Transfers,” prepared for California DOT (2006), https://www.its.ucla.edu/wp-content/uploads/sites/6/2014/06/Appendix-A.pdf.
[17] Regional Plan Association, Hub Bound Travel, December 1961: https://s3.us-east-1.amazonaws.com/rpa-org/pdfs/1961_RPABulletin99.pdf.
[18] New York Metropolitan Transportation Council, Hub Bound Travel Data Report 2019, pub. 2021: https://www.nymtc.org/Portals/0/Pdf/Hub%20Bound/2019%20Hub%20Bound/DM_TDS_Hub_Bound_Travel_2019.pdf.
[19] Donald Eisele, “Application of Zone Theory to a Suburban Rail Transit Network,” Traffic Quarterly 22 (1), January 1968, pp. 49-67, https://drive.google.com/file/d/1b_6tkYDjDKW8EACmXdQ5zKKozdM2dVJf/view
[20] Donald Eisele, “Zone Theory of Suburban Rail Transit Operations: Revisited,” Traffic Quarterly 32 (1), January 1978, pp. 5-22, https://drive.google.com/file/d/1reboDERI7KMWYKsJ7V8QSjOqvd_i8UMV/view?usp=drive_link.
[21] Vukan Vuchic, Urban Transit: Operations, Planning, and Economics, Wiley, 2nd ed., 2017: https://www.google.com/books/edition/Urban_Transit/4pU-DwAAQBAJ?hl=en&gbpv=1, Section 2.4.2.
[22] Sandy Johnston, “Must (Only) the Rich Have Their Trains?”, master’s thesis, University at Albany: 2016, https://itineranturbanist.wordpress.com/wp-content/uploads/2016/05/final-paper-5-1.pdf; see discussion of the Chicago and Northwestern on pp. 76-84.
[23] PBQD, “Metro-North Penn Station Access Major Investment Study/Draft Environmental Impact Statement: Comparative Screening Results Report,” September 2002, https://www.mta.info/document/36621.
[24] MTA, “The Future Rides With Us: MTA 20-Year Needs Assessment (2025-2044),” October 2023, https://future.mta.info/documents/20-YearNeedsAssessment_Report.pdf.
[25] TransitMatters, “Regional Rail Electrification: Costs, Challenges, Benefits,” 2021, https://static1.squarespace.com/static/533b9a24e4b01d79d0ae4376/t/617ab7300ffe59061878be08/1635432241916/Regional+Rail+Electrification+Final.pdf.
[26] ETA, “A Not-So-Capital Plan, Part 2: The Future is Electric,” 2024, https://www.etany.org/not-so-capital-plan-the-future-is-electric
[27] MTA Metrics Dashboard, 2025, https://metrics.mta.info/?lirr/meandistancebetweenfailures
[28] MTA Metrics Dashboard, 2025, https://metrics.mta.info/?mnr/meandistancebetweenfailures
[29] Heiner Bette and Adriaan Roeleveld, “Benchmarking identifies good practice in rolling stock maintenance,” Railway Gazette, April 1, 2006, https://www.railwaygazette.com/news/benchmarking-identifies-good-practice-in-rolling-stock-maintenance/27406.article
[30] Kathy Hochul press release, “Governor Hochul Announces Metro-North to Operate First-in-the-Nation Battery- and Electric-Powered Locomotives for Penn Station Access,” February 2025, https://www.governor.ny.gov/news/governor-hochul-announces-metro-north-operate-first-nation-battery-and-electric-powered.
[31] MBTA press release, “MBTA Board Approves Keolis Plan to Introduce Battery Electric Trains on Fairmount Commuter Rail Line,” July 2024, https://www.mbta.com/news/2024-07-25/mbta-board-approves-keolis-plan-introduce-battery-electric-trains-fairmount.
[32] VDE, “Alternativen zu Dieseltriebzügen im SPNV,” 2019, https://web.archive.org/web/20240223194345/https://www.vde.com/resource/blob/1885872/5f42b90859412b8590d0c7539604b0bc/studie-alternativen-zu-dieseltriebzuegen-im-schienenpersonennahverkehr-data.pdf
[33] Transit Costs Project, “Rolling Stock Costs,” 2025, https://transitcosts.com/rolling-stock-data/.
[34] Daniel A. Jaffe et al, “Diesel particulate matter emission factors and air quality implications from in–service rail in Washington State, USA,” Atmospheric Pollution Research Vol. 5 (2), April 2014, pp. 344-351, https://www.sciencedirect.com/science/article/pii/S1309104215303342.
[35] American commuter rail cars maximize seated at the expense of standing capacity. The capacity used for coaches and M8s is deemed to be 140 per car at 70 kg/passenger, proportionately the same per train length as the FLIRT DMU described in the Elron datasheet: https://s92be7b29b1ba9b06.jimcontent.com/download/version/1494436987/module/9570768199/name/Elron%20FLIRT.pdf. The deceleration rates of all trainsets are deemed to be the same as the electric braking rate of a modern European EMU.
[36] C. Tyler Dick et al, “Modeling the Economics of Modern Options for Mainline Freight Railway Electrification,” W.W. Hay Seminar (November 2024), https://railtec.illinois.edu/wp/wp-content/uploads/2024_11_08-Hay-Seminar_Tyler-Dick_compressed.pdf.
[37] James Hoecker and Steve Griffith, “Rail Electrification in North America: Benefits and Barriers,” NEMA (2022), https://www.nema.org/docs/default-source/technical-document-library/benefits-of-rail-electrification-final.pdf?sfvrsn=32e792e4_0.
[38] Rail Industry Association, “RIA Electrification Cost Challenge,” March 2019, https://www.nsar.co.uk/wp-content/uploads/2019/03/RIAECC.pdf.
[39] BMDV, “Kostenvergleich: Streckenelektrifizierungen versus Einsatz alternative Antriebe,” January 2021, https://bmdv.bund.de/SharedDocs/DE/Artikel/E/schiene-aktuell/kostenvergleich-streckenelektrifizierungen-versus-einsatz-alternative-antriebe.html.
[40] Luc Nguyen and Arnaud Zimmermann, “Expertise des coûts de la seconde phase de l’électrification de la ligne Paris-Troyes,” IGEDD, July 2024, https://www.vie-publique.fr/files/rapport/pdf/296504.pdf
[41] Railway Gazette, “Esbjerg electrification approved in four-point Danish transport plan,” February 2012, https://www.railwaygazette.com/infrastructure/esbjerg-electrification-approved-in-four-point-danish-transport-plan/36654.article.
[42] Marco Morino, “Ferrovie, investimenti da 1,4 miliardi per l’elettrificazione della rete,” Il Sole 24 Ore, September 2020, https://ntplusentilocaliedilizia.ilsole24ore.com/art/ferrovie-investimenti-14-miliardi-l-elettrificazione-rete-ADKbfnn. This is in addition to an internal database of Italian costs in which costs higher than 1 million euros/km in 2020 prices, or $1.7 million/km ($2.7 million/mi) in 2024 prices, appear restricted to projects with significant civil works bundled, such as grade separations or tunnel and bridge reconstruction; projects without those are significantly cheaper.
[43] Olivier Razemon, “RER : le palmarès des stations les plus fréquentées,” Le Monde, April 2015, https://www.lemonde.fr/blog/transports/2015/04/08/rer-le-palmares-des-stations-les-plus-frequentees/.
[44] STIF, “Presentation au Comité de Ligne B,” November 2010, https://archive.wikiwix.com/cache/display2.php?url=http%3A%2F%2Fweb.archive.org%2Fweb%2F20131212140924%2Fhttp%3A%2F%2Fwww.stif.org%2FIMG%2Fpdf%2FPresentation_de_la_RATP_et_de_la_SNCF_au_comite_de_ligne_du_RER_B_du_29_novembre_2010.pdf.
[45] Carl-William Palmqvist, Norio Tomii, Yasufumi Ochiai, “Explaining dwell time delays with passenger counts for some commuter trains in Stockholm and Tokyo,” Journal of Rail Transport Planning & Management Vol. 14 (2020), https://www.sciencedirect.com/science/article/pii/S2210970619301003.
[46] Own calculations, focusing on Berlin and secondarily Munich and Zurich.
[47] 2010 Caltrain On-Board Bike Count and Dwell Time Summary Report, pp. 23-27, https://web.archive.org/web/20170110163414/https://www.caltrain.com/Assets/__Agendas+and+Minutes/BAC/Materials/2011/Bike+Count+$!26+Dwell+Time+Report.pdf.
[48] STIF, Déliberation n. 2012/0163, June 2012, https://archive.wikiwix.com/cache/display2.php?url=http%3A%2F%2Fweb.archive.org%2Fweb%2F20170811183736%2Fhttps%3A%2F%2Fwww.iledefrance-mobilites.fr%2Fwp-content%2Fuploads%2F2017%2F04%2FDeliberation_no2012-0163_relative_au_schema_directeur_du_RER_A.pdf.
[49] Imputed from annual entries from RATP Open Data, “Trafic annuel entrant par station du réseau ferré 2019,” https://data.ratp.fr/explore/dataset/trafic-annuel-entrant-par-station-du-reseau-ferre-2019/information/.
[50] TRB, TCRP Report 13: Rail Transit Capacity, https://onlinepubs.trb.org/onlinepubs/tcrp/tcrp_rpt_13-b.pdf, p. 42.
[51] Jacobs, “Fairmount Line Corridor Improvements Project: Service Enhancement Study Final Report,” April 2008, https://www.bostonplans.org/getattachment/65e7d1d0-a8ec-4dcc-a08e-55fe7c9f2ced, pp. 15-17.
[52] SEPTA’s high platform conversions have been cheaper than the MBTA and NJ Transit’s, as most have been on less busy lines. Cornwells Heights if $30 million in YOE dollars, perhaps $28 million deflated to 2024 prices. SEPTA, “New High-Level Platform at Cornwells Heights Station,” December 2023, https://wwww.septa.org/news/cornwellheightsstationplatform/.
[53] New Jersey Transit, 2020 Capital Plan Appendix B: Project Sheets, https://web.archive.org/web/20220422162515/https://njtplans.com/downloads/archived/capital-project-sheets/2020%20Capital%20Plan%20project%20sheets.pdf, pp. 90-92.
[54] CTDOT, Project 0304-0029 Webpage, 2023, https://web.archive.org/web/20231108193512/https://portal.ct.gov/DOTNaugatuck0304-0029.
[55] CTDOT, Project 0304-0022 and 0304-0024 Webpage, 2024, https://portal.ct.gov/dot/-/media/dot/projects/project304-22-24/20241106_waterbury-line-final-design_public-meeting-info_rev1_no-notes-version.pdf.
[56] 68 stations on those lines are low-platform, but 26 are included in the 2020 capital plan already.
Scheduling
From the perspective of the passenger, the final product is the timetable: the passenger does not care or know about which bypasses have been built or how fast the train accelerates, but does see the departure and arrival times of the trains using the corridor. Thus, all planning must be based on the desired schedule.
The core of our timetabling principles is the repeating timetable, called by the German name Takt. We use the Takt concept to reduce the schedule to a handful of rigid patterns, such as a commuter train running regularly every 15 minutes making all stops between Boston and Providence, or one running every 10 minutes making all stops between Penn Station and Stamford via the Penn Station Access tracks. As the commuter rail section explains, today there are 16 Metro-North trains per hour (tph) running on the main line of the New Haven Line into Grand Central at rush hour making 13 distinct stopping patterns; our schedule expands service to 18 tph, but they only make three different stopping patterns. The simpler service pattern is easier to remember for passengers, and easier to plan, ensuring that conflicts between trains can be contained to specific points to receive infrastructure upgrades.
This is especially important because all schedules must be padded, to allow trains to recover from delays. The current schedules on the NEC are padded by 20-30%: if the technical travel time is 100 minutes, then the scheduled time is 120-130 minutes. In contrast, an NEC-wide Takt based on Swiss and Dutch principles stands to reduce the required padding to 7%, cutting about 15% from all trip times regardless of any other infrastructure upgrades. The cuts in padding come from upgrades described in technical standards as well as from the simpler Takt scheduling we describe in this section.
Takt Principles
For sound timetable design, all trains must run on a fixed, repeating timetable, called by the German name Takt. This simplifies both the schedule as seen by the passenger, who has an easily memorizable timetable, and the planning process, as only one hour needs to be planned, all others repeating regularly. This proposal uses the Takt principles throughout, governing commuter rail, intercity rail, and the interaction between them. Those work as follows:
- The schedule must be a repeating clockface schedule. In the timetable in the appendix, a local NJ Transit commuter train from Manhattan to North Brunswick arrives at Elizabeth at 8:34 in the morning, and the peak interval is 10 minutes, and therefore, another outbound local commuter train must also arrive Elizabeth at :04, :14, :24, :34, :44, and :54 throughout the peak. If there is more peak than off-peak service, then the peak must be an even multiple of the off-peak for simplicity, in practically all cases 2. In the Elizabeth example, there would be a local commuter train arriving at :14, :34, and :54 every hour off-peak.
- The schedule must be symmetric. This means that a point along the hour is chosen to act as a symmetry axis, in our case :00. In the Elizabeth example, since a train from Manhattan arrives at :34, a train to Manhattan departs at :26, also on a 10-minute peak and 20-minute off-peak Takt.
- The number of distinct stopping patterns must be small. On a commuter line, at most two patterns should be used, local and express, with consistent stops on express trains. A single trunk line should be based on overlaying several lines’ Takt patterns together, and as far as possible, this should be a few short-interval patterns and not many long-interval patterns. A timetable with 12 30-minute Takt patterns is less stable than one with four 10-minute ones.
- Express trains should be timed to overtake local trains at consistent locations, which are then upgraded with additional tracks. Long stretches of three- and four-tracking should be avoided except at very high frequencies, and are not necessary with local and express trains each running every 15 minutes, or in extreme cases even every 10. When two distinct lines meet, as far as possible the meeting point should have a timed transfer, and if possible the transfer should be timed in multiple directions.
These principles govern the choice of rolling stock and infrastructure. On a single-track line, Takt principles are used to minimize the cost of double track infrastructure projects, because they ensure that the meets will happen at a consistent place. We use this principle heavily for sections of the NEC that are triple-track, in which case the express (intercity) trains are briefly on a single track while the local (commuter) trains use the two local tracks. On a double-track line, Takt principles likewise reduce the required four-tracking if slow and fast trains use the same tracks.
One upshot of the Takt timetabling approach is that all trains on the corridor must have controllable schedules. Freight trains can be accommodated within specific windows in off-peak periods, running on the local tracks to reduce the speed difference. But intercity passenger trains without high reliability cannot be accommodated. The Swiss rail network stops a significant proportion of ICE through-trains on account of Germany’s poor punctuality[1][2] and has entirely cut some through-connections,[3] requiring travelers from Germany to transfer.
A modernized NEC must learn from the Swiss example and terminate long-distance Amtrak at Washington Union Station and require passengers going to points north to transfer. If a northbound long-distance train is delayed, passengers should be rebooked for free on the next available NEC train, with the high frequency of the NEC substituting for guaranteed connections. With the long-distance Amtrak trains having about 300 seats and the 16-car high-speed trains we propose having about 1,000, even a delayed long-distance train would not overwhelm the next NEC train. The only trains we allow to use the NEC and go beyond it are Keystone trains, on the electrified, passenger-primary Philadelphia-Harrisburg route, and the New Haven-Springfield trains if the line is electrified. The extra transfer to the minority of passengers who ride those long-distance trains is balanced by faster end-to-end trip times even with the transfer, and by much better reliability for the large majority of passengers who ride internally to the NEC or its electrified branches.
Timetable Padding
All rail schedules must be padded with contingency or buffer time. The extent of the buffer time depends on the network: simpler networks require less contingency, since there is less room for delays to propagate. A small portion of the buffer time also accounts for suboptimal driver behavior: drivers do not begin to brake at the last possible moment, and often do not take advantage of small speedups between slower sections. However, the lion’s share depends on the characteristics of the network and its reliability.
The Shinkansen operates completely separately from all other traffic south of Tokyo and nearly completely separately north of Tokyo, and based on this experience, JR East recommended 3-5% contingency for California High-Speed Rail, which chose 5% on dedicated tracks.[4][5] Within Europe, Switzerland runs punctually with 7% padding, even with track sharing between faster intercity trains and slower commuter trains, while the TGV network pads by 10-14% and the German intercity rail network by 20-30%.[6][7] Sweden, running fast and slow trains on the same double-track main lines, pads 3% plus a minute per 100 km (62 mi), which is about 7% on its medium-speed lines.[8] In the Netherlands, the pad factor is 7% plus rounding up to whole minutes.[9]
The high pad factor of the German rail system has to be understood as a result of a complex two-dimensional interconnected network on which high-speed trains share tracks with regional trains over long distances. The NEC as we plan has track sharing across speed classes as well, but for shorter distances, and the network is fundamentally one-dimensional with branches, rather like the Shinkansen. The Swiss and Dutch networks are intermediate between the single line of the NEC or Shinkansen and the fully two-dimensional German network.
The Northeastern US operates trains with a high degree of timetable padding. The percentage is not fixed, but on the LIRR, analysis by the advocate Patrick O’Hara based on variation of time between different trains finds 29% padding.[10] On the NEC itself, travelers on both Amtrak and Metro-North report that trains often arrive early, and often recover long delays, consistent with 20-25% padding; one Metro-North train engineer reports 30% padding. This is not due to the inherent complexity of the NEC as a system, but rather due to decisions made by management over decades to schedule each daily train by itself, with no regularity of stopping patterns and no Takt.
One- and Two-Dimensional Networks
The following images show the NEC today and as we propose together with the German, Swiss, Dutch, and Shinkansen networks. The images are schematic and therefore line length is not to scale, but line width is to scale, denoting throughput in tph consistently across the six images, and speed is consistently denoted with the same colors.[11] The minimum depicted frequency is every two hours, or one tp2h; less frequent services are not shown.

The NEC today. Only selected stops shown.

The NEC as we propose, with increases in both frequency and speed. The stops shown are one pattern (scenario 2a below).

German intercity rail network. Only trains branded as ICE or another high-speed system such as TGV are shown; the biggest gap served only by trains with other, slower brands is Berlin-Dresden, which has ICEs but below the minimum frequency.

Swiss intercity rail network. All of the InterCity and foreign high-speed rail brand trains are included.

Dutch intercity rail network. All intercity trains are included.

Shinkansen network. All trains, including the Mini-Shinkansen, are shown. The frequency depicted is for midday trains, which is lower than at rush hour.
Capacity Concerns
Capacity is a serious concern, especially in the New York area, and particularly on the approaches to Penn Station. Much has been written about the topic of Penn Station itself,[12] but the discussion is among activists rather than academically published. For our purposes, the minimum spacing between two trains is held at two minutes. This is common among both intensely used commuter rail systems and busy medium-speed intercity trains, with one installation of ETCS in Switzerland capable of a train every 110 seconds.[13][14] The North River Tunnels run a peak of 24-25 tph from New Jersey into Penn Station, and planners at NJ Transit believe that the best the signal system can handle today is a train every two minutes.
To be clear, that the system can handle two-minute spacing between trains does not mean it can run 30 tph. Gaps in the schedule are required to recover delays. Planners at New Jersey Transit believe that 24 tph is the best possible under current conditions. The busiest commuter lines in Europe achieve between 16 and 32 tph, with figures higher than 24 usually requiring simple scheduling with limited branching. We do not assume higher capacity than 24 tph in each direction on a pair of tracks.
Where trains of different speeds run on the same tracks, the capacity is much lower. Timetabling is based on train paths, and trains of the wrong speed (either too slow or too fast) consume more paths.[15][16] This is a concern on long stretches of double track with both commuter and intercity trains, such as the Providence Line and the MARC Penn Line, and on quadruple track with three speed classes, such as the inner New Haven Line and the inner NJ Transit NEC Line.
We use the two-minute rule when timetabling faster and slower trains on the same tracks. At an overtake station, such as Attleboro, the slow train is held while the faster train runs through without stopping. Before the overtake, the fast train is two minutes behind the slow train; after the overtake, it is two minutes ahead. This means that if trains run every 15 minutes, then there is a maximum of 11 minutes of speed difference between overtakes, which constrains the infrastructure planning between Boston and Providence and between Baltimore and Washington, where slow commuter and fast intercity trains share double-track segments over long sections.
In practice, current signal limits outside the highest-throughput sections, such as the North River Tunnels, are much lower. The traditional Pennsylvania Railroad signal system installed south of New York assumes that every train brakes at the rate of the weakest-braking train, which means that a 200 km/h (125 mph) passenger train is assumed to brake at the rate of a freight train that cannot run faster than about 80 km/h (50 mph). Thus, where an actual 200 km/h train can brake fast enough for two minute spacing to be safe, the signal system requires many blocks ahead to be clear, and in practice the trains on running tracks have a minimum spacing of about one every eight minutes. The system is capable of recognizing each train’s braking profile and reducing the required clear distance, and just needs this capability to be turned on, at low cost. We assume that this is done.
Developing the Timetable
The tools created to perform the analysis as described in this report are open source and publicly available on GitHub.[17] This is not as optimized as possible: tools for hybrid optimization exist,[18] but in our situation of being able to modify infrastructure at places where further spending is required, we are content with developing one feasible schedule for each of the most relevant scenarios.
In developing train paths, we use a rigid Takt within each metropolitan region: New York (from Trenton to New Haven), Boston (down to Providence), and Washington (up to Perryville). In metro Philadelphia, there is practically no track sharing except around Wilmington, as there are four tracks and only two speed classes of train, intercity and commuter. In all cases, we take care to minimize the number of distinct stopping patterns, in order to simplify schedule planning and make sure the points of conflict are repeated and controllable. This is an important ingredient for the reduction in timetable padding to 7%.
For example, this diagram depicts southbound New York-Philadelphia trains:

The stringline diagram depicts southbound trains from New York to Philadelphia. The intercity trains are in blue. The express NJ Transit NEC trains are in orange, making limited stops to New Brunswick and then going to Trenton. The local NJ Transit NEC and NJ Coast trains are respectively in red and green. SEPTA only runs local trains, in purple. The route has four tracks from Newark south, and six tracks through Linden and Rahway. The diagram visualizes where faster trains need to overtake slower trains, and demonstrates that each overtake is at the same location.
In particular, the use of a rigid 10-minute Takt ensures that all meeting points are controllable. As the route from Newark to Philadelphia has at least four tracks the entire way, the intercity trains (in blue) can consistently take the express tracks and the local commuter trains (in green and red) can take the local ones. The only potential difficulties are with the express commuter trains (in orange). We see an intercity-express commuter overtake around Metropark and another around Princeton, an express-local commuter overtake around Elizabeth, and a long segment with three-way overtakes or near overtakes between Linden and Rahway. The Linden-Rahway segment has six tracks, allowing each of the three speed classes of train to get its own track pair. Based on the above diagram, the express commuter trains can be put on the express tracks on the four-track segment between Newark and Linden and on the local tracks on the four-track segment south of Rahway, avoiding the need to construct additional tracks.
Lines to be Timetabled
To further simplify scheduling, we only consider lines that interact with the intercity network on the Northeast Corridor. As a result, our timetables do not include every commuter line. We instead only include the following lines:
Boston
- Providence Line
- Stoughton Line (including future South Coast Rail)
New York
- New Haven Line, including branches
- Port Washington Branch
- NJ Transit Northeast Corridor Line
- North Jersey Coast Line
Philadelphia
- Trenton Line
- Wilmington Line
Washington
- MARC Penn Line
The Gateway Program projects that New York needs 48 tph from New Jersey into Penn Station, 24 in the preexisting North River Tunnels and 24 in the new tunnels built as part of the program. The North River Tunnels are projected to carry intercity, NEC Line, and North Jersey Coast Line traffic, while the new tunnels are projected to carry all other NJ Transit lines. With investments described in Infrastructure Investments, these two systems are separated out and we only consider the former.
We set the Takt at 10 minutes in the New York region, so that the North River Tunnels have four patterns every 10 minutes: one intercity, one express NEC Line, one local NEC Line, and one local North Jersey Coast Line. Intercity NEC trains share tracks with commuter trains between New York and Newark, and with express commuter trains between Rahway and New Brunswick.
On the New Haven Line, current peak traffic is 20 Metro-North tph including 16 on the main line and 4 on the branches, and Metro-North’s rush hour modal split is already very high.[19] We set total Metro-North New Haven Line traffic including trains to Penn Station at 24 tph, and also assume that intercity trains are available for high-speed commutes from Stamford and New Haven, charging commuter rail fares for unreserved seating tickets. Those 24 tph fall into four stopping patterns: two identical ones for express trains to Grand Central, one for local trains to Grand Central, and one for local trains to Penn Station (Penn Station Access). We assume one of the two express patterns consistently runs from New Haven to Grand Central and the other uses the branches, New Canaan or Danbury. Express trains to Penn Station are handled by intercity trains or by commuter trains with a change at Stamford or New Rochelle. Intercity trains share tracks with different commuter trains between New York and Stamford, partly with the Penn Station local trains (south of New Rochelle) and partly with the express commuter trains (north of New Rochelle).
The LIRR is already largely separated from the NEC system, thanks to investments made in Harold Interlocking. We do not explicitly timetable lines that do not interact with the NEC. The one line that remains part of the system in our schema is the Port Washington Branch, which is treated as if it is a branch of the NEC, itself separated from the rest of the LIRR as it does not go to Jamaica. This means that in the four-track East River Tunnels, one pair serves all trains that we timetable, including one pattern for the NEC, one for Penn Station Access, and two identical local patterns for the Port Washington Branch. Current peak traffic on the Port Washington Branch is 6 tph whereas two patterns make for 12, but we believe that other commuter rail modernization programs proposed elsewhere can boost demand on such an urban line, namely consistent frequency and fare integration with buses and subways.
Track sharing on the urban approach between intercity trains and very local commuter trains like those of the Port Washington Branch may appear strange, but it is in fact a solid way of assigning services to tracks. It is better than what we are forced to do elsewhere, timetabling NEC intercity trains together with longer-distance NEC commuter trains, such as the New Haven Line express trains. The reason is that high-speed intercity and local urban trains are the easiest to keep on schedule, due to their relatively small number of stops and high degree of separation from other trains. In contrast, regional trains have no such separation, leading to cascading delays.
Finally, in the Boston region, we set the Takt interval at 15 rather than 10 minutes, and we also do the same in the Washington region except in one scenario described below. The required capacity is smaller on both intercity and commuter trains, and there are long stretches of double track between Boston and Providence and between Baltimore and Washington amenable to running every 15 minutes with timed overtakes. In order to transition from a 10-minute Takt near New York to a 15-minute one near Boston and Washington, we slightly rearrange intercity trains using a local-only stop. In other words, we set up the schedule north of New York so that out of six tph, two tph don’t go to Boston, and among the four that do, two are slowed down by five minutes through the addition of a local stop so that between Boston and Providence, they are evenly spaced every 15 minutes.
Scenarios
All scenarios are described relative to a base stopping pattern for express intercity trains:
Boston South Station
Providence
New Haven
Stamford
New York Penn Station
Newark Penn Station
Philadelphia 30th Street Station
Wilmington
Baltimore Penn Station
Washington Union Station
In all cases, in the New York region, from New Haven to either Trenton or just north of it depending on which scenario is used, trains run every 10 minutes and all make the same stops. In no case are there overtakes between faster and slower intercity trains: intercity trains extensively overtake commuter trains, and some express commuter trains overtake local commuter trains, but the slower intercity trains are barely slower than the faster ones. Nor do we assume any brand differentiation as Amtrak practices between the Acela and Northeast Regional trains.
North of New Haven
North of New Haven, trains are divided into three patterns, each on a 30-minute Takt. One pattern does not serve the NEC at all north of New Haven. With future investments in electrification on the Hartford Line, the trains should run to Springfield. Alternatively, they can turn at New Haven, perhaps with a timed transfer to a shorter train to Springfield. The other two patterns stay on the NEC, one stopping at New London and one skipping it. The total stop penalty at New London including a one-minute dwell time is four minutes, so the dwell time should be increased to two minutes to make for a five-minute stop penalty. This way, the two patterns, departing New Haven separated by 10 minutes, are separated by 15 minutes by the time they reach Providence.
A separate question concerns Back Bay and Route 128 stations. Their total ridership figures in 2023 were, respectively, 750,000 and 408,000, compared with 1,539,000 for South Station.[20] We do not recommend stopping at either. Route 128’s ridership is lower than that of any station in the base stopping pattern except Stamford, where we project an increase in commuter traffic, and is located in a fast zone where its time cost is high, reaching three minutes. Back Bay is in a slower zone, costing less than two minutes, and has higher ridership, but is hard to retrofit with 16-car trains, and easy to reach from South Station on upgraded, more frequent commuter trains. A timetable with one or both stations restored would, besides the time cost, not look different from the point of view of scheduling from the primary timetable we recommend.
Stamford
Trains can stop at Stamford or skip it. For timetabling reasons, there should not be a mix of stopping and skipping trains. In the primary timetable we recommend, Stamford is included. However, it can be dropped, saving two minutes for through-passengers.
The reason we recommend keeping Stamford, even though it is by far the least ridden of the stations in the base express pattern today,[21] is commuter traffic. Today, Amtrak runs on a separate ticketing system from commuter rail, with generally higher fares and no cross-honoring of tickets. In Connecticut, speeds today are hardly different between Amtrak and Metro-North, and therefore commuters and even short-distance intercity riders take Metro-North. Speeding up intercity trains would change this equation. This equation would change further if the ticketing system changed. Based on Swiss or pre-2022 German practice, Amtrak could sell unreserved tickets on intercity NEC trains for the same price as a commuter train, differing from reserved tickets in that passengers are not guaranteed a seat.[22]
Trenton and points south of Philadelphia
South of New York, scenarios differ in how to handle service.
- All trains have the same base stopping pattern. This is easy to timetable but requires more infrastructure construction between Baltimore and Washington and is therefore not recommended.
- Trains divide into three stopping patterns based on what they do south of Philadelphia, each running every 30 minutes. One stopping pattern does not run on the NEC south of Philadelphia, and instead runs on the Keystone corridor to Harrisburg. The other two run express and local, with the one local stop’s dwell padded to make the pattern five minutes slower than the express, producing 15-minute intervals between Baltimore and Washington. Three options exist for what the local stop should be:
- Trenton. In this case, the trains going to the Keystone corridor might as well stop at Trenton too. The trains enter Philadelphia unevenly spaced, but this is fine, as the Trenton-Philadelphia section has no track sharing with non-intercity traffic at all, as the corridor has four tracks and SEPTA does not run express commuter trains. The express trains keep making the base stopping pattern.
- Wilmington. In this case, the local trains run the base pattern south of New York, and the express trains make one fewer stop. The stop is flanked by two sharp curves and thus skipping it saves less than two minutes. A high-investment option can include a bypass south of the city, increasing the time saving to three minutes.
- BWI Airport. This station actually has more riders today than Wilmington or Newark, let alone Trenton,[23][24] and therefore local trains should serve it if possible. Express trains can keep skipping it and making the base stopping pattern as the time cost is three minutes, in a fairly fast zone. Between Baltimore and BWI the route has four tracks and therefore the frequencies only need to be even from BWI south. The primary timetable assumes this scenario.
Appendix: Timetables
The timetables below depict rush hour service. Intercity trains run at the same frequency all day, but commuter trains may run at half the peak frequency off-peak and on weekends. All timetables are padded by 7%, except for high-speed trains between New Haven and Providence, which are padded by only 4% as the line is dedicated to them. Times are rounded to the nearest quarter-minute, and depict arrival times, except at originating stations, where they are departure times. We assume scenario 2c above is used, but the differences with scenarios 2a and 2b are minimal.
Only southbound trains are depicted. Northbound trains are symmetric about :00. For example, an express Boston-Washington train is shown as arriving at New York 8:20.75, every 30 minutes. This means that an express Washington-Boston train departs New York at :39.25 every 30 minutes. Similarly, a train from Springfield to Washington stopping at BWI arrives Newark 8:42 every 30 minutes. This means that a train from Washington to Springfield departs Newark at :18 every 30 minutes, which means it arrives Newark at :17.
Intercity trains
Each of the following three patterns is on a 30-minute Takt.
Boston 6:25
(Overtake at Readville 6:31.25)
(Continue overtake at Route 128 6:32.25)
(Pass Canton Junction 6:33.5)
(Overtake at Attleboro 6:40.75)
Providence 6:48.25
New Haven 7:29
Stamford 7:56.5
(Pass New Rochelle at 8:06.25)
(Pass Co-op City 8:09)
(Overtake at Parkchester 8:10.75)
New York 8:20.75 (arrive)
New York 8:23.75 (depart)
(Pass Secaucus 8:28.25)
Newark 8:32
(Pass Metropark at 8:40.75)
(Pass Trenton at 8:53.25)
Philadelphia 9:10.5
(Pass Chester 9:18.5)
(Pass south of Claymont where the tracks narrow from four to two at 9:22)
Wilmington 9:25.5
(Pass Newark, Delaware 9:32.5)
(Pass Perryville 9:40.5)
Baltimore 9:57.5
(Pass BWI 10:05.5)
(Pass the south end of the BWI Fourth Track 10:08.5)
Washington 10:19.75
(From Springfield)
New Haven 7:39
Stamford 8:06.5
New York 8:30.75 (arrive)
New York 8:33.75 (depart)
Newark 8:42
Philadelphia 9:20.5
Wilmington 9:35.5
Baltimore 10:07.5
BWI 10:16
Washington 10:34.75
Boston 6:40
Providence 7:03.25
New London 7:28.75
New Haven 7:49
Stamford 8:16.5
New York 8:40.75 (arrive)
New York 8:43.75 (depart)
Newark 8:52
Philadelphia 9:30.5
(To Keystone)
MBTA trains
Both of the following patterns are on a 15-minute Takt at rush hour, which may be replaced with a 30-minute Takt outside rush hour. As the two lines are offset by just 4.25 minutes on the shared trunk, if they run every 30 minutes off-peak then the trains should be scheduled with alternating 11.75- and 19.25-minute gaps.
Boston South Station 6:16.25
Back Bay 6:18
Ruggles 6:20.25
Forest Hills 6:23.5
Hyde Park 6:27.25
Readville 6:29.25 (arrive, partly hold for overtake)
Readville 6:30.25 (depart)
Route 128 6:33.25 (arrive, partly hold for overtake)
Route 128 6:34.25 (depart)
Canton Junction 6:37.25
Sharon 6:40.75
Mansfield 6:46.25
Attleboro 6:53.25 (arrive)
Attleboro 6:57.75 (depart, hold for overtake)
South Attleboro 7:02
Pawtucket 7:05.25
Providence 7:09.5
Boston South Station 6:12
Back Bay 6:13.75
Ruggles 6:16
Forest Hills 6:19
Hyde Park 6:23
Readville 6:25
Route 128 6:27.75
Canton Junction 6:31.5
(To Stoughton)
Metro-North trains to Grand Central
All of the following patterns run on a 10-minute Takt at rush hour. Off-peak, the local trains should presumably still run every 10 minutes to provide adequate frequency to the inner suburban stations, but the express trains should run half service. Two options are available: either both of the express patterns should run every 20 minutes, with alternating 7- and 13-minute gaps, or the express pattern that goes to New Haven should run every 10 minutes (perhaps cut to every 20 east of Stamford) and the other pattern should be reduced to shuttles from New Canaan and Danbury with forced transfers.
New Haven State Street 7:10
New Haven Union Station 7:11.25
West Haven 7:14.5
Milford 7:20.5
Stratford 7:24.5
Bridgeport 7:28.5
Fairfield Metro 7:32
Fairfield 7:34.75
Southport 7:37.25
Green’s Farms 7:39.75
Westport 7:43.25
East Norwalk 7:46
South Norwalk 7:48.25
Rowayton 7:50.75
Darien 7:53.25
Noroton Heights 7:55.5
Stamford 7:59.25
New Rochelle 8:12
Harlem-125th Street 8:22.25
Grand Central 8:28
(From New Canaan Branch, or else see above schedule)
Stamford 7:56.25
New Rochelle 8:09
Harlem-125th Street 8:19.25
Grand Central 8:25
The two above patterns do not have even headways. The choice of putting the New Haven express trains just after the branch express trains is intentional: passengers at Stamford or New Rochelle who are indifferent to which train they get on and just want to get to Grand Central will be more likely to ride the less crowded branch trains. Outbound, this is reversed and the New Haven express will be more crowded, but crowding levels are higher in the morning than afternoon peak.
Stamford 7:40.75
Old Greenwich 7:42.75
Riverside 7:44.75
Cos Cob 7:46.5
Greenwich 7:49
Port Chester 7:52
Rye 7:54.5
Harrison 7:57
Mamaroneck 7:59.75
Larchmont 8:02.25
New Rochelle 8:05
Pelham 8:07.25
Mt. Vernon East 8:09.5
Fordham 8:14.5
Harlem-125th Street 8:19.25
Grand Central 8:25.25
Penn Station Access-NJ Transit through-service
This pattern is on a 10-minute Takt. Its core from New Rochelle to Newark must run on the same Takt off-peak as well, but Stamford-New Rochelle and Newark-Trenton can be cut to every 20 minutes.
Stamford 7:25.75
Old Greenwich 7:27.75
Riverside 7:29.75
Cos Cob 7:31.5
Greenwich 7:34
Port Chester 7:37
Rye 7:39.5
Harrison 7:42
Mamaroneck 7:44.75
Larchmont 7:47.25
New Rochelle 7:50
Co-op City 7:54.75
Morris Park 7:56.5
Parkchester 7:58.75 (arrive)
Parkchester 8:03.5 (depart, hold for overtake)
Hunts Point 8:06.5
New York 8:15.75 (arrive)
New York 8:18.75 (depart)
Secaucus 8:24
Newark 8:28.5
(Pass North Elizabeth 8:32.5, on the fly overtake)
(Pass Elizabeth 8:33.25, on the fly overtake)
Metropark 8:39.75
New Brunswick 8:46.75
Jersey Avenue 8:49.25
Princeton Junction 9:00.25
Hamilton 9:05.75
Trenton 9:09
The reasoning for the awkward through-running of Metro-North locals with NJ Transit express service is about three issues. First, to run service on Penn Station Access more smoothly, it has no express commuter trains, only local trains; express service between Stamford and Penn Station is provided by intercity trains. Second, in New Jersey, it’s easier to provide even headways on the local trains by running them through to the same LIRR branch. And third, despite some reverse-peak Metro-North traffic to Stamford, Stamford’s overall importance as a regional job center is less than that of Newark or Flushing.[25]
Terminating trains need to depart Trenton quickly after :09, as the crossovers from the southbound to northbound local tracks cross the express tracks at-grade, and intercity trains pass at :03.25 southbound and :06.75 northbound every 10 minutes. In effect, the train needs to move past the southbound local track, and cross to the northbound local before :11.25. As Trenton has two local tracks in each direction, there is no interference with other trains, in particular with SEPTA trains depicted below.
NJT locals
Each of the following two patterns is on a 10-minute Takt at rush hour. Off-peak, service is cut in half to 20-minute intervals, with the second pattern moved five minutes to ensure 10-minute intervals on the shared trunk to Rahway.
(From Port Washington Branch)
New York 8:13.25 (arrive)
New York 8:16.25 (depart)
Secaucus 8:21.5
Newark 8:26
Newark Airport 8:29
North Elizabeth 8:31.75
Elizabeth 8:33.75
Linden 8:37.5
Rahway 8:40.25
Metropark 8:44.75
Metuchen 8:47.5
Edison 8:51
New Brunswick 8:54
Jersey Avenue 8:56.5
North Brunswick 9:00
The closeness of the above schedule at Jersey Avenue to that of the express commuter trains is why the express commuter trains are compelled to stop there, where skipping it as they do now would otherwise be more appropriate.
(From Port Washington Branch)
New York 8:18.25 (arrive)
New York 8:21.25 (depart)
Secaucus 8:26.5
Newark 8:31
Newark Airport 8:34
North Elizabeth 8:36.75
Elizabeth 8:38.75
Linden 8:42.5
Rahway 8:45.25
(To North Jersey Coast Line)
SEPTA
The Philadelphia-Trenton trains are timetabled on a 20-minute Takt all day; there is room in the schedule for a 10-minute Takt but such service levels are not currently planned or even advocated for. The Philadelphia-Wilmington-Newark trains are timetabled on a 30-minute Takt, with Philadelphia-Chester having an additional 30-minute Takt pattern turning at Chester to make for a 15-minute interval between Philadelphia and Chester.
Trenton 8:36
Levittown 8:41.25
Bristol 8:45
Croydon 8:48.25
Eddington 8:50.75
Cornwells Heights 8:53
Torresdale 8:45.75
Holmesburg 8:58
Tacony 9:01
North Philadelphia 9:07.25
Philadelphia 30th Street 9:12.25
Trenton has two local tracks in each direction, so there is no interference with NJ Transit trains. Terminating trains can cross the two express tracks at-grade in a window from :06.75 to :13.25 every 10 minutes.
Philadelphia 30th Street 8:31.75
Penn Medicine 8:33
Darby 8:37.25
Curtis Park 8:39
Sharon Hill 8:40.5
Folcroft 8:42
Glenolden 8:43.75
Norwood 8:45.5
Prospect Park 8:47
Ridley Park 8:48.75
Crum Lynne 8:50.75
Eddystone 8:52.75
Chester 8:54.75
Highland Avenue 8:57.75
Marcus Hook 9:00.25
Claymont 9:02.75
Wilmington 9:09.5
Churchman’s Crossing 9:16
Newark 9:21
Intercity trains pass Newark, DE southbound at :02.75 and :12.75 and northbound :17.75 and :27.75, both repeating every 30 minutes. A terminating commuter train needs to set itself up to cross a flat junction before :27.75, or between :27.75 and :32.75, or between :32.75 and :37.75, to make a :39 departure.
The extra Chester turnbacks terminate southbound at :09.75 and need to be back on the northbound tracks at :20.25, repeating every 30 minutes. The SEPTA trains to Wilmington do not interfere with this move, but intercity trains cross Chester southbound at :08.5 and northbound at :11.5 every 10 minutes, giving terminating SEPTA trains a 7-minute window within which to cross the express tracks.
MARC
Trains are timetabled on a 15-minute Takt between Baltimore and Washington, with a 30-minute Takt between Perryville and Baltimore.
Perryville 9:22.5
Aberdeen 9:28
Edgewood 9:36
Martin State Airport 9:43.5
Baltimore Penn Station 9:53.25
West Baltimore 9:56.75
Halethorpe 10:01.5
BWI 10:05
Odenton 10:15.25
Bowie 10:16.75
Seabrook 10:21.75
New Carrollton 10:24.75
Washington 10:33.75
Terminating trains at Perryville have to go off-corridor immediately, but the Susquehanna Bridge replacement includes two new tracks permitting that. In scenario 1, there would be an additional intercity train passing Perryville :30.5 and it would have to overtake before Baltimore, but in scenarios 2a and 2b it would pass Perryville :25.5 overtake north of Aberdeen on triple track and in scenario 2c the shifting service means there would be no such overtake, as long as MARC trains only run every 30 minutes north of Baltimore.
South of Baltimore, intercity trains overtake commuter trains between BWI and Odenton on the fly. No easy transfer is provided between commuter and intercity trains at BWI, but there is a short transfer southbound from trains from Perryville to the express intercity trains at Baltimore, and, by symmetry, a northbound transfer from the express intercities to the Perryville trains.

Takt Diagram. Click on image to view the complete diagram.
Appendix: String Line Diagrams
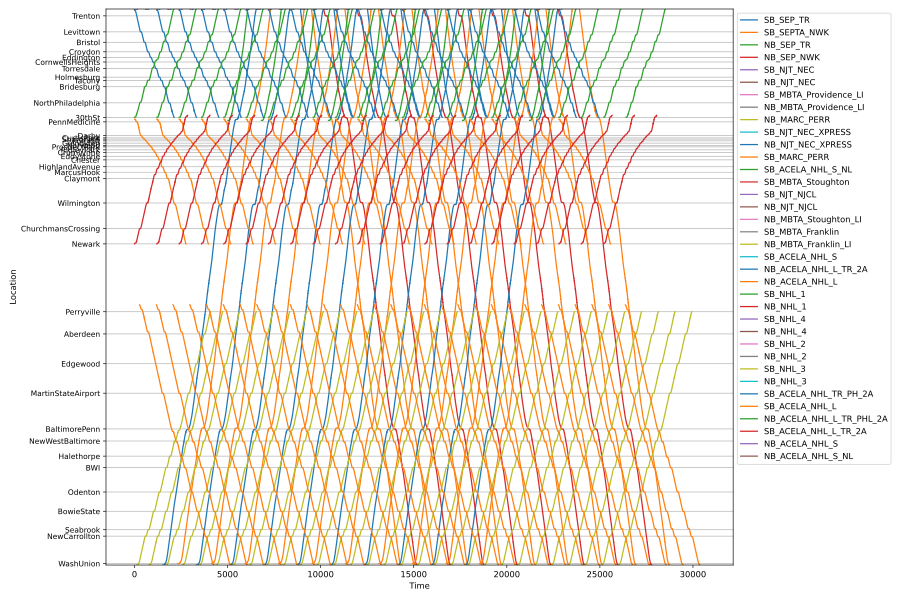
Scenario 2A Section 1

Scenario 2A Section 2

Scenario 2A Section 3

Scenario 2C Section 1

Scenario 2C Section 2

Scenario 2C Section 3
[1] Aviation Direct, “Unpunctuality of Deutsche Bahn: SBB rejects more and more trains,” July 2024, https://aviation.direct/en/unpuenktlichkeit-der-deutschen-bahn-sbb-lehnt-immer-mehr-zuege-ab.
[2] Tagesspiegel, “Unpünktlichkeit der Deutschen Bahn,” July 2024, https://www.tagesspiegel.de/
[3] Jan de Boer, “SBB to cut Deutsche Bahn services because they are delayed too often,” I Am Expat, October 2022, https://www.iamexpat.ch/expat-info/swiss-expat-news/sbb-cut-deutsche-bahn-services-because-they-are-delayed-too-often.
[4] “California High-Speed Train Project: Report on Operations and Maintenance Peer Review,” November 2010, https://web.archive.org/web/20150921152727/http://www.hsr.ca.gov/docs/about/business_plans/BPlan_2012LibraryCh6OpertMaint.pdf.
[5] California High-Speed Rail uses 5% on dedicated sections and 10% on shared sections. See California High-Speed Rail Authority, “2024 Business Plan Service: Service Planning Methodology,” Rev 1.0, January 2024, https://hsr.ca.gov/wp-content/uploads/2024/02/2024-BP-Service-Planning-Methodology-V06-Final-A11Y.pdf, p. 5.
[6] Holger Dambeck, “ICE versus TGV: Deutsche Bummel-Bahn,” Der Spiegel, April 2019, https://www.spiegel.de/reise/deutschland/ice-versus-tgv-warum-deutsche-schnellzuege-deutlich-langsamer-sind-a-1259209.html.
[7] Marco Innao, “Run Time Allowances in Rail Planning and Travel Time Estimation: International Perspectives and Practices,” July 2024.
[8] Piotr Łukasiewicz and Evert Andersson, “Green Train energy consumption: Estimations on high-speed rail operations,” part of KTH Railway Group Gröna Tåget, Stockholm, February 2009, https://www.kth.se/polopoly_fs/1.179876.1600689818!/Menu/general/column-content/attachment/GT%20Energy%20consumption%20slutl.pdf.
[9] Rob Goverde, “Railway timetable stability analysis using max-plus system theory,” Transportation Research Part B 41(2), February 2007, pp. 179-201, https://www.sciencedirect.com/science/article/pii/S0191261506000208.
[10] Patrick O’Hara, “Need for Speed: Improving LIRR and Metro-North train speeds,” The LIRR Today, February 2020, https://www.thelirrtoday.com/2020/02/improving-lirr-speeds.html.
[11] All images below were made by Kara Fischer.
[12] ETA, “Penn Station Can Handle the Load: New York is Ready for Through-Running,” January 2025, https://www.etany.org/penn-station-can-handle-the-load.
[13] The line does not run 32 tph, but rather runs trains in platoons of four spaced every 110 seconds, twice an hour, in order to allow all four trains in the platoon to make the timed connection at Bern. See Arnold Trümpi, “ETCS Level 2: success for the Swiss Federal Railways,” Global Railway Review, June 2007, https://www.globalrailwayreview.com/article/1459/etcs-level-2-success-for-the-swiss-federal-railways/.
[14] ERTMS Factsheet #6, “ERTMS deployment in Switzerland,” https://www.ertms.net/wp-content/uploads/2021/06/6-ERTMS-Deployment-in-Switzerland.pdf.
[15] Oskar Fröidh, Hans Sipilä, and Jennifer Warg, “Capacity for express trains on mixed traffic lines,” International Journal of Rail Transportation, 2(1), pp. 17-27, https://kth.diva-portal.org/smash/get/diva2:808254/FULLTEXT01.
[16] Steven Harrod, “Capacity factors of a mixed speed railway network,” Transportation Research Part E 45 (5), September 2009, pp. 830-841, https://www.sciencedirect.com/science/article/abs/pii/S1366554509000349.
[17] Devin Wilkins, GitHub project NEC-Rail-Sim, https://github.com/devincwilkins/nec-rail-sim.
[18] Hamed Pouryousef, Pasi Lautala, David Watkins, “Development of hybrid optimization of train schedules model for N-track rail corridors,” Transportation Research Part C 67, June 2016, pp. 169-192, https://www.sciencedirect.com/science/article/pii/S0968090X16000619.
[19] The modal split for all commutes from Westchester and Fairfield Counties to Manhattan is 84% transit, 15% car, 1% other. See MTA, “CBD Tolling Program Environmental Assessment Chapter 1: Introduction.” https://www.mta.info/document/92761 There is no breakdown by time of day, but across all entries to the Manhattan core, the modal split for transit is higher at rush hour than off-peak. See New York Metropolitan Transportation Council, Hub Bound Travel Data Report 2019, pub. 2021: https://www.nymtc.org/Portals/0/Pdf/Hub%20Bound/2019%20Hub%20Bound/DM_TDS_Hub_Bound_Travel_2019.pdf.
[20] Amtrak Fact Sheet Fiscal Year 2023: Commonwealth of Massachusetts, March 2024, https://www.amtrak.com/content/dam/projects/dotcom/english/public/documents/corporate/statefactsheets/MASSACHUSETTS23.pdf.
[21] Stamford had 324,000 annual passengers in 2023. See Amtrak Fact Sheet Fiscal Year 2023: State of Connecticut, March 2024, https://www.amtrak.com/content/dam/projects/dotcom/english/public/documents/corporate/statefactsheets/CONNECTICUT23.pdf. The next lowest in the base stopping pattern is Wilmington, with 625,000. See Amtrak Fact Sheet Fiscal Year 2023: State of Delaware, March 2024, https://www.amtrak.com/content/dam/projects/dotcom/english/public/documents/corporate/statefactsheets/DELAWARE23.pdf.
[22] German ticketing practice on intercity trains has not changed, and there are still reserved and unreserved tickets, with unreserved tickets not guaranteeing a seat. However, where regional tickets used to cost similarly to unreserved intercity tickets, they have since been deeply discounted, currently covered by the Deutschlandticket, which guarantees access to all urban and regional mass transit in Germany for 58€ a month, exempting only intercity trains.
[23] Amtrak Fact Sheet Fiscal Year 2023: State of Maryland, March 2024, https://www.amtrak.com/content/dam/projects/dotcom/english/public/documents/corporate/statefactsheets/MARYLAND23.pdf.
[24] Amtrak Fact Sheet Fiscal Year 2023: State of New Jersey, March 2024, https://www.amtrak.com/content/dam/projects/dotcom/english/public/documents/corporate/statefactsheets/NEWJERSEY23.pdf.
[25] Within 1 km (0.621 mi) of the train station, there are 45,277 jobs near Newark Penn Station, 44,086 near the Flushing-Main Street LIRR station, and 23,156 near Stamford Station. All data is as of 2022 from OnTheMap, https://onthemap.ces.census.gov/.
Infrastructure Investments
High-speed rail on the NEC requires about $9.5 billion in infrastructure costs in the low-investment scenario that we consider, in addition to $3 billion for commuter rail improvements outlined in the commuter rail section above, and acquisition of rolling stock. The majority of this cost comprises bypasses to speed up the trains and go around particularly slow areas, but a significant minority are capacity upgrades to permit more service with higher reliability; in addition, the catenary south of New York needs to be replaced. A high-investment scenario requires about $5 billion in additional bypass infrastructure. The major projects are presented in the following table:
| Project | Cost | Notes | Included in low-inv.? |
|---|---|---|---|
| NY-DC constant tension catenary | $1,000m | More modern standards permit lower costs than in current plans | Yes |
| Kingston-New Haven bypass | $5,000m | Yes | |
| New Haven-Stamford bypasses | $3,900m | Excluding Milford | No |
| New Canaan interlocking (CP 235) | $300m | Yes | |
| Cos Cob Bridge replacement | $100m | Steep grades permit lower costs | Yes |
| Greenwich-Port Chester bypass | $1,000m | No | |
| New Rochelle interlocking (CP 216) | $500m | Yes | |
| NJ Transit capacity investments | $1,700m | Hunter, Mid-Line Loop, Portal | Yes |
| Frankford Junction modification | $300m | Yes | |
| BWI Fourth Track | $600m | Cost can likely be lowered | Yes |
In the rest of this analysis, we describe the catenary replacement project south of New York, followed by a description of the required physical construction section by section, from north to south. This is summarized in the following table:
| Section | Main issues | Proposed projects |
|---|---|---|
| Boston-Providence | Heavy track sharing with MBTA commuter rail | Commuter rail upgrades, Readville-Route 128 triple track |
| Providence-New Haven | Sharp curves in Connecticut | Bypass Kingston-New Haven |
| New Haven-New York | Heavy track sharing with Metro-North, poor standards | Coordinated timetabling to reduce schedule padding, higher speeds on curves, junction and bridge fixes, optional bypasses |
| New York Penn Station | Very high train throughput on limited approach tracks | Coordinated timetabling and service simplification; no physical expansion or reconstruction of Penn Station |
| New York-Trenton | Capacity on the Gateway approach, flat junctions | Junction fixes, mid-level Portal South Bridge |
| Trenton-PA/DE line | Sharp curves in otherwise fast territory, flat junctions | Frankford Junction reconstruction |
| Delaware | Track sharing with SEPTA | Timetable improvements |
| DE/MD line-Baltimore | Curves in fast territory, track sharing with MARC | Minor curve adjustments, timetable improvements; no new bridges |
| Baltimore-Washington | Track sharing with MARC | Timetable improvements, BWI fourth track |
Finally, we discuss lengthening the platforms. The technical standards document explicitly assumes 16-car trains, which most of the NEC stations cannot accommodate. This is not costed, but we expect the costs to be much lower than the main bypasses, junction upgrades, and catenary upgrade.
Catenary
The catenary system south of New York severely limits both speed and reliability and needs to be replaced. This has to do with the tensioning of the wire. In brief, there are two ways to tension catenary wire: one is called variable tension in the United States and fixed termination in Europe, and the other, more advanced, is constant tension in the United States and auto-tensioned in Europe. There’s practically no constant-tension catenary in the United States, but the Northeast Corridor north of New York is an exception, as well as a small section upgraded near Princeton Junction. South of New York, other than that small section, the tension is variable, which both limits speed, currently to 135 mph (217 km/h)[1], and sags in the summer heat, leading to delays.
Variable-tension wire simply connects the wire to the poles at regular intervals. The following figure illustrates the view from the track side, with the bottom line representing the contact wire:[2]
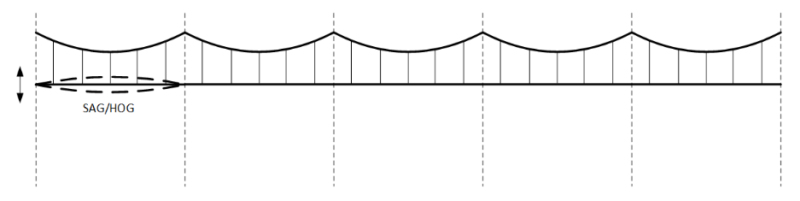
The length of the wire has to be based on a temperature average: in the summer heat, the wire will expand and sag, whereas in the winter cold, it will contract and rise to a hog. The tension in the wire thus varies by time of day and year, limiting speed; the 135 mph speed limit on the Northeast Corridor south of New York is the highest we are aware of globally on variable-tension catenary, and engineers at the Spanish national rail infrastructure company, ADIF, have expressed surprise that it can even be so high, as has UK electrification engineer Garry Keenor.[3] This speed cannot be sustained reliably, and summer delays due to catenary sag are routine, even in the United Kingdom,[4] where the annual temperature range is narrower than in the Eastern United States.
The alternative is to add auto-tensioning devices to the poles, countermanding heat expansion through a counterweight or a spring system:[5]

Replacing the variable-tension catenary with constant-tension catenary has long been among Amtrak’s priorities for the Northeast Corridor. Little has been built, owing to poor standards, which drive costs up.
The current spacing between poles on the Northeast Corridor south of New York is variable, usually between 260 and 290 feet, or 78 to 88 meters, on straight sections; on curved sections, the pole spacing is narrower. In conversations with multiple European vendors, we have been told that reusing the existing poles at distances up to 80 meters is routine. The usual distance between support poles for 300-350 km/h lines is 50-70 meters (164-300’), but 80-90 meter distances are viable. The Siemens Sicat SX system even permits 102 meters (335’) or even 112 meters (367’) between spans at speeds up to 250 km/h (155 mph).[6][7]
Moreover, the existing poles can be reused: representatives for one vendor told us that the forces exerted on the pole are actually smaller with constant-tension catenary than with variable-tension catenary, and therefore a pole built to withstand the forces of the former can be retrofit for the latter with little difficulty. Other vendors, less sanguine about the poles, suggested bracing them in place. It was not suggested that the poles must be replaced, let alone moved.
Amtrak’s standards are considerably tighter. The New Haven-Boston electrification standard on straight track is about 70 meter (230’) spacing. Since then, standards have tightened to a maximum spacing of 180 feet, or 55 meters.[8] This forces any catenary reconstruction to rebuild the trackside area, with extensive right-of-way work and conflict with other trackside infrastructure such as signal boxes.
These uniquely American standards played a role in the Caltrain electrification project, which, at $844 million in 2024 prices[9] reached $10.55 million/km ($17 million/mi), by far the most expensive overhead catenary electrification project in the world. As explained in the commuter rail section, a more typical cost for a double-track European line is $3-4 million/km ($5-6.5 million/mi),[10][11] and a study conducted for the FRA projected $2 million/km ($3.2 million/mi) on a long stretch of the Southern Transcon.[12] By contrast, Caltrain not only used excessively tight standards but also poorly integrated its electrification project with a resignaling project under CBOSS. Moreover, it specified pole placement in the request for qualifications, which is an unusually inflexible approach that led to trackside conflicts between pole support, signals, and other infrastructure. Without a full construction cost case, we can’t say for certain which problem contributed which cost, but, the rolling stock order suffered the same problems of micromanagement by the client and overreliance on consultants[13] that we have observed as a cost driver for urban subways in our infrastructure construction costs cases.[14]
The expected costs of constant-tension catenary should not be based on Amtrak budgets, but on more common standards. The corridor has four tracks, so the wire costs are twice those of the two-track comparison cases. Conversely, only the wire needs to be rebuilt. On the Green Line Extension in Boston, cost estimates from 2005 had the wire costing $4.464 million and substations $6 million, for slow but frequent trains.[15]
We expect, based on European costs, that constant-tension catenary reelectrification of the corridor south of New York, capable of supporting 320 km/h running on the stretches of the NEC where long runs at high speed are feasible based on track geometry, should cost the same as complete double-track installations, totaling $1 billion.
Boston-Providence
Providence Line
The Providence Line requires no investments in speed, and only minor ones in capacity. Most of it was built as part of the Boston and Providence Railroad in 1835, to rather high standards: the curves were built to a 1° standard (radius 1,746 meters), and the Canton River was crossed by the Canton Viaduct, which, though single-track at the time, was wide enough to accommodate two tracks when the line was doubled in 1860. As such, today, this is one of the fastest sections of the Northeast Corridor.
We do not call for any deviations from the right-of-way. Such deviations could be built in an even higher-investment case than our high-investment case: the succession of 1° curves between Mansfield and Canton occurs in areas where little route modification would be required for an easement, as there is limited development next to the tracks and the change in azimuth for each individual curve is small.
Within Rhode Island, the situation changes. The route is in a cutoff built in 1847 to connect the Boston and Providence route with the Providence and Worcester and with the New York, Providence, and Boston, to allow for a connection without using ferries. Curve standards by then were lower as it became clear that trains could take sharper curves without derailing and since the area had more industrial development in Pawtucket and Central Falls already. Nonetheless, we cannot recommend any curve modification there, because the sharpest curves would require much more extensive takings to ease, including a new bridge over the Blackstone River.
The difficulty on this section is with timetabling intercity and commuter trains together, as increased frequency of higher speed trains creates more need for passing opportunities on the two-track line. Right now, commuter trains include the Providence Line and its Stoughton Line branch; in the first 15 km (9 mi) out of Boston, the Franklin Line uses the route as well. In our timetables, intercity trains connect Boston and Providence in 23 minutes nonstop, or 28 minutes with stops at Back Bay and Route 128. Commuter trains do so in 47 minutes, down from 1:10 today due to electrification, level boarding, the procurement of high-acceleration EMUs, and reduced timetable padding.
If trains run every 15 minutes, then this requires timed overtakes. Attleboro is already a four-track station, and timed overtakes are already scheduled there today. The plan keeps this overtake. However, it is not in the middle of the route but rather well to the south of the middle, and thus there is a long segment without an overtake. If intercity and commuter trains are timed to just overtake at Attleboro, then another overtake will be required around or just north of Route 128, regardless of whether intercity trains stop there.
The Connect 2035 project list includes extending the three-track section in Boston south to Route 128, to a point just north of the Canton Viaduct.[16] With this triple-track section, the overtake could be done there, albeit with some restrictions on how trains are scheduled. The only other triple-track section on which overtakes are unavoidable is in Milford; see below for how intercity trains can run, avoiding conflict on both triple-track sections while also overtaking commuter trains. If this is too constraining, then Readville-Route 128 could be quadruple-tracked instead, but it is not strictly necessary.
The main investments in this section, by cost, are in commuter rail upgrades. The route is already ready for high-speed intercity rail, but the quality of infrastructure for commuter rail is lower. The Providence Line is already electrified, but small sections of it, used only by commuter trains, still require electrification, and the platforms are not compatible with fast boarding and alighting. All of the following projects must be completed, to speed up the commuter trains:
- Wiring the remaining gap on the Providence Line, namely Pawtucket Yard.
- Raising the platforms at all stations that only have low platforms, currently including all stations between South Attleboro and Hyde Park inclusive, except for Route 128.
- Electrifying the 6 km (4 mi) long Stoughton Line.
Fairmount and Franklin Lines
The Franklin Line is a branch off of the NEC, diverging at Readville. The Fairmount Line does not currently share any infrastructure with the NEC, but questions remain about both lines.
Originally they were built as a single line, the New York and New England Railroad, competing with the Boston and Providence Railroad, which they crossed at Readville. However, they were reorganized as part of a combined system in the 1890s as the New Haven bought out both lines. Between Readville and South Station, the current route of the Providence Line, locally called the Southwest Corridor, is faster, and also serves Back Bay, so branches prefer to use it, including the Franklin Line. The Fairmount Line was nearly abandoned, then temporarily used as the sole route as the Southwest Corridor was rebuilt to allow Orange Line subway service, and then reused as a local commuter rail line. In the 2010s, the MBTA opened a series of infill stations, so that now the Fairmount Line has eight stops in 15 km (9 mi), where the Providence Line has five, of which trains signed as part of the Providence Line only make three (only Needham trains stop at Forest Hills, and only Franklin Line trains stop at Readville).
Franklin Line trains can continue to use the current Southwest Corridor route, or instead be rerouted through the Fairmount Line. TransitMatters has a longer treatment of the tradeoffs involved.[17] On the one hand, the Southwest Corridor is faster and serves Back Bay. On the other hand, if the Providence, Stoughton, and Franklin Lines share the Southwest Corridor then they would have to have uneven intervals, since even intervals would imply a local commuter train every five minutes between Readville and South Station at rush hour, on a triple rather than quadruple track. Even without the Franklin Line, the Providence and Stoughton Lines’ schedules are not even. There are also benefits for the Fairmount Line if it runs together with Franklin, in that it could support higher peak frequency.
In either case, we recommend giving the Franklin and Fairmount Lines the same upgrades, to allow for flexible routing. This means high platforms on the Franklin Line and on the only remaining low-platform stations on Fairmount, Fairmount and Readville (the newer stations, built under ADA regulations, have high platforms), and overhead wire electrification. As the commuter rail section explains, the MBTA is currently planning battery-electric trains on the Fairmount Line;[18] this is in error, trading off too high a cost premium for the rolling stock for too little a cost saving on wire.[19]
Providence-New Haven
Between Providence and New Haven, there is little commuter traffic. Traffic is largely intercity; the only commuter traffic is two low-usage lines, Shore Line East and the extension of the Providence Line to Wickford Junction.
Here, we propose a bypass along I-95 to parallel the Shore Line.

This is a tradeoff between takings and civil infrastructure costs: an alignment that takes less property is feasible, but would have to cross I-95 frequently on viaducts. The route we sketch runs north of I-95 and leans toward less civil infrastructure, albeit imperfectly, and further optimization work could do this better. At typical tunnel-free Western European costs, the entire 125 km (78 mi) bypass should cost $5 billion,[20] including the river crossings.
The importance of the bypass is a combination of speed, reliability, and frequency. The unpadded nonstop intercity rail trip time is 1:07 between Providence and New Haven on the existing tracks, with upgrades for higher cant and cant deficiency and no bridge speed limits, but no deviations from the right-of-way. On the bypass, it is reduced to 38 minutes. In practice, the difference between the two trip times is larger, because of schedule padding: without the bypass, the extent of timetable padding needs to be increased, to prevent delays from cascading between commuter and intercity trains, whereas with it, a smaller pad can be used. With 4% pad on the bypass or 7% without it, the difference grows to 40 minutes versus 72. This is both the most expensive single piece of infrastructure in the proposal, and the one with the largest trip time benefit.
Moreover, the bypass, or a part thereof, is necessary to increase throughput. Boat traffic has priority over rail traffic, and an agreement between Amtrak and the Coast Guard on how often the movable bridges can be closed limits frequency to a train every half hour. To alleviate this bottleneck, the FRA has awarded $900 million in Bipartisan Infrastructure Law (BIL) money to rebuild the bridge over the Connecticut in place, enabling higher frequency but not speeding up rail traffic at all.
It is unfortunate that the bypass we propose also bypasses the new Connecticut River bridge. An alignment that reuses it should be considered, but if it requires too many takings in Old Saybrook and Old Lyme, then the alignment we proposed is viable as well, despite the added costs.
Past plans for the Northeast Corridor included portions of the bypass, specialized to bypassing the movable bridges. The Northeast Corridor Future plan included a bypass from Old Saybrook east; New Haven-Old Saybrook was left unupgraded, as the Shore Line is less curvy there than between Old Saybrook and Westerly, and the priority was the bridges. Here we propose a longer bypass, going as far as New Haven Union Station.
From north to south, the first deviation from the right-of-way is a curve easement at the boundary between South Kingstown and Exeter. This curve is between two straight sections where the Acela achieves its maximum speed today; it’s also in one of the least developed regions of the East Coast, the easement taking one farmhouse and no wetlands. This is about 1.5 km (0.9 mi) of new at-grade route, saving 49 seconds. If there is one place where a deviation from the right-of-way is warranted, it is here: 1.5 km of at-grade high-speed rail is unlikely to cost more than $50 million, and $1 million/second is far cheaper than the rest of the bypass.
The remainder of the bypass leaves south of Kingston and rejoins only at New Haven Union Station. This includes a new bridge over the Quinnipiac to cut off 4.5 km (2.8 mi) and about 140 seconds from the trip. The bridge would closely parallel the Pearl Harbor Memorial Bridge (Q Bridge), which cost $554 million for a 10-lane span carrying I-95, built between 2006 and 2015. The rail bridge would only need to be 10 meters (33’) wide, compared with 63 meters for the Q Bridge.
In New London, the bypass is closely parallel to I-95 as well, including the decks of the Gold Star Memorial Bridge over the Thames. Here, a local stop for intercity trains is desirable, with a stop penalty of 4 minutes, which should be padded to 5 minutes, to let trains transition from 10-minute headways south of New Haven to 15-minute headways on the Providence Line.
Over this section, we do not consider the commuter trains in the simulation. The two commuter lines that do exist are Shore Line East, which uses the legacy track and would not interact with the bypass except possibly at Union Station, and the very low-traffic extension of the Providence Line to Wickford Junction. The Wickford Junction extension currently runs through to Boston, but it is likely better to separate the two, and reduce the extension to shorter trains running more frequently; in either case, trains should wait at sidings such as that of T. F. Green Airport to avoid delaying the higher-traffic intercity trains.
One possibility for including commuter trains is to extend both the Wickford Junction extension and Shore Line East to meet each other. Currently, Shore Line East runs limited traffic, especially past Old Saybrook due to the aforementioned bridge limitations, but a half-hour regional service could extend this line and take over the Amtrak Northeast Regional trains to New London, Mystic, Westerly, and Kingston. The Wickford Junction extension could then go south to Kingston to meet it. Kingston would need to be rebuilt as a four-track station with bypass tracks to allow for this service.
New Haven-New Rochelle
The New Haven Line is both the slowest and most capacity-constrained section of the NEC today. Uniquely, this section is owned by Metro-North rather than by Amtrak. In the high-investment scenario, this section is slated to receive the largest amount of spending in bypass and junction infrastructure, and even in the low-investment scenario, some of this spending is unavoidable.
That said, in the low-investment scenario, we focus on better scheduling first, and the unavoidable projects are those required for better reliability. The issue is that Metro-North maintains it to lower standards and sets extremely conservative curve speeds for both commuter and intercity trains. The existing route is largely built to a 2° curve standard (radius 873 meters), compatible with a maximum speed of 157 km/h (98 mph). We find that simply timetabling the trains better and adopting better standards, as described in the technical standards section, would cut trip times on commuter trains from 2:08 to 1:16 and on intercity trains from 1:40 to 0:52. Indeed, a recent change to the Metro-North timetable to include a super-express train with less padding but still with today’s curve speed limits produced 1:28 trip times.[21][22]
Junction reconstruction
The New Haven Line’s junctions with its branches at both ends are all flat. Trains cross opposing traffic at grade, forcing awkward timetable dependence between southbound and northbound trains’ schedules. The most standard solution to flat junctions is to spend money on flying junctions to provide rail-on-rail grade separations. This costs money, and is the most important on the busiest lines. On less busy lines, it is usually possible to timetable around the flat junction, possibly by slowing down the trains on the less busy branch or providing pocket tracks for trains on the less busy branch to wait.
We propose to keep the flat junctions at Devon Junction (CP 261) to the Waterbury Branch and at Walk Junction (CP 244) to the Danbury Branch. Those branches have low ridership today, and the majority of Danbury Branch and all Waterbury Branch trains only run within Connecticut, forcing New York-bound passengers to transfer at Stamford or Bridgeport. As detailed in the commuter rail improvement section, we recommend that both be electrified, and the state is investing in high platforms on the Waterbury Branch, which may lead to enough of a ridership increase to justify higher frequency. However, they would still be unlikely to justify more than a train every half hour each.
At New Canaan Junction (CP 235), we propose a flying junction. We cost it at $300 million, based on similarity to Hunter Flyover described below in New Jersey. The New Canaan Branch’s trains usually run only between Stamford and the outer terminus, just like the Danbury Branch’s; however, for the trains that do run through, they need to cross much heavier traffic at Stamford, interacting with terminating local commuter trains between Stamford and New York and not just express commuter trains. A solution avoiding this $300 million expense may be viable, but we include a flying junction in the main proposal.
Finally, the New Rochelle grade separation is nonnegotiable, due to the high expected traffic volume at the CP 216/Shell Interlocking. New Rochelle only has four tracks, and no room for pocket tracks. In our proposed schedule, peak traffic into Grand Central is 18 trains per hour and peak traffic into Penn Station is 12, including the six intercity trains. The grade separation can also be bundled with a minor fix to the curvature south of the station, an S-curve with a speed constraint. We cost this at $500 million; a project to grade-separate this junction is in planning, but to get the cost, we benchmark it to be somewhat more expensive than Hunter.
New Haven Line realignments
A list of bypasses is included as further reductions in trip times, totaling 7 minutes on intercity trains, but we only recommend them in a high-investment scenario. Even with those bypasses, the average speed would only be 160 km/h (99 mph), characteristic of mixed high-speed and legacy lines like Berlin-Munich, whereas complete high-speed lines average more than 200 km/h (125 mph). This is because there is almost continuous suburban development between New Haven and New York, making it infeasible to bypass the entire route as we propose east of New Haven. The modifications target the slower sections, with a total of seven major deviations from the right-of-way (bypasses and curve easements) in the highest-investment scenario, and an eighth deviation that has been studied but rejected.
| Location | Type | Length | Cost (in million) | Takings | Time saved | Included? |
|---|---|---|---|---|---|---|
| Milford | Bypass | 8.1 km (5 mi) | $1,000 | 53 | 00:22:00 | No |
| Bridgeport | Bypass tunnel | 4.8 km (3 mi) | $1,200 | 10 | 2:54; an additional easement in Stratford makes it 3:11 | Only high-investment |
| Black Rock | Easement | 1.5 km (0.9 mi) | $200 | 4 | Only high-investment | |
| Fairfield | Bypass | 3.9 km (2.4 mi) | $500 | 36 | Only high-investment | |
| Darien, Norwalk | Bypass | 15.6 km (9.7 mi) | $2,000 | 300+ | 2:14; if express trains skip Stamford then this is 2:25 | Only high-investment |
| Cos Cob Bridge | Easement | 1.2 km (0.7 mi) | $200 | 11 | Yes | |
| Greenwich, Port Chester | Bypass | 7 km (4.3 mi) | $900 | 70 | 01:03:00 | Only high-investment |
The route modifications between Stamford and New Haven collectively save 5.5 minutes, and should be considered in groups, as the Fairfield and Bridgeport curves are close enough to one another that the bypasses and easements interact positively. We do not include them in the main low-investment proposal, because of their elevated cost, and little impact on the schedule: east of Stamford, the route has four tracks, which can be effectively separated with intercity trains on the fast central tracks and commuter tracks on the slow outside tracks.
West of Stamford, two possible right-of-way deviations would shorten the trip time by slightly more than a minute, comprising the Cos Cob Bridge and the Greenwich bypass.
The Cos Cob Bridge easement would, if bundled with the currently planned replacement of the bridge, move the bridge slightly upriver to replace two short, sharp curves on the approaches with one much wider curve—see below on bridge replacements.
The Greenwich bypass would save intercity trains time while letting them overtake express commuter trains, effectively providing six tracks’ worth of capacity on this busy section. In the low-investment scenario the Greenwich bypass is not included, but we have modeled the timetable under both options. If the bypass is included, then the express commuter trains need to be slightly slowed down with an additional stop on the bypassed section, presumably Greenwich.
Bridge replacements
There are four movable bridges on the New Haven Line, all of which have plans for replacement or rehabilitation. From north to south, these are the Devon Bridge on the Housatonic, the Saga Bridge on the Saugatuck, the Walk Bridge on the Norwalk, and the Cos Cob Bridge on the Mianus.
In all cases, current proposals for replacement are inexplicably expensive relative to examples we have found in Germany,[23] France,[24] and Spain.[25] The Walk Bridge is already fully funded for replacement for a total cost of $1 billion,[26] over a length of 200 meters (660’) between support pillars. Due to this cost, the Devon Bridge is instead undergoing rehabilitation rather than full replacement, aiming to extend its life by another 10 to 15 years while the state seeks funding for the $3 billion replacement; the Saga Bridge is likewise only budgeted for rehabilitation as the estimated cost is $580 million.[27] At the costs of the European comparanda, each of these bridges would cost much less than $100 million.
The Devon and Saga Bridges are on straight track segments. In the high-investment case, the Saga Bridge is close enough to the Norwalk bypass that the same project could include a replacement, but only if the cost can be reduced to levels typical of bridges on new high-speed lines, and the Devon Bridge could in theory be included with a Stratford easement on the same basis. In the low-investment case, no replacement should be scheduled, and instead, the speed limitations on the bridges should be lifted through more proactive, regular maintenance.
The Cos Cob Bridge is itself straight but is flanked on both sides by sharp curves. If it is replaced, then it is better to bundle the replacement with a realignment to replace the two short, sharp curves with one much wider curve. The replaced bridge would need to clear 14.9 meters (49’) below, like the Mianus River Bridge upriver carrying I-95,[28][29] while also staying under I-95 just west of the preexisting Cos Cob station, 450 meters (1,500’) to the west. The elevation of the top of rail at the Cos Cob station is 8 meters above sea level, whereas a modern high-speed rail bridge has 1.6 meters of thickness between the bottom of the deck and the top of rail,[30] requiring about 8.5 meters (28’) of rise.
The technical standards used on the Northeast Corridor today call for a maximum grade of 1%, but commuter and intercity EMUs can climb 4% routinely, and long freight trains are only concerned with the grade averaged over the length of the train, which is much more than 450 meters. The vertical curve radius would be sharp in this case, and to fully clear I-95 to the west while also avoiding having to make modifications to the Riverside station to the east would require a combination of exceptional curve radius values (the averaged exceptional value California High-Speed Rail uses is 0.43 m/s2, with SNCF exceptionally allowing 0.6[31]), limiting speed somewhat, allowing slightly lower vertical clearance on the bridge, or stealing a few centimeters of clearance from the underpass under I-95; if the speed is limited to 200 km/h then no stealing is required.
With the high bridge design for the moved Cos Cob Bridge and the realignment, construction would be done at some distance from the existing bridge, avoiding disturbing it during works. Takings would be limited to a few of the townhouses immediately north of the bridge on its west side, and possibly one house on the east side. Physical construction costs could then be compared with about a kilometer (0.6 mi) of bridge and approaches; a notional cost of $100 million is included for this project.
New York Penn Station
Currently, Metro-North only serves Grand Central. The Penn Station Access project to allow Metro-North to also serve Penn Station along the Northeast Corridor is nearing completion, with an official projected opening date of 2027 and potential delays up to 2029. The project comprises four infill stations in the Bronx, yard expansion at New Rochelle, and an expansion of most of the originally double-track line to four tracks to allow faster intercity trains to share the corridor with slower commuter trains.
The infrastructure investments are already being done. No further investments are proposed in this section, except for grade-separating CP 216 as discussed in the section on New Haven-New Rochelle above. Hunts Point is planned to be triple-track, and from south of it to Penn Station the line will remain double-track; however, with no additional stations on this stretch, the speed difference between commuter and intercity trains is so small that no further expansion of capacity is needed.

Penn Station Reconstruction and Expansion
There are proposals for a $7.5 billion project to rebuild Penn Station within its current footprint, called Penn Reconstruction,[32] to have better passenger circulation and more egress points, and for a $16.7 billion one to expand the station’s footprint one block to the south to add more platforms, called Penn Expansion.[33] The New York advocacy group ETA has recently explained why neither is necessary for high-throughput commuter and intercity rail operations, though some vertical egress improvements would be helpful.[34] Penn Expansion, in particular, serves no purpose, as trains through the under-construction Gateway tunnel can terminate on existing tracks, with still enough space within the station’s footprint for through-trains via the older tunnels, which would be used by both intercity and Northeast Corridor commuter trains.
In the past, we proposed a wholesale in-place reconstruction of Penn Station[35] to widen the platforms and permit more streamlined operations. This is not costed. This reconstruction would simplify operations and permit faster approaches, but our assumptions on speed and capacity use the station as-is, with its complex interlockings, 21 tracks, and narrow platforms; only the turnouts are modified, within their existing footprints. Even in the high-investment scenario, we do not consider this reconstruction.
The platform assignments we use are as follows:
- Platforms 1-3: NJ Transit trains through the Gateway tunnel, Empire Service trains (not timetabled, as there is little interaction with the Northeast Corridor)
- Platform 4: eastbound commuter through-trains, running local in New Jersey and on the Port Washington Branch
- Platform 5: eastbound commuter through-trains, running express in New Jersey and on Penn Station Access
- Platform 6: intercity trains in both directions
- Platform 7: westbound commuter through-trains, running on Penn Station Access and express in New Jersey
- Platform 8: westbound commuter through-trains, running on the Port Washington Branch and local in New Jersey
- Platforms 9-11: LIRR trains through the northern East River Tunnels under 33rd Street (not timetabled, as there is no interaction with the Northeast Corridor)
The frequencies are a train every 5 minutes on platforms 4 and 8 each, every 10 on platforms 5 and 7 each, and every 10 in each direction on platform 6. The express NJ Transit trains are expected to be the most crowded at rush hour and have the least number of through-passengers (the local trains run through to Flushing, a significant secondary job center), and therefore they are designed to use the least-trafficked platforms, to reduce peak crowding.
The dwell time at Penn Station with this setup is deemed to be 3 minutes on all through-trains, with enough padding for 5 minutes, commuter or intercity. ETA has conducted simulations suggesting that in rush hour conditions, such dwell times are viable with the above setup; passenger crowding at the station’s notoriously cramped platforms and staircases is expected to be high but less than the maximum capacity of passageways. A small minority of the proposed bundle of projects within Penn Reconstruction, namely the addition of escalators to the platforms that have the least, is useful, but the overall package largely isn’t, and neither is Penn Expansion.
New Jersey
Within New Jersey, the ongoing investment program by NJ Transit already provides the necessary projects to allow for reliable high-speed rail service. The route within the state is fairly straight, and most of the curves are wide or have already-planned largely within-right-of-way fixes. The most urgent projects concern peak capacity and the ability of trains to run without reverse-direction conflicts. NJ Transit is already applying for federal funds for those, and they should be funded on account of the high capacity benefits and moderate costs.
On running track, two curvy sections are notable: the S-curve just south of Elizabeth Station, and the wavy section in Metuchen. The Elizabeth S-curve is no longer affordable to straighten: too much new development has been built in the last 15 years on the inside of the southern half of the curve, and property acquisition alone would run into the nine figures. The maximum feasible speed on the curve is 140 km/h (87 mph), and lifting this restriction would save 40 seconds. Therefore, we do not recommend a change to the situation in Elizabeth; were it 2009, we would, but the costs have increased too much since.
In Metuchen, there is a series of curves limiting trains to 180 km/h (rounded from 110 mph), with one limiting them to 158 km/h (98 mph). Bypass curves are possible, speeding up the line to 200 km/h with some residential takings, saving only eight seconds. Due to the limited benefits, we do not recommend these bypasses.
What we do recommend is capacity expansion. All of the following three projects need to be funded:[36]
- Portal Bridge: the current swing bridge is being replaced by Portal North, a two-track high bridge for the use of Amtrak, but NJ Transit is on its own for its own high bridge. The options include a high bridge for the same cost as Portal North, $2.26 billion in 2022 prices, or an $800 million, three-track, mid-level bridge, still movable but otherwise modern. The only conflicting boat traffic is sludge barges, which can be scheduled overnight when trains do not run anyway; already today the swing bridge does not open at rush hour.
- Hunter Flyover: Hunter Interlocking between the Raritan Valley Line and the Northeast Corridor is flat, constraining the ability of trains to run through opposite-direction conflicts. NJ Transit’s investment plan includes a grade separation, budgeted at $300 million, for which it applied for BIL funds.
- Mid-Line Loop: the four-track Northeast Corridor has the slow tracks on the outside and fast tracks on the inside, and local trains turn closer to New York than express trains, forcing them to change direction across incoming traffic; the Mid-Line Loop is a $500 million project to construct a loop south of New Brunswick with related station projects to permit local NJ Transit trains to change direction on a different grade, without disturbing express and intercity trains.
The total cost of these three projects is $1.6 billion in 2022 prices, which is $1.7 billion in 2024 prices.
Trenton to Pennsylvania/Delaware border
Between Trenton and Claymont, just south of the Pennsylvania/Delaware border, there is ample capacity, and only one serious infrastructure bottleneck at Frankford Junction. The route has four tracks, and SEPTA does not run regular express trains, making it easy to separate the tracks into fast inside tracks for intercity trains and slow outside ones for SEPTA. The curves are fairly gentle as well. Frankford Junction stands as a sharp S-curve in otherwise medium-speed territory; fixing it would also fix the only serious at-grade conflict between commuter and intercity trains, which currently cross over at Zoo Junction near 30th Street Station.
Frankford Junction today has a sharp S-curve, with the western portion of the curve having a 437 meter radius (4°, or 1,434’), limiting trains even under our performance assumptions to 110 km/h (68 mph). Two potential curve modifications are proposed, both requiring commercial and industrial but no residential takings, a smaller one raising the maximum speed to 160 km/h and a larger one with more industrial takings raising it to 177 km/h (110 mph). The low-investment scenario assumes the smaller easement and the high-investment one assumes the larger one, but the decision should be based on more detailed study of local property acquisition costs; the difference between the two alternatives is 9 seconds, whereas that between the low-investment alternative and status quo is 17 seconds.
Simultaneously, a flying junction somewhere north of 30th Street Station is necessary to rearrange tracks correctly. Whereas the track arrangement both north and south of the station has the fast tracks on the inside and the slow tracks on the outside, the station approaches themselves have at-grade conflicts on both sides. The intercity trains enter the lower level of 30th Street, oriented north-south, and the regional trains enter the upper level, oriented east-west with trains from both Trenton and Wilmington entering from the west to run through to Center City and the Reading side of SEPTA.
North of 30th Street, there is an extensive complex of flying junctions connecting the station to the running track, at Zoo Junction; the junction itself is on a sharp curve, limiting trains to 100 km/h. However, despite the flying junction, there are still at-grade conflicts. A flying junction eliminating them can be at any point north. Frankford Junction is a favorable location, not just because it can be bundled with curve easement, but also because it is just north of the North Philadelphia station complex, where the Chestnut Hill West Line joins from the north with a flat junction; if the flying junction is at Frankford, then the Chestnut Hill West flat junction can remain, only conflicting with Trenton Line regional trains.
South of 30th Street, there is a long section of parallel running between SEPTA and intercity trains, and at any point, a single-track flying junction for inbound regional trains can be built.
Delaware
In Delaware, south of Claymont, the route rapidly drops from four tracks to two. However, as there are no intermediate stops between Claymont and Wilmington, the speed difference between commuter and intercity trains is low enough that timetabling them together is feasible, even with intercity trains running every 10 minutes.
Two infrastructure questions remain: Wilmington, and some of the curves to its west. In both cases, we do not include the higher investments in the plan.
In the case of Wilmington, the question is whether all trains should stop there, or some trains should bypass it. If the route remains as it is today, then there is little reason for trains to skip it; the station is between two sharp curves, of radii 672 and 460 meters (2,205’, 1,509’ respectively), and the eastern 672 meter curve extends to the platforms and therefore can’t be canted except perhaps at its eastern extremity. Skipping the station would save trains only 104 seconds.
An alternative route is possible, following I-495 and the freight bypass of the city along the Shellpot Secondary alignment. Running at a speed of 240 km/h (149 mph), trains would save about 200 seconds relative to stopping trains. The bypass would be 13 km (8 mi) long, starting from where the Northeast Corridor merges from four to two tracks, and require elevated construction over I-95 with flyovers, and environmental engineering for line upgrades through the Russell Peterson Wildlife Refuge. Due to cost uncertainty, we do not cost it or assume it is built in the plan.
Maryland north of Baltimore
The route in Maryland is fairly straight, but has some short curves between straighter segments. We propose some curve easements that are largely within right-of-way or barely outside it, and in many cases convert multiple curve sections with different radii into one wider curve of consistent radius. There are four places where deviations from the route are required, none very large.

- North East: here, there is a curve of radius 1,175 meters (1.49°) within an otherwise straight section, with little development on the inside of the curve. We propose a modification to produce a curve of radius 1,940 meters (0.9°) in open terrain, in line with an existing curve of similar radius shortly to the west. The time saving is only 14 seconds, but this is included due to low projected cost, even if minor takings are required.
- Charlestown: here, the curve radius is 1,455 meters (1.2°), and we propose an easement to 2,330 meters (0.75°) through streamlining the curve within right-of-way. This saves 13 seconds.
- Perryville: there is a tight (1,247 m radius, or 1.4°) curve crossing Principio Creek, with no engineering difficulties required to ease it to allow any speed. We propose a modification to radius 3,500 meters (0.5°), allowing trains to reach about 290 km/h (180 mph) before they have to slow down for the next curve east or west, saving 19 seconds.
- Havre de Grace: here, the right-of-way is consistent with a curve of radius 1,940 meters, but the curve radius is variable, so we propose streamlining within right-of-way. We do not advise further straightening due to difficulties including substantial takings required for a limited time saving.
In northeastern Maryland, intercity and commuter trains share two tracks, with some sections of triple track. The funded Susquehanna Bridge replacement separates faster and slower trains across the river, but the line expands to three tracks to Baltimore. MARC runs local trains under diesel traction, but it used to run under electricity and can buy EMUs. There are only three intermediate station stops between Perryville and Baltimore, at Aberdeen, Edgewood, and Martin State Airport, and if MARC runs EMUs, no further infrastructure for overtakes is needed. Amtrak Northeast Regional trains today serve Aberdeen, but traffic there is low for Amtrak, and we do not recommend keeping this stop for any intercity trains subsequently.
At Baltimore, MARC trains would have to be held for an overtake by intercity trains. This would essentially cut MARC in two, as commuters to Washington would prefer to switch to intercity trains if combined tickets are sold, speeding up commutes from northeastern Maryland to Washington considerably.
Baltimore and Baltimore-Washington
Between Baltimore and Washington, the NEC has a mix of double, triple, and quadruple track, and blending intercity and commuter trains is a serious concern. Moreover, the tunnel west of Baltimore, the Baltimore and Potomac (B&P) Tunnel, has compromised engineering and has been scheduled for replacement or bypassing since the 2000s.[37] The B&P replacement, the Frederick Douglass Tunnel, is already funded and in design. One more major capacity project is required, the BWI fourth track, which has received final approvals but is still looking for funds. The cost of this project is nearly $600 million, for reasons that are unclear.
The history of the B&P tunnel is one of compromises from the start. The difficult topography of Baltimore at the time made tunneling difficult. The tunnel did not open until 1873, as the first route through the city, later than the First Transcontinental Railway. It was built to low standards, with tight curves; it also has water leakage, leading to high maintenance costs.
The replacement project has since gone through multiple revisions. The 2011 report recommended a two-track tunnel for the exclusive use of passenger trains, at a cost of $773 million in 2010 prices, or $1.067 billion in 2023 prices. Subsequently, the scope grew to four tracks with mechanical ventilation and a large enough tunnel radius for double-stacked freight; then the extra scope was removed, returning the project to its original size. Throughout these revisions, costs rose, and when the tunnel was finally funded as part of the BIL, the cost was stated to be $6 billion,[38] with the bill contributing $4.7 billion of it.[39] As the tunnel is already funded, our simulations incorporate it with its geometry, and do not cost it.
In fact, the somewhat better performance of the example trains we use slightly increase the benefits of the tunnel. This is because faster-accelerating trains lose more time to slowdowns near a station, as without those slowdowns, they’d be able to get out of the station faster.
South of Baltimore, the route has moderate curves, largely built with a radius of 1,746 meters. Only two curves are tighter, both 1,091 meters (1.6°), permitting 176 km/h (109 mph). We do not consider any right-of-way deviations.
However, the timetabling of intercity and commuter trains together is delicate. Intercity trains share the route with MARC commuter trains. In the present, MARC commuter trains run under diesel power, but the route is electrified and MARC used to use electric locomotives. The timetable assumes new EMUs for MARC. In that case, where intercity trains do the Baltimore-Washington trip nonstop in 21 minutes, commuter trains do it in 39. Even then, an overtake is unavoidable.
The current line has four tracks between Baltimore and north of BWI. Of the 18 minutes of trip time difference between commuter and intercity trains, 14.5 are from BWI to the south. Therefore, the overtake must be farther south of BWI. For this, the Maryland Transit Administration has studied the BWI Fourth Track Project, to extend the four-track section south by 15 km (9 mi), to just north of Odenton and rebuild the BWI station with four platform tracks. The project has been approved and is in early design but is still unfunded, and projected to cost $583 million.[40][41][42]
It is unclear why the cost is so high. Other projects adding a track to the NEC have not been so expensive, nor is the reconstruction of a single station, even with long platforms and four tracks, usually this costly.
We include this project despite its costs. However, it is possible to timetable trains around it if it is not built. This would require a particular sequence of timed meets avoiding the triple-track segment to be constructed between Readville and Route 128 and the existing triple-track segment through Milford. If two intercity trains running between Springfield and Washington cross each other between Milford and New Haven, then two trains making this stopping pattern would also cross at BWI, where they’d use the local tracks and make a station stop, and be able to pass MARC at Odenton in scenario 2c of the scheduling section. In scenario 2a or 2b, they would skip BWI and cross 2.5 minutes to its north, on a four-track section just north of Halethorpe, and 5 minutes to its south, through Midland Park, well clear of any Odenton overtake.
Even with the BWI Fourth Track, it is difficult to timetable intercity trains between Baltimore and Washington every 10 minutes (scenario 1 in scheduling). This is a primary argument for scheduling trains per one of the scenario 2 options, with a train every 15 minutes between Baltimore and Washington or between BWI and Washington, depending on whether the more local intercity trains stop at BWI or elsewhere.
Station Platform Lengths
In the technical standards section, we assume Amtrak should procure 16-car, 400-meter (0.25 mi) long trains. This is based on a rudimentary model of ridership on the NEC if the speed upgrades we propose are undertaken and if fares are set at a reasonable rate, comparable to the TGV or ICE system.
To effect such train lengths, most stations would require projects to lengthen their platforms. The most difficult to work on, New York, can already berth 16-car trains at platforms 5, 6, and 7, and requires no further modification. Newark was historically built with 18-car platforms, though the southern ends of those platforms are disused and would require light rehabilitation work. The remaining stations that we propose high-speed rail service at do require modifications, to varying degrees.
We cost within-right-of-way platform expansions at the same rate that we cost new high-platform upgrades. If it is possible to upgrade a two-platform station with eight-car platforms from low to high platforms for $30 million, then it should be equally possible to extend platforms from eight to 16 cars, let alone from 12 to 16. Nearly all of the stations in question have a surplus of tracks, allowing phased construction with long-term shutdown windows for the platforms and limited impact on service.
Boston South Station
We propose the same division of South Station into four pieces as TransitMatters.[43] This would separate the station into, from west to east, the Worcester Line, the NEC, the Fairmount Line, and the Old Colony Line, simplifying operations. The NEC would use tracks 4-7. The platform between tracks 6 and 7 is 11 cars long, but to its south is a gap in the tracks as the interlocking leads tracks 6 and 7 in different directions, and thus it can be lengthened to 16 cars within its footprint. The platform between tracks 4 and 5 is harder to lengthen, but this is still doable if the track that tracks 5 and 6 merge into south of the station is moved in conjunction with a project to lengthen the other platform. The platform between tracks 8 and 9 is yet harder, and if it is not lengthened, then it is likely obligatory to route the Franklin Line onto the Fairmount Line and give this combined system tracks 8-10.

Image Source: Google Earth

Image Source: https://www.openrailwaymap.org/
At Back Bay, there is an overbuild and the overall station is more constrained. This is the primary reason we do not recommend it for any intercity rail service.
Providence
Providence Station has 12-car platforms. Its northern end is in the open air, on a curve. Curved platforms are to be avoided in all rail construction standards we have consulted, but waivers in special circumstances are granted, and the NEC is constrained enough that this is a special circumstance. The tracks taper north of the station on the curve, and the northernmost edge of the platform would be about 4.5 meters (15’) wide, comparable to the narrowest platform at Penn Station.
New Haven
New Haven Union Station has four platforms, three 10- and one 9-car long. The current track assignments at the station give Amtrak the western platforms (tracks 1-2 and 3-4) and Metro-North the eastern ones (tracks 8-10 and 12-14). Those would need to change in any case, to reduce the extent to which trains are scheduled to cross oncoming traffic.
All four platforms can be extended in both directions. However, shortly north of the station, the bypass along I-95 begins. In effect, this is the most significant station reconstruction, while at the same time, the costliest element, the viaduct taking trains from the station east across the Quinnipiac parallel to the Q Bridge, is already costed.
Stamford
Stamford has 12-car platforms, hemmed in by rapid tapers at both ends. We measure the width of the westernmost ends of the platforms to be about half the narrowest width at Penn Station, which we consider for the Providence platform extension above.
Here, due to the station’s low ridership, one solution is selective door opening. Selective door opening is common in New York and on Amtrak as well as in the UK, at less busy stations, at the cost of a potentially longer dwell time. As this is one of the least busy Amtrak stations on the NEC, the only reason to stop at Stamford is commuter volumes, and unreserved cars for commuters can be consistently chosen to be the 12 berthing cars, making selective door opening less confusing for the passengers.
A more expensive option is to rebuild the station from five to four platform tracks, bundled with the New Canaan flyover. However, this would raise the cost of the flyover by forcing it to interact with the dense urban layout of Downtown Stamford rather than be built farther east. Moreover, as all five tracks are in regular use, and traffic is high, taking tracks out of service for a prolonged period of construction is likely unviable, further raising costs.
Trenton
The situation at Trenton is rather like at Stamford: 12-car platforms, with limited ability to expand them. Like Stamford, it is a commuter-oriented station, with some of the lowest intercity rail volumes on the NEC. Selective door opening would work well there, on the same basis as Stamford. Concentrating commuters on the same cars at both commuter stations is unlikely to lead to overcrowding, since the commuter peaks are in opposite directions, both toward New York.
Philadelphia 30th Street Station
30th Street Station has five 14-car platforms on its lower level, dedicated to the use of Amtrak and the low-usage NJ Transit Atlantic City Line. They are under an overbuild, but there is room to expand both north and south, and practically no taper within a 16-car platform’s footprint. The surplus of tracks guarantees unlimited work windows as the platforms are extended one at a time, at a low cost for the required amount of platform construction.
Wilmington
Wilmington is a three-track, three-platform station. The outer tracks, 1 and 3, have side platforms, and there is an additional island platform between tracks 2 and 3; all three are about 13 cars long. The side platform at track 3 can be extended east within the footprint of the right-of-way, including the viaduct over Lombard Street. The island platform can be extended in both directions with some compromises on the taper, down to about 3.7 meters (12’) of platform width. The side platform at track 1 is hemmed by a building on the east and could be extended to the west with some additional work over North King Street. If only tracks 2 and 3 are used, then the work is more routine than if intercity trains can be timetabled on track 1 as well.

Image Source: https://www.openrailwaymap.org/

Image Source: Google Earth
Baltimore Penn Station
Baltimore has 10- to 13-car platforms, with ample space to the west and often to the east as well. Platform expansion should not require major reconstruction, and there are enough tracks that some tracks can even be taken out of service for construction.

Image Source: https://www.openrailwaymap.org/

Image Source: Google Earth
BWI
The platforms at BWI are 13 cars long. The BWI Fourth Track project includes a rebuild with 12-car long platforms at all four tracks, and would need to be modified to accommodate 16-car platforms on the express tracks. However, such a modification should not be too difficult, as the corridor is in a relatively undeveloped area, with little infrastructure in the way of longer platforms.
Washington Union Station
A project to expand the station is already planned.[44] Within the current footprint, there are tracks long enough for 16-car trains, but they have low platforms and are far from one another, which would complicate terminal operations. A lower-cost solution would be to raise the platforms at track 16, which accommodates long trains already; track 16 is used by the Capitol Limited, which uses equipment incompatible with high platforms, but an alternative, shorter platform could be found for the train, which has not recently run such long consists.
The tracks near 16 could potentially be lengthened. Track 15 faces the same platform, and the platforms between tracks 13-14 and 17-18, while not long enough, could potentially be lengthened north just enough to accommodate the required train length. In the most constrained case, only two tracks are needed, provided there is paramount discipline in train turnaround times, which can be found at Tokyo Station on the Shinkansen but not in Europe.[45]
[1] The speed limit under variable tension catenary is generally 135 mph on the NEC. The NJ High Speed Rail Improvement Program was supposed to replace the catenary between New Brunswick-Trenton with constant tension catenary, good for at least 160 mph (257 km/h) with the new Avelia Liberties. However, only about half of the project was completed, with the remaining half replaced with upgraded variable-tension catenary, good for 145 mph (233 km/h).
[2] Garry Keenor, Overhead Line Electrification for Railways 6th Edition, 2021, https://ocs4rail.com/.
[3] “Thanks for the citation! However, this statement can’t be right: “Another problem of variable-tension catenary is that it limits trains to 135 mph in its most common configuration”. More like 60mph!” July 2024, https://x.com/25kV/status/1810430942835556572.
[4] Railway Technology, “Tension and strain on overheated trains,” October 2011, https://www.railway-technology.com/features/featuretension-and-strain-on-overheated-trains/.
[5] Keenor, Overhead Line Electrification for Railways.
[6] Siemens brochure, “Sicat SX Overhead contact line system for main-line railways,” 2018, https://assets.new.siemens.com/siemens/assets/api/uuid:4fa06ed9-cbbb-40ab-acb1-93928c2f915a/elektryfikacja-sicat-sx-en-.pdf.
[7] David Shirres, “Siemens inclined OLE,” Rail Engineer, June 2024, https://www.railengineer.co.uk/siemens-inclined-ole/.
[8] Al Fazio, “HSR in the Northeast: What next?”, Railway Age, November 2015, https://www.railwayage.com/cs/hsr-in-the-northeast-what-next/.
[9] Imputed from $697 million in year of expenditure dollars for a 2017-24 project, with 2020 midpoint.
[10] Luc Nguyen and Arnaud Zimmermann, “Expertise des coûts de la seconde phase de l’électrification de la ligne Paris-Troyes,” IGEDD, July 2024, https://www.vie-publique.fr/files/rapport/pdf/296504.pdf.
[11] Railway Gazette, “Esbjerg electrification approved in four-point Danish transport plan,” February 2012, https://www.railwaygazette.com/infrastructure/esbjerg-electrification-approved-in-four-point-danish-transport-plan/36654.article.
[12] C. Tyler Dick et al, “Modeling the Economics of Modern Options for Mainline Freight Railway Electrification,” W.W. Hay Seminar (November 2024), https://railtec.illinois.edu/wp/wp-content/uploads/2024_11_08-Hay-Seminar_Tyler-Dick_compressed.pdf.
[13] Martin Ritter, “High quality railway vehicles: North American Market,” Stadler, October 2017, https://slideplayer.com/slide/13671652/.
[14] Transit Costs Project, Executive Summary, February 2023, https://transitcosts.com/cases/.
[15] Transit Costs Project, “The Boston Case: The Story of the Green Line Extension,” May 2021, https://transitcosts.com/cases/.
[16] Connect NEC 2035, Chapter 4: New England, July 2021, https://nec-commission.com/app/uploads/2021/07/C35-Plan-07-Ch-4-New-England.pdf.
[17] TransitMatters, “Modernizing the Franklin Line,” June 2024, https://static1.squarespace.com/static/533b9a24e4b01d79d0ae4376/t/667c679d31227225dbfca832/1719429025218/TransitMatters-Modernizing-Franklin-Line.pdf.
[18] MBTA press release, “MBTA Board Approves Keolis Plan to Introduce Battery Electric Trains on Fairmount Commuter Rail Line,” July 2024, https://www.mbta.com/news/2024-07-25/mbta-board-approves-keolis-plan-introduce-battery-electric-trains-fairmount.
[19] VDE, “Alternativen zu Dieseltriebzügen im SPNV,” 2019, https://web.archive.org/web/20240223194345/https://www.vde.com/resource/blob/1885872/5f42b90859412b8590d0c7539604b0bc/studie-alternativen-zu-dieseltriebzuegen-im-schienenpersonennahverkehr-data.pdf
[20] This comes from netting out a factor-of-5 premium for tunneled construction from the recent Italian, German, French, and Austrian projects in our high-speed rail database. Transit Costs Project, “High-Speed Rail Costs,” 2024, https://transitcosts.com/high-speed-rail/.
[21] New York press release, “Governor Hochul Proposes Major Investment in Hudson Valley Rail Service as Part of 2025 State of the State,” January 2025, https://www.governor.ny.gov/news/governor-hochul-proposes-major-investment-hudson-valley-rail-service-part-2025-state-state.
[22] Michelle Kaske, “Metro-North Is Faster Than Acela on NYC-New Haven Route After Signal Updates,” CityLab, April 2025, https://www.bloomberg.com/news/articles/2025-04-01/metro-north-cuts-travel-time-beats-acela-on-nyc-new-haven-route
[23] On the Berlin-Munich high-speed line, an 800 m (0.5 mi) bridge cost 15.5 million € in 2006-11, or about $32 million in today’s prices. See Pro-Bahn, “VDE 8.1: Trasse im Raum Coburg,” January 2015, https://www.pro-bahn.de/coburg/frosch.htm.
[24] The LGV Méditerranée crosses the Rhone four times. We have found the cost for one crossing, 680 meters long (0.42 mi), $50 million in today’s prices. See Guillaume Delacroix et al, “Roquemaure Appuis à peau,” Le Moniteur, December 1998, https://www.lemoniteur.fr/article/roquemaure-appuis-a-peau.1627239.
[25] A 6.1 km (3.8 mi) segment including a 384 m (0.24 mi) main span cost $100 million in 2012-16, or about $130 million in today’s prices. See Peter Reina, “ENR Global Best Projects 2017 Best Bridge/Tunnel – Almonte Viaduct,” Engineering News Record, October 2017, https://www.enr.com/articles/43026-best-bridgetunnel—almonte-viaduct.
[26] John Moritz, “A $1 billion bridge. The $300 million pier. Why are project construction costs in CT so high?,” Connecticut Insider, November 2023, https://www.ctinsider.com/connecticut/article/ct-billion-dollar-bridges-infrastructure-amtrak-18456623.php.
[27] Federal Railroad Administration, “FY22-23 Federal-State Partnership (NEC) Grant Program Selections,” November 2023, https://web.archive.org/web/20240105154454/https://railroads.dot.gov/sites/fra.dot.gov/files/2023-11/NECSelection%20Fact%20Sheets_Revised%2011-27-23_PDFa.pdf.
[28] NTSB, “Highway Accident Report – Collapse of a Suspended Span of Interstate Route 95 Highway Bridge over the Mianus River, Greenwich, Connecticut, June 28, 1983,” July 1984, https://www.ntsb.gov/investigations/AccidentReports/Reports/HAR8403.pdf.
[29] Datasheet, Interstate-95 over Mianus River & Local Rds., hosted on The Tennessean, https://data.tennessean.com/bridge/connecticut/fairfield/interstate-95-over-mianus-river-local-rds/09-06015/.
[30] Andreas Keil, Philipp Wenger, and Arndt Goldack, “Design of semi-integral and integral high-speed railway bridges – Experiences with the Gruben Viaduct and Gaensebach Viaduct,” IABSE Symposium Report, January 2012, https://www.researchgate.net/figure/Typical-cross-section-at-span-pier_fig2_262905842.
[31] California High-Speed Train Project Technical Memorandum 2.1.2: Alignment Design Standards for High-Speed Train Operation, March 2009, https://www.hsr.ca.gov/wp-content/uploads/docs/programs/eir_memos/Proj_Guidelines_TM2_1_2R00.pdf
[32] Stefanos Chen and Patrick McGeehan, “A New Pitch to Fix Penn Station: Move Madison Square Garden,” New York Times, March 2025, https://www.nytimes.com/2025/03/11/nyregion/penn-station-madison-square-garden.html.
[33] Nolan Hicks, “Amtrak Wants to Sell Us a Very Expensive New Station,” August 2024, https://www.curbed.com/article/amtrak-penn-station-expansion-through-running-gateway-tunnel.html.
[34] ETA, “Penn Station Can Handle the Load: New York is Ready for Through-Running,” January 2025, https://www.etany.org/penn-station-can-handle-the-load.
[35] Emily Compton, Cidney Hamilton, and Alon Levy, Fantasy Penn Station, September 2023, https://cidney.itch.io/fantasy-penn-station.
[36] New Jersey Transit, 2022 Capital Plan Appendix B: Project Sheets, https://content.njtransit.com/sites/default/files/njtplans/NJ%20TRANSIT%20Capital%20Plan%202022%20Update_Appendix%20B%20Project%20Sheets_7-24-23.pdf.
[37] Federal Railroad Administration, “Baltimore’s Railroad Network: Analysis and Recommendations,” January 2011, https://railroads.dot.gov/sites/fra.dot.gov/files/fra_net/2869/BaltimoreRailroadNetworkReport.pdf.
[38] Amtrak, “Frederick Douglass Tunnel Program,” 2004, https://www.amtrak.com/fdtunnel.
[39] Amtrak press release, “Amtrak Awarded Federal Funds for 12 Projects of National Significance Totaling Nearly $10B Across America’s Busiest Rail Corridor,” November 2023, https://media.amtrak.com/2023/11/amtrak-awarded-federal-funds-for-12-projects-of-national-significance-totaling-nearly-10b-across-americas-busiest-rail-corridor/.
[40] Federal Railroad Administration press release, “FRA Gives Green Light to Rebuild BWI Rail Station, Increase Service and Reliability,” 2016, https://railroads.dot.gov/elibrary/fra-gives-green-light-rebuild-bwi-rail-station-increase-service-and-reliability.
[41] Federal Railroad Administration, “Baltimore/Washington International (BWI) Rail Station Improvements,” October 2024, https://railroads.dot.gov/sites/fra.dot.gov/files/2024-10/BWI%20Rail%20Station%20Improvements.pdf.
[42] Federal Railroad Administration, “NEC Project Inventory,” April 2024, https://railroads.dot.gov/sites/fra.dot.gov/files/2024-04/2024%20NEC%20Project%20Inventory.pdf.
[43] TransitMatters, “Regional Rail Proof of Concept,” Fall 2019, https://static1.squarespace.com/static/533b9a24e4b01d79d0ae4376/t/5d79bba143abe87e302375ae/1568258980819/TransitMatters+Regional+Rail+Proof+of+Concept+V1.pdf.
[44] AECOM and LTK, “Washington Union Station Terminal Infrastructure Future Build Simulation Technical Memo,” December 2018, in Draft Environmental Impact Statement for Washington Union Station Expansion Project Appendix B – Washington Union Station Terminal Infrastructure EIS Report, p. 17, https://railroads.dot.gov/sites/fra.dot.gov/files/2020-06/Appendix%20B_Terminal%20Infrastructure%20Report_WUSDEIS_pdfa.pdf.
[45] Tim Romero, “What you can learn from Japan’s seven-minute miracle,” Disrupting Japan, June 2022, https://www.disruptingjapan.com/what-you-can-learn-from-japans-seven-minute-miracle/.