
0. Subway Map
1. Landuse – Alignment overlay
Landuse data downloaded from Replica and the highest percentage of landuse per census tract is utilized for coloring. The percentage is indicated as “landuse_percentage”
2. Population
Total population per census tract, overlaid with the alignment
Population Change within the 0.5 mile buffer from 2010 to 2020 is 44,121 increase.
Census tracts of 2010. Population: 600,700.
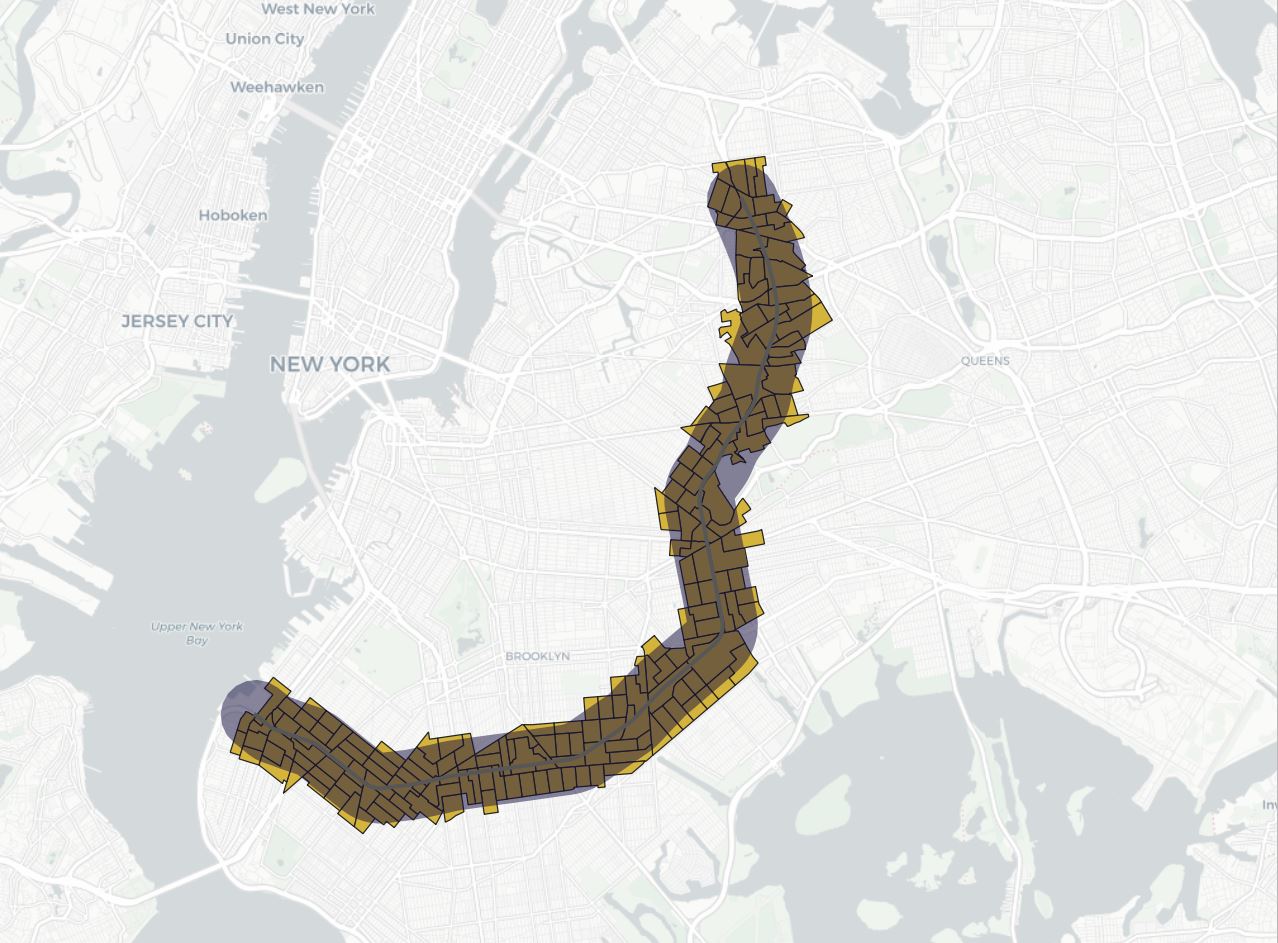
Census tracts of 2020. Population: 642,821.
3. Population density
“2010 Persons per Acre” data, overlaid with the alignment
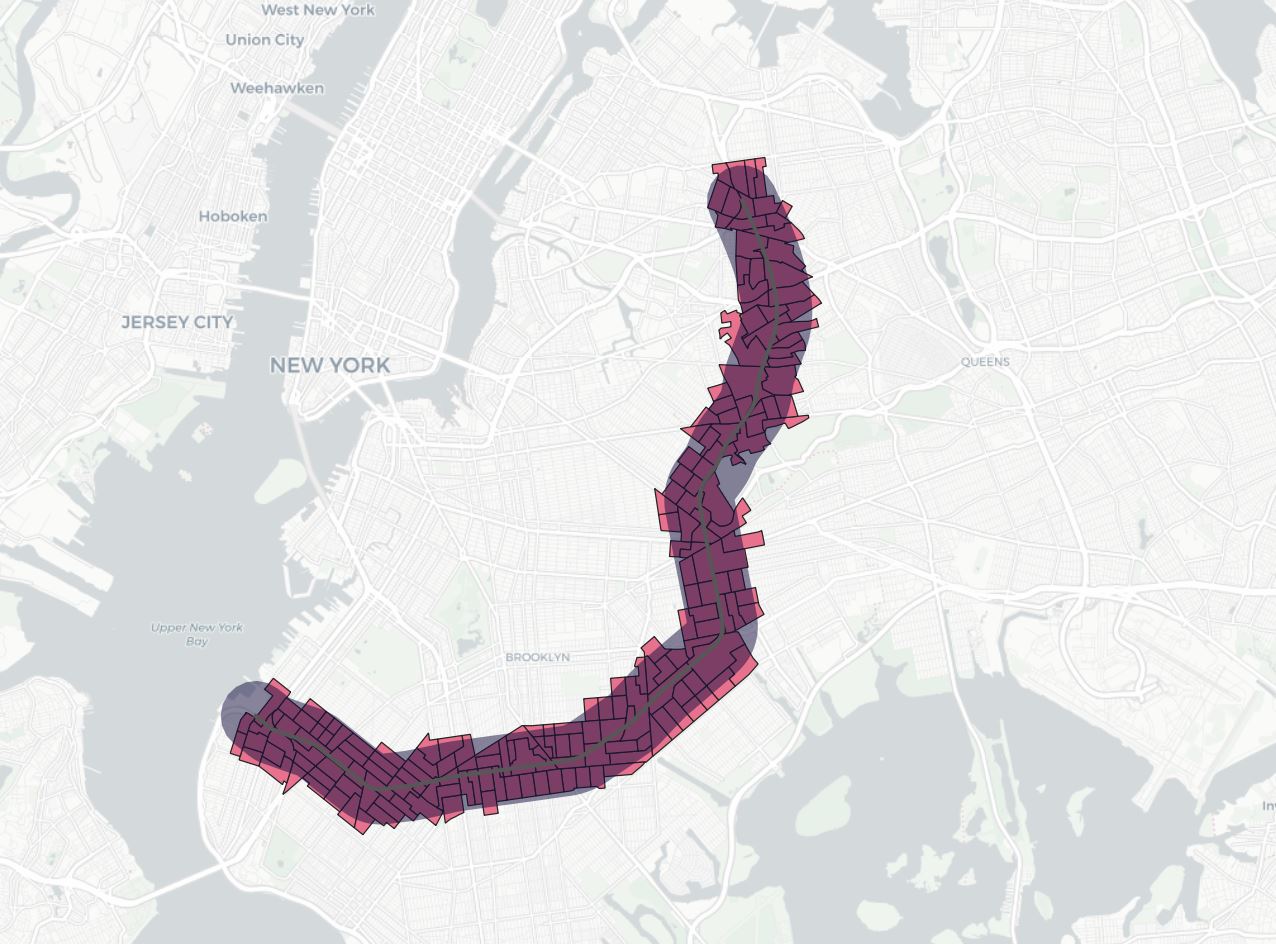
4. Jobs
2019 total jobs per census tract data, overlaid with the alignment
5. Destination Trips
Aggregates of average number of trips made to a census tract per day, within the week of September 13, 2021, from all the census tracts falling within the buffer area around the alignment. Trip data from Replica.
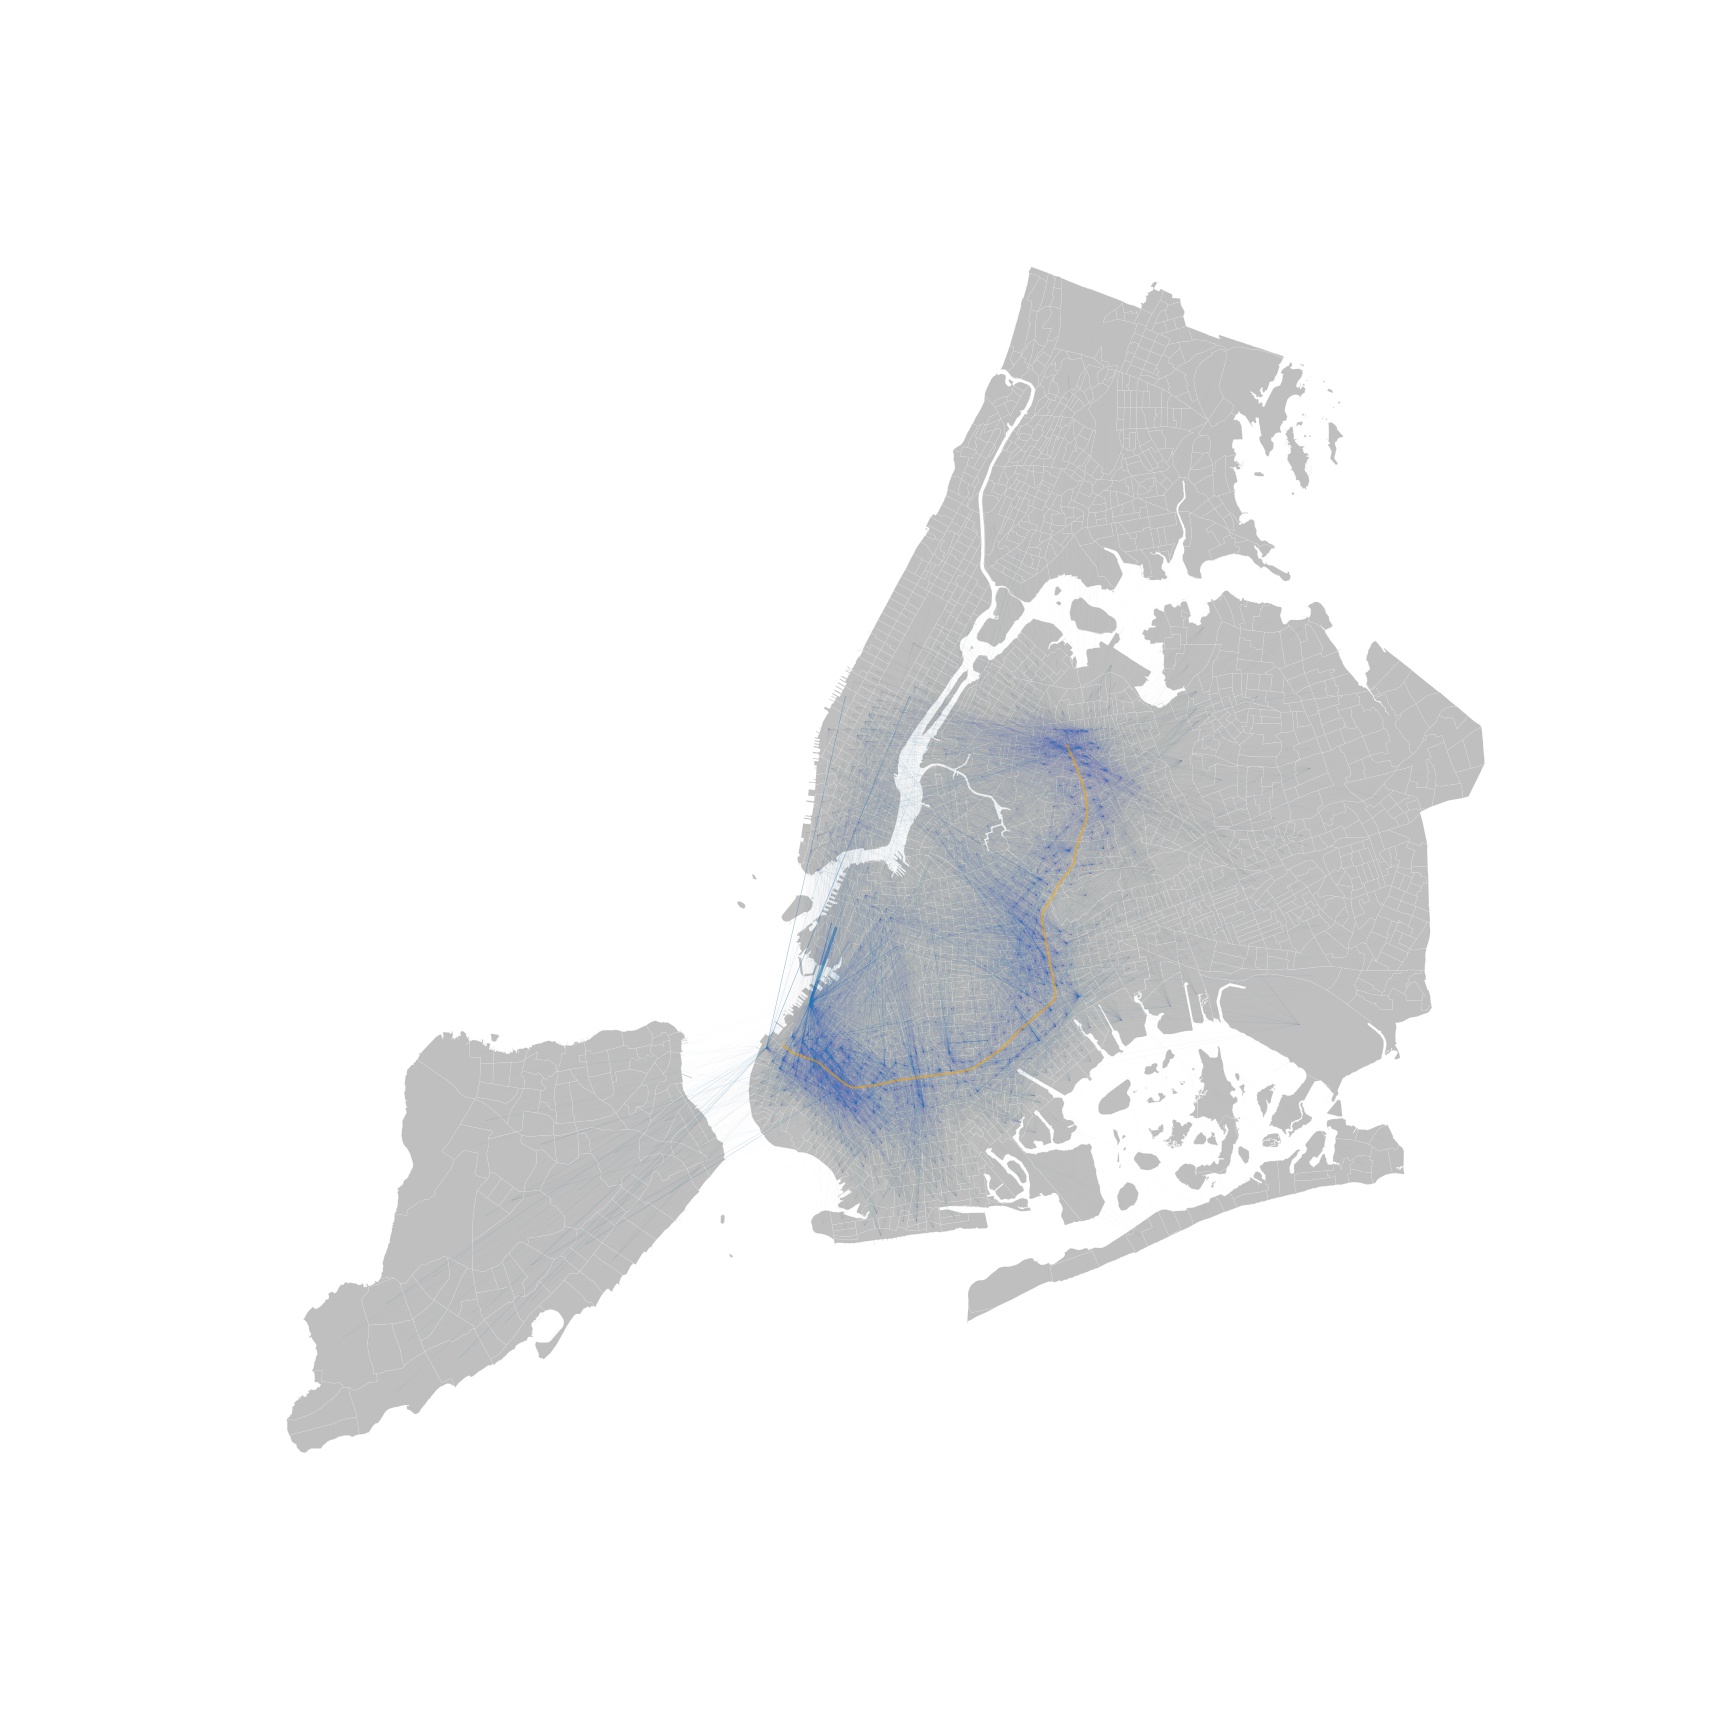
6. Network map of trips originating from within the buffer around the alignments. Trip data from Replica.
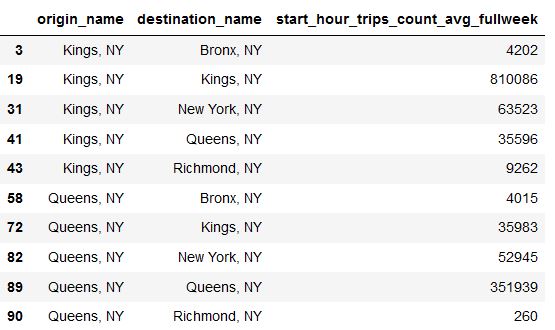
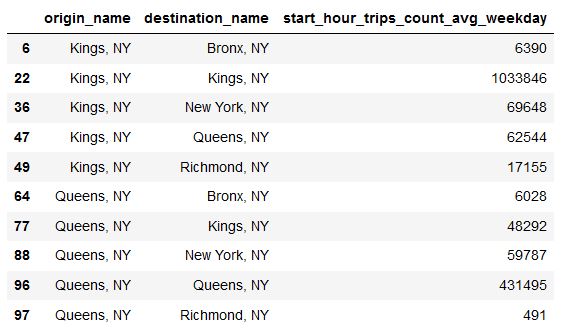
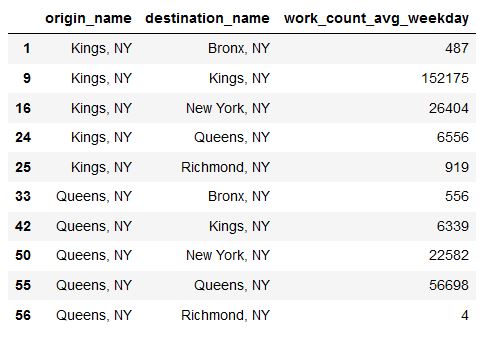
7. Numbers of trips to each borough (for trips originating from within the census tracts which overlap/intersect with the 0.5 mile buffer area). Data from Replica.
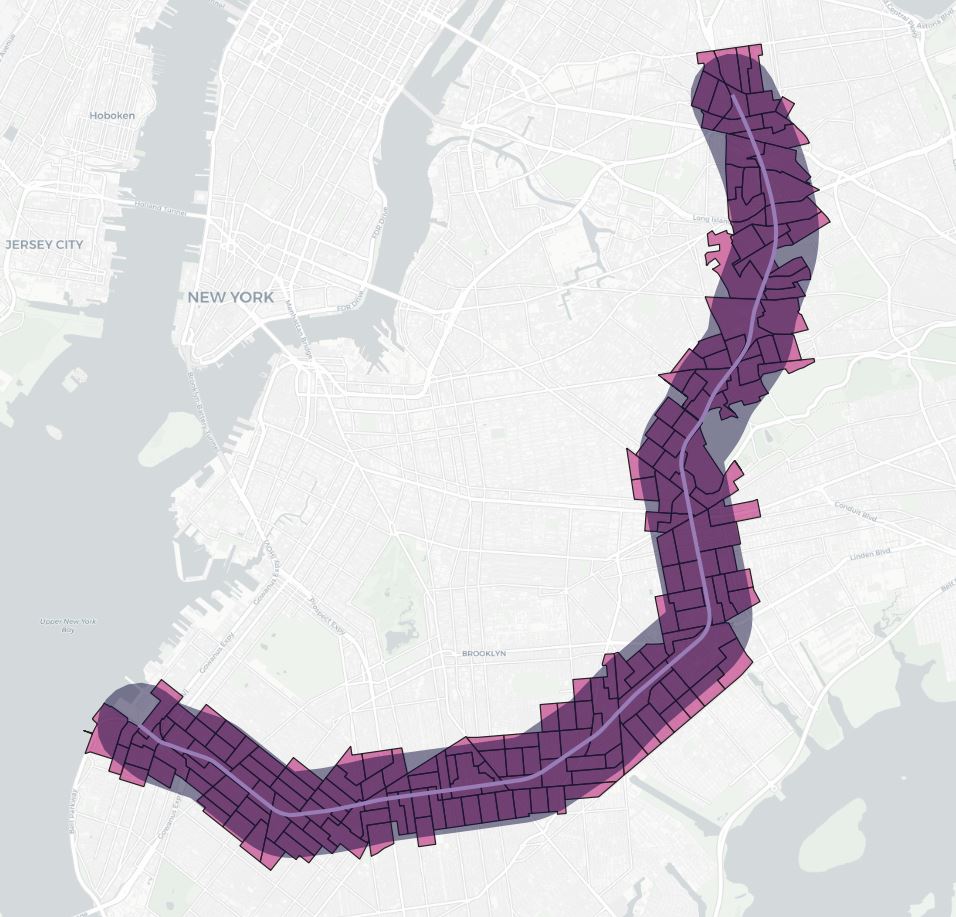
Here are the census tracks we are taking into consideration:
Average daily trips for the whole week of September 13, 2021.
Average daily trips for the weekdays of the week September 13, 2021.
Average daily “work” trips for the weekdays of the week September 13, 2021.
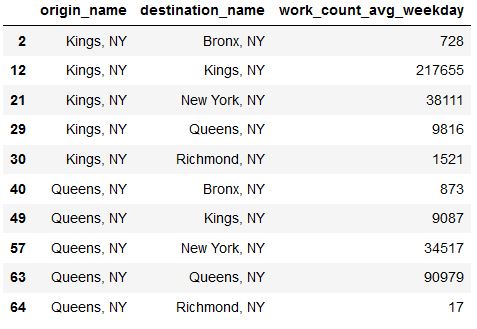
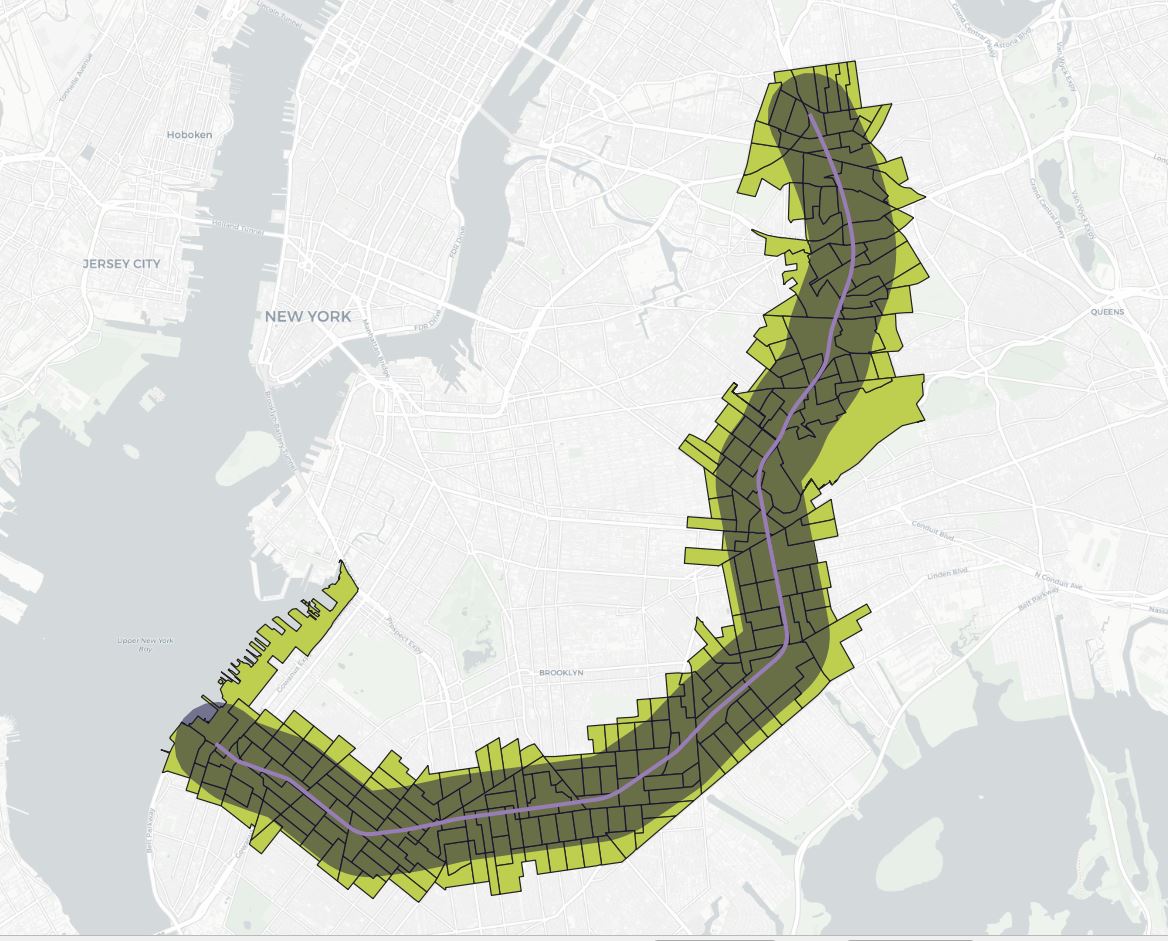
8. We use census tracts with centroids falling within the buffer area:
And we look at work trips originating from within these census tracts only:
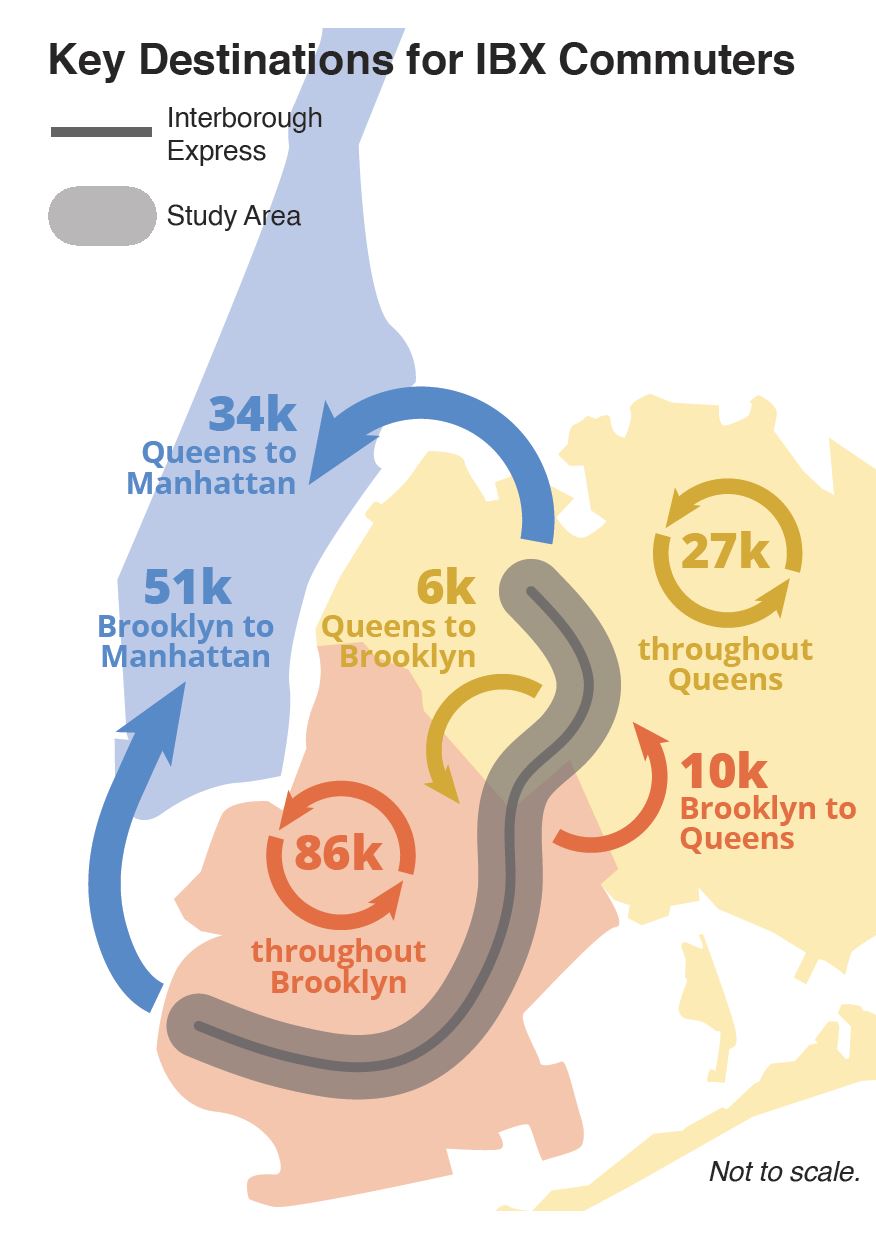
(IBX study clip for comparison)