Transit Costs Project Final Report
1. Introduction
We have most recently updated this report on 02/11/2023.
1.1 The issue of infrastructure and transportation
The idea of creating a mass public works program in the United States to build useful infrastructure is a popular one in 21st century politics. After some small starts in the Obama administration and the Trump Administration’s constant attempts at Infrastructure Week, the Biden Administration’s Bipartisan Infrastructure Law (BIL) converted this enthusiasm for infrastructure into law. BIL calls for nearly one trillion dollars in spending between fiscal year 2022 and fiscal year 2026, more than $500 billion will go to transportation, including $66 billion to mainline rail and $39 billion to other public transit (National Association of Counties 2022); with the usual five-year appropriations included, between $91 and $108 billion is to be spent on non-mainline public transit (FTA n.d.).
With such large sums at stake, it is critical to spend money productively. The reason governments spend money on infrastructure, transportation, and public transit rather than just giving people money as welfare is that these investments are framed as opportunities to improve connectivity, stimulate economic activity, rebuild old infrastructure, reduce emissions, create good paying jobs, and catalyze innovation (The White House 2022). Unfortunately, as we show in the rest of this report, the United States has among the highest transit-infrastructure costs in the world. Fortunately, as we also show, it can realign its institutional practices to match those of high-efficiency, low-cost countries like Sweden, Italy, and Turkey.
1.2 Why we study rapid transit
Building rapid transit is unusually valuable for governments, as subways, metros, and light rails operating at high frequencies generate economic value by permitting urban growth. Bunten (2017) argues that solely building more housing in congested, high-demand cities like New York and San Francisco carries a benefit of 1.4% of GDP. This finding is more muted than Hsieh and Moretti’s (2015) 13.5% benefit estimate. Bunten assumes a static transportation network since construction costs in those cities are so high; thus, more population equals greater congestion, which dampens the effect of development on the economy and introduces a negative traffic externality.
In an environment where transportation networks can grow with the city, the gains from development would be closer to those in Hsieh and Moretti; put in other words, the economic gains from being able to build dense urban transportation networks are likely to be about 10% US-wide.
These dense transportation networks have to be rapid transit-based. This is partly for environmental reasons—in a dense city, it’s especially important to have low-pollution transportation. But it’s also true in a future world where all cars may be electric. It is not possible to outdo the subway in capacity per amount of land consumed—and in a high-demand city, 12-lane freeways are prohibitively land-intensive. Hook (1994) argued that Japan focused on rail transportation in its largest cities because it had high land values in the postwar era and such strong property rights that widespread land condemnation for freeways based on the American model was impossible.
Thankfully, urban rapid transit is especially amenable to comparative research, because of its scale. Each line or phase is a large undertaking by itself: a single project routinely runs into the billions of dollars. This means that each project is itself the object of debate and media coverage. Relying on media reports and official government sources, we can get access to reliable data on the construction costs of a large majority of urban rapid transit lines in the world. We can likewise obtain costs for other megaprojects, such as high-speed rail.
In contrast, the vast majority of roadwork projects are small. A state’s road budget is typically split among many projects. Megaprojects for roads exist—for example, the $1 billion Sepulveda Pass Improvements Project in Los Angeles—but only cover a small share of overall spending. The more typical investment in roads is a bypass here, a new interchange there, and a widening yonder, all repeated hundreds of times to produce hundreds of billions of dollars in roadway expansion per six-year transportation bill cycle. Headline costs for these projects may not be readily available, and when they are they often include too many unrelated extra side projects to be useful to compare.
The difference between roads and urban rail extends beyond data collection. An engineer in Los Angeles who has worked on both road and rail projects explained to us that American road projects are essentially commodities (Personal Interview 2020). For example, a new public parking garage would be one of thousands of such structures built, which means that the costs and risks are well-known. It is also a simple project—just a parking garage. In contrast, an urban light rail or subway line, besides being one of dozens in the last generation rather than thousands, has many distinct parts: the civil structures, the tracks, the signaling system, the maintenance facility, the rolling stock. Far more prior planning is needed in the latter case, and the engineer told us that Los Angeles County’s preference for outsourcing planning to private consultants with little public oversight works well for simple projects like parking but not for more complex ones like urban rail. To maximize the quality of rail investment, it is valuable to compare the efficiency of infrastructure for rail and not for higher-cost but institutionally simpler roads.
1.3 Why costs matter
We started the Transit Costs Project to understand how to reduce the costs of transit-infrastructure projects in the United States and other high-cost countries so that we can build more transit infrastructure. In significant parts of the United States, there is political consensus behind the need to improve the state of public transportation. The reasons for this vary, but can include any of the following:
- A green desire to decarbonize the transportation sector, reduce air pollution and car crashes, and undo the postwar trends of suburban sprawl and mass motorization.
- An association between the prosperity of a central city like New York or Boston and the strength of its subway system.
- Present-day limits of freeway-centric transportation such as traffic congestion and downtown parking scarcity.
This is by no means a national consensus. But it is a consensus in most of the largest cities, including those of the Northeast and the West Coast, as well as Chicago. But despite this consensus, there is little movement on the construction of expansive urban public transit. Even projects that enjoy wide political popularity move slowly. As costs creep higher, timelines drag on, and promises aren’t kept, as we will see in the Green Line Extension (GLX) case, the public loses faith in transit agencies’ ability to deliver high-quality infrastructure at a reasonable price. Moreover, in places and among political movements that lack any consensus for mass transit investment, the high costs of construction on the East Coast and California are a common argument against investment.
The problem of high costs is nationwide. According to our database (Transit Costs Project n.d.) of more than 900 projects in 59 countries, including Hong Kong, the United States is the sixth most expensive country in the world to build rapid-rail transit infrastructure.[1] This is slightly misleading, however, because construction costs scale with the percentage of tunneled track, which is more expensive than building rail at grade. The five countries with greater average costs than the United States are building projects that are more than 65% tunneled. In the United States, on the other hand, only 37% of the total track length is tunneled (Figure 1).
figure 1. Average Cost per Kilometer by Country.
Nonetheless, the bulk of American rail construction occurs in the context of broad local political support, and even then, long-term planning is not strong and the outcomes are poor. Therefore, it is valuable to understand what it is about the physical, institutional, and social situation of American cities that frustrates subway expansion dreams.
1.4 The Cost Premium, in Brief
Based on our detailed case studies and data collection, we identified three primary factors that comprise total project costs and explain why Phase 1 of New York’s Second Avenue Subway is 8 to 12 times more expensive than our composite baseline case. Our baseline case draws on detailed cost data from our Italy, Istanbul, and Sweden cases, and is informed by data from medium-cost Paris and Berlin and low-cost Helsinki and Spain. The New York premium is based primarily on detailed cost data from our Second Avenue Subway case study, and is supported by data from our GLX case and data from London and Toronto.
The three primary factors are as follows: Physical Structures, Labor, and Procurement and Soft Costs. The Physical Structures factor can be broken down into two additional factors: Stations and Tunneling, and Systems and Standardization. Since we are working backwards from contracts rather than building up from line-item costs, our disaggregation of the data relies on these three synthetic factors rather than traditional cost categories like materials, equipment, and labor; the Procurement and Soft Costs factor affects all such categories at once. We have also combined procurement and soft costs into one factor, because in the emerging design-build norm in the English-speaking world, which postdates Phase 1, they cannot be distinguished. The factors are multiplicative, so that various premiums of 25-50% compound to produce an order of magnitude difference.
Below we detail how we developed our factors, and show how the New York premium grows relative to the baseline (Figure 2). This is in relative units, the baseline representing the aggregate of our low-cost comparison cases.

figure 2. New York Cost Premiums.
Physical Structures (Stations and Tunneling): New York’s subway station construction methods, by themselves, led station costs to triple through overbuilding. One of Second Avenue Subway’s three station digs, 96th Street, is 2.6 times longer than its 187 meter platform; the other two stations are about twice as long as the platforms, but have significantly higher costs per cubic meter than 96th Street, because of the use of a more expensive deep mining construction technique. In our comparison cases, station digs were 3-20% longer than the platforms. As 77% of Second Avenue Subway’s hard costs were stations, the rest going to the tunnels between them and systems, this by itself more than doubled costs. Finally, some utility and interagency conflicts are absorbed as overbuilding. Overall, the oversize stations alone raise project costs by a factor of 2.06.
Physical Structures (Systems and Standardization): A lack of design standardization leads to fewer economies of scale, the inability to replicate station designs quickly without incurring more design costs, and makes it difficult to apply lessons learned from one station to another during the construction process. The stations for the original GLX project and for Phase 1 of the Second Avenue Subway were bespoke rather than standardized; for example, Phase 1’s three stations used two different escalator contractors and have a different number of exits, crossovers, and elevators, all of which raise design costs because each station needs to be customized rather than using a standard design that is modified slightly. Overall, systems and station finishes cost $1.36 billion for Second Avenue Subway compared with $1.57 billion for tunnels and station civil works, a ratio of 46.5:53.5.[2] In Paris, the approximate ratio of systems to tunnel costs is 15:40; in our Italian case we found that exact ratio for station finishes and systems to civil infrastructure costs for Rome Metro Line B1, and the station procurements we have seen in our Swedish case appear similar in ratio. Together, the difference between a 15:40 and a 46.5:53.5 ratio suggests that systems costs could be reduced by a factor of 2.3, which would reduce overall hard costs by a factor of about 1.35.
Labor: In New York as well as in the rest of the American Northeast, labor is 40-60% of the project’s hard costs, according to cost estimators, current and former agency insiders, and consultants with knowledge of domestic projects. Labor costs in our low-cost cases, Turkey, Italy, and Sweden are in the 19-30% range; Sweden, the highest-wage case among them, is 23%. The difference between labor at 50% of construction costs and labor at 25%, holding the rest constant, is a factor of 3 difference in labor costs, and a factor of 1.5 difference in overall project costs. This is because, if in the Swedish baseline an item costs $25 for labor and $75 for the rest, then in the Northeast, to match the observed 50% labor share, labor must rise to $75, driving overall costs from $100 to $150. In our New York case, we show examples of redundancy in blue-collar labor, as did others (Rosenthal 2017; Munfah and Nicholas 2020); we also found overstaffing of white-collar labor in New York and Boston (by 40-60% in Boston), due to general inefficiency as well as interagency conflict, while little of the difference (at most a quarter) comes from differences in pay.
Procurement and Soft Costs (Procurement): We have identified numerous cost drivers that stem from procurement norms in the United States. These include a pervasive culture of secrecy and adversarialism between agencies and contractors, a lack of internal capacity at agencies to manage contractors, insufficient competition, and a desire to privatize risk that leads private contractors to bid higher. Overall, this raises costs by a factor of 1.85, with the extra money going to red tape, wasted contingencies, paying workers during delays, defensive design, and, owing to contractor risk, and profit. Moreover, many ongoing reforms hailed as steps forward, which we call the globalized system in the Sweden report, at best do nothing and at worst are actively raising costs; these reforms all aim to privatize risk and have been popular throughout the English-speaking world, and while consultants, managers, and large contractors like them, costs grow sharply wherever they are implemented, such as England, Singapore, Hong Kong, and Canada.
Procurement and Soft Costs (Soft Costs): Soft costs include design, planning, force account, insurance, construction management, and contingencies; breakdowns differ by city. Nonetheless, we harmonized definitions around third-party design, planning, and project management costs. Those add 5-10% on top of the hard contract costs in our comparison cases, most commonly 7-8%. But in English-speaking countries, soft costs add much more; for Second Avenue Subway, it was 21%. Moreover, this is 21% of an already inflated amount–by at least a factor of 1.5 for labor, since third-party project management costs don’t grow when contractors are overstaffed. Overall, this contributes to a New York cost premium factor of about 1.2, which we also see in other English-speaking cities. The factor has some uncertainty and may be as high as 1.3 with additional soft costs, but those are absorbed into procurement costs.
We caution that the numbers are less precise than in the above chart. For example, the factor of 1.5 premium in labor costs comes from a comparison of Northeastern American projects including Phase 1 of the Second Avenue Subway with European examples, but both sets of projects have ranges, so the actual premium ranges from 30 to 70%, where 50% is the most likely value. This is why, while the calculations look like a precise premium of 9.34, the best we can say is that the range is between 8 and 12.
The good news is that high-cost countries can adopt the practices of low-cost countries and build subways at costs more in line with those of low-cost Scandinavia, Southern Europe, and Turkey. To do this, it requires rethinking design and construction techniques, labor utilization, procurement, agency processes, and the use of private real estate, consultants, and contingencies. If it implements the best practices we detail in the rest of the overview, the highest-cost city in our database, New York, can reduce its construction costs to match those of Italy and match or even do better than Scandinavia.
[1] The total hard costs for Phase 1 were $3.16 billion. We exclude the $229 million 63rd Street Station reconstruction from this calculation because we don’t know the breakdown of civil construction versus station finishes.
[2] We continuously update our database as new data becomes available.
2. Transit Costs Project Overview
In this section, we provide an overview of our case studies and draw on our work in other cities to identify common themes across all of our research and make recommendations about how to build transit infrastructure more cheaply and quickly in the United States and other high-cost environments. While this work is comparative, we recognize that differences in accounting, project scopes, access to unit costs, and transparency make precise comparisons difficult. Despite these challenges, we believe that our in-depth case-based approach allows us to understand what drives costs in high-, median-, and low-cost projects.
To do this, we examine multiple cost drivers thematically, but every theme comes back to institutions and decision-making processes and how they influence each of the aspects we study:
- Politics and decision making
- Civil service and internal capacity
- Procurement and risk allocation
- Utilities and agency coordination
- Labor
- Cost-effective design
Physical geography, archeology, and geology also drive costs, but in the cases we have studied, low-cost countries have figured out how to deliver projects under challenging geological, seismic, and archaeological conditions. Overall, at the most general scale, it is necessary to address politics and institutions to address the downstream issues.
Practitioners in high-cost environments must be ready to learn from their low-cost counterparts, reflect on internal practices and standards, and ask both “Why do we do things the way we do them?” and “How can we adopt practices from more efficient places?”. Ultimately, lower costs can be achieved by implementing governance, civil service, procurement, and transparency reforms and using them to reduce the extent of overengineering and local extraction. None of this requires large-scale legal changes, but it does require reassessing decision-making processes, institutions, the nuts and bolts of project agreements, and getting key decision makers to support projects rather than delay difficult decisions.
2.1 Additional cases
While most of our work has gone into the five primary cases—high-cost New York and Boston and low-cost Sweden, Istanbul, and the cities of Italy—we’ve also interviewed practitioners and studied documents in other cities.
In Paris, where construction costs are roughly at the global median, we conducted six interviews and reviewed government reports to understand how one of the median-cost cases builds transit projects. While Paris’ costs are generally good, the 200 km Grand Paris Express (GPE) cost overruns have drawn severe criticism from the state’s top administrative court, the Cour des Comptes (2017). Based on our review, we have seen that French practices sometimes resemble those of low-cost Italy and other times those of high-cost America.
Additional countries and cities where we have interviewed experts, collected data, and reviewed reports include low-cost Spain, Switzerland, and South Korea; medium-cost Germany and Israel; and the largely high-cost Netherlands, United Kingdom, Philippines, Canada, Australia, Seattle, Los Angeles, and Taiwan. Among those, Spain resembles Italy and Turkey closely, and we expect that a full case study there would reveal details that differ subtly from those of Italy and Turkey but at a larger scale are institutionally similar. The others are more divergent, and we expect that full case studies there would reveal additional details and factors. Taiwan appears the most unusual: a report and an interview both blamed high costs on corruption coming from the timing of the transition from one-party rule to multiparty democracy (Personal Interview 2020).
Across the English-speaking countries other than the United States, there are some striking similarities. The institutional problems we have heard about from experts in Britain, Canada, and Australia are largely the same, and it appears that Canada, Australia, Singapore, Hong Kong, and New Zealand are imitating British practices. Moreover, the cost histories of this region are similar. Where New York began displaying a large construction-costs premium over the rest of the world in the 1930s, London only did between the 1970s and the 1990s, shortly followed by Hong Kong, Canada, and Singapore.
Imitation of British practices is also seen elsewhere: as detailed in the Stockholm case study, some of the British aspects of privatization and devolution of expertise to private consultancies are making their way to Scandinavia. We cannot definitively connect such Anglicization with higher costs, as the process is in its infancy, but the Anglicization process correlates with cost increases across countries.
2.2 Politics and decision making
Megaproject decisions are always political, in high- as well as low-cost countries. Large megaprojects are constantly referenced in party programs in national, regional, or local elections. Moreover, even when not explicitly part of an election campaign, the decision to build a megaproject is decided at the highest level. Decisions about alignments, stations, analyses need to follow standard procedures rather than being reinvented for each project. In low-cost countries, politicians do not micromanage such technical matters, but they do macromanage and make yes-or-no decisions about building megaprojects.
While there may be political consensus that subway expansion is desirable, this does not mean there is consensus about how to go about it or which projects to support. Different political parties or levels of government may snipe at one another in order to claim credit. In Turkey, it is a political goal for the Erdoğan cabinet to deny credit to Istanbul’s opposition mayor and potential presidential challenger Ekrem İmamoğlu. Since İmamoğlu was elected, it has been more difficult to arrange loans from local banks and state approvals for international funding, which has forced İmamoğlu to issue Eurobonds to finance metro expansion.
Balancing political and professional decision making is therefore delicate. Irrespective of how a city’s construction costs compare with others’, rail projects require large budgets and necessarily concern elected officials from different levels of government. If the decision is fully depoliticized, it’s indicative of very high levels of political consensus and limited credit fights.
However, while the decision to proceed is always political, the details do not have to be. In nearly all of the low-cost examples we studied, planning and design were done by professionals, with little political input. Political will to follow through with the implementation of a sequence of projects that are part of a city’s transportation master plan has kept rail construction programs in Istanbul, Milan, and Stockholm going and helped cultivate these cities’ rail industry, despite changes in government. The medium-cost expansion programs in Paris and Berlin display little political micromanagement as well; in Paris the most significant political input since the initial decision to proceed has been the decision to continue going through with the entirety of Grand Paris Express despite cost overruns and controversy about its highest-cost-per-rider section, Line 18.
In contrast, political meddling is associated with higher costs. Just getting New York’s former Governor George Pataki to provide funding for the Second Avenue Subway involved extensive local politicking. LA Metro and Seattle’s Sound Transit board members, all locally elected officials, are even more likely to interfere and then recommend further study when it comes to selecting a contentious locally preferred alternative or managing third-party agreements (Scauzillo 2019; Giordano 2022). The United States in general displays high reliance on elected officials and political appointees relative to permanent civil service, and among the trends seen in 21st-century Canada in conjunction with rising costs is the rising politicization of decisions regarding construction methods and whom construction agency heads report to (Wickens 2020). At no point have these politicians intervened on behalf of the MTA or its American peer agencies to strike deals with obstinate utility companies, smooth over frayed interagency relationships, or weigh in on labor relations until the project was nearly complete.
The flip side of the issue of political meddling is that if there is too much political support for a megaproject, its costs are likely to rise due to the problem of early commitment. Early commitment, as identified by Cantarelli et al. (2010), means that the political decision to go forward with a project is done at too early a stage of design. Once that commitment is made, it is hard to walk away from the project, it becomes easier for external actors to extract surplus and harder for the planners to engage in value engineering or fight feature creep. The federal funding process in the United States enshrines this problem in law via the Full Funding Grant Agreement: it does not permit removing scope without time consuming appeals, paperwork, and the risk of clawing back money, but does not limit mechanisms for scope creep or delays through change orders and contingencies.
In Cantarelli et al. (2010; 2022) this is seen in cost overruns more than in high absolute costs. Medium-cost countries can have early commitment as well, leading to cost overruns from initially low levels. For example, GPE suffers from this problem: it is so politically popular that value engineering is politically difficult, which has played a factor in the decision to retain Line 18 in the program. There is also an element of early commitment in Nya Tunnelbanan cost overruns, caused by changes in regulations midway through the project that require more expensive design. Finally, in 2016, Seattle voters approved a slate of projects that were based on 1-2% design, which one former official described as “a drawing on a napkin” (Personal Interview A 2022); this ongoing expansion plan is behind schedule and over budget, but there is no hint of eliminating projects or reducing project scopes despite unforeseen challenges and rising costs (Sound Transit 2021).
The hazards of early commitment and those of political meddling are closely intertwined. Massachusetts’ Green Line Extension (GLX) suffered from early commitment: the political decision to proceed was undertaken during 2000s lawsuits and confirmed shortly after the Obama administration’s stimulus bill passed in 2009, and lacking long-term in-house planning capacity, Massachusetts rushed the early design and relied on a federal grant to complete a more detailed design. The political meddling consisted of a directive from the governor to be more accommodating of local community demands, which are a vector for how early commitment can lead to cost overruns.
Politicization in the United States also raises labor costs and leads to overdesign and overbuilding. American transportation megaprojects have a mixed mandate: in addition to being projects that produce transportation benefits, elected officials pitch them as job creators and economic development tools. For such projects, the goal is not just ridership or service, but also overall spending.
A related issue is that poor planning, cost overruns, and high absolute costs may emerge from interaction between different levels of government. The United States and United Kingdom both have a culture of tapping national pools of money: once money is made available through a national program, localities choose projects based on how to maximize the federal commitment. In the United States, even rich states like New York and Massachusetts may engage in this, and try to advance projects that are believed to be political priorities for important members of Congress, even after the bill has passed and the decision making is entirely executive.
Much of American political power is informal. At this point, planners and activists expect heavyweights (such as members of Congress) to meddle even if the heavyweights are barely even aware of the megaprojects advanced supposedly in their names and would sign anything those planners suggested. Such meddling, or the expectation thereof, leads not only to cost overruns but also poor long-term planning, as priorities are shifted based on real or perceived changes in congressional seniority.
Elsewhere, political power is more formal. While Istanbul has total separation between state- and city-designed metro lines, shared responsibility for funding and planning is the norm in Italy and Sweden. In Italy early lines were built municipally, but today the state funds 80-100% and conducts tight supervision on the basis of economic performance while the planning remains local. In Sweden, only the yes-or-no decision over the largest projects, noticeable in the state budget, is political; all other projects compete for state grants on the basis of cost-effectiveness. The idea that a politician should or even could make phone calls to influence the routing priorities or adjudicate conflict over professional issues such as noise concerns is unthinkable. In low- and medium-cost countries, the role of politicians is to macromanage rather than micromanage.
2.3 Civil service and internal capacity
The other side of the coin from politics is the professional civil service. Cities benefit from continuous rail construction through the development of expertise and the growth of the rail industry. The agencies, contractors, sub-contractors and consultants gain experience through years of designing, managing, and building, and they invest in talent, technological innovation, and expensive equipment. A thick ecosystem of contractors also promotes competition; Citybanan and Nya Tunnelbanan are low-to-medium-cost projects built after a generation-long gap in Stockholm megaproject construction, but those have had to rely on ever-larger international firms.
Milan, whose network is soon to reach 110 kilometers, has steadily built urban rail since 1955, and worked with the municipally-owned engineering firm Metropolitana Milanese SPA (MM) throughout its rail construction program. MM is responsible for the planning and design of Milan’s metro network, the tramway network’s modern expansion as well as the cross-city suburban rail tunnel Passante.
Istanbul has cultivated a rail-construction ecosystem through building and planning 300 kilometers of heavy rail in three decades, in which contractors reared tunneling experts, integrated building information modeling (BIM) into their processes, and developed a prefabricated slab track system that sped up track construction. The collective experience between the city, the consultants, and the sub-contractors was also able to counterbalance the shortcomings of a less experienced contractor during the construction of M9.
In contrast, inadequate internal capacity can mean an agency plans and manages a project with too few staff members with relevant experience, or with a structural organization of teams or departments that impede efficient collaboration and decision making. When agencies lack the internal staff to plan and manage projects, they turn to consultants. During the first iteration of GLX, the MBTA, which hadn’t expanded its network since the 1980s, only had four to six full-time employees managing the largest capital project in the agency’s history. Instead of building a team within the MBTA to shepherd GLX through planning, design, and construction, the agency turned to consultant teams at each stage. When this first version of GLX failed because of growing costs and scope, the MBTA reversed course and hired a dedicated GLX program manager who in turn assembled an internal team focused solely on delivering GLX.
Because few American transit agencies have decades of experience building rail projects, there is no pool of in-house expertise. American agencies from Hawaii to Utah to North Carolina have compensated for this lack of expertise by hiring consultants to deliver rail projects, as teams can be scaled up and down more quickly than in-house staff without worrying about long-term commitments, including public-sector benefits and pensions.
However, our cases show that consultant teams need a client who knows what it wants and is technically competent enough to direct the consultants rather than allowing them to design overly elaborate stations or propose additional studies that don’t advance the project. In our GLX case we saw that when the project scope ballooned and consultants studied project alternatives that were obviously unviable, such as constructing a tunnel under an existing right-of-way, there was no one at the agency to rein in the consultants and direct them effectively. In New York, we were told that consultants were seen as an endless resource to study every challenge that emerged multiple times rather than an expensive, specialized unit hired to execute the MTA’s vision.
In the end, consultants end up getting sucked into the larger political morass rather than eliminating it. Multiple interviews with consultants working on major American projects, as engineers, designers, construction managers, and project overseers, revealed formal and informal pressure to produce outcomes that were or were perceived as favorable to the political system. GLX was under pressure to make the costs appear lower than they were, while the Northeast Corridor (NEC) Future program for high-speed rail was under pressure not to disturb very wealthy suburbs in Connecticut. Where consultants are useful, from a decision-making perspective, is in navigating internal agency dynamics: they are neutral within the intra-agency turf battles. However, if management uses consultants to avoid taking responsibility, then the challenges remain unresolved, and the use of consultants keeps design politicized without building in-house expertise.
Consultants working on French projects have stressed to us that even when agencies employ consultants, there must be ample in-house capacity to manage them well. In New York, where consultants largely designed and managed construction for Phase 1 of the Second Avenue Subway, the project management and design contracts were 21% of construction costs. In contrast, in France the typical range is 5-10%, with 7-8% most common, and in Italy and Istanbul, it is typically 10%. In Spain, mainline rail projects are designed in-house by ADIF, with design costs that are hard to disaggregate as those are long-term civil servants on a salary, but the additional private designs add 5%.
The Italian solution to this issue is to use MM as a public-sector consultant to other Italian cities, such as Naples, Genoa, Syracuse, and Parma; it’s even completed work in Copenhagen, Tehran, Santo Domingo, and Alexandria. Turin and Brescia have both modeled in-house teams on MM as they have expanded their transportation networks. France likewise uses RATP and SNCF as public-sector consultants to smaller cities. In the United States, it is prudent to empower a federal agency staffed with experienced builders of cost-effective urban rail to act as a national consultant to help cities and regions that need assistance.
2.4 Procurement and risk
The importance of a strong, apolitical civil service is most apparent when it comes to ensuring a smooth procurement process. Much of the existing literature discusses cost overruns, and some of its recommendations also apply to reducing costs rather than cost overruns but others do not. For reducing costs, a strong in-house design review team is always required, and formal and informal transparency is critical, both aspects ensure conflict is dealt with quickly and without costly litigation. It is equally critical to avoid privatizing risk, as that leads to higher costs as private contractors inflate bids to compensate for greater uncertainty. Finally, the procurement must be flexible enough to permit designers and contractors to make small changes based on circumstances and learning. Unfortunately, the English-speaking world has adopted a procurement system that, in the Sweden report, we call the globalized system, which reacts to insufficient civil service capacity by privatizing risk to large consultants and contractors. But before we explain what the problem with this system is, we give a descriptive overview of procurement systems.
The three main ways of procuring megaprojects that we encountered in our cases are design-bid-build (DBB), construction manager/general contractor (CM/GC), and design-build (DB). Under DBB, there is separation between design and construction; under DB, the same entity designs and builds the project. Under CM/GC, the general contractor is brought in during the design phase to work with the design team to produce plans that best match their strengths and identify weaknesses in the design before transitioning to the build contractor during construction. It’s worth noting that under CM/GC, the agency ends up owning the design like DBB rather than offloading design risk, as in DB.
There has been a tendency in the last generation to transition to alternative delivery methods like CM/GC and DB, which are viewed in much of the English-speaking world as more modern and flexible because they allow contractors to use their means and methods to develop the designs and techniques best suited to their abilities and equipment to deliver the project. But most low-cost examples do not use CM/GC or DB; it is not used in Spain, Sweden is early in the transition from DBB to DB, and Italy uses a mix of methods but has de facto banned CM/GC. Turkey has used both DBB and DB, and now uses a hybrid system, in which there are two contracts but they are not split as design and construction but rather as 60% design and a combination of 100% design and construction; Italy in practice is similar, except that the threshold is not 60% but 80-90%.
Across our cases, we find that the procurement method matters less than how the process is managed and how competent public oversight is. In other words, what matters is that public agencies are entrusted with the powers and the technical capacity to guide the procurement and delivery process. Public agencies should retain the legal and technical capacity to supervise crucial in-construction decisions, such as major change orders, by having wide access to information and by leveraging in-house technical expertise. In Italy, whenever crucial functions of early planning, construction management and oversight were entrusted to empowered public technical entities, even highly privatized Public-Private Partnerships (PPP) schemes proved to be cost-effective, though the guaranteed concessionaire profits have led to elevated operating costs at high implied interest rates.
Another key element for effective procurement is the level of design upon which RFPs are based: it is critical to avoid rushing the design and spend time on the riskiest elements, such as seismology in earthquake-prone areas, archeology, utilities, and difficult third parties, such as freight railroads in the United States. In Istanbul, as the preliminary design documents improved, the agencies were able to enter the tendering process better informed and had greater command over the project throughout construction. Flyvbjerg and Gardner (2023) refer to this as “think slow, act fast.” There is a tradeoff between working slowly to be more informed and working quickly to avoid having to redesign based on economic changes, and the best approach is to be methodical in the planning stage and fast in the construction stage.
Bid selection is based on either the lowest bid or a combination of price, schedule, and technical merit. Lowest-bid contracts are used for simpler projects or sometimes for simpler aspects of metro lines, such as systems, but rarely for complex civil structures such as metro tunnels. Contractors prefer it this way, since an emphasis on technical quality over price rewards their professionalism instead of a race to the bottom. The weight given to technical merit should be high: 50% in Sweden, 60% in France, 70% in Spain (including speed of construction), and 70-80% in Italy; California has used 30%, which is insufficient for distinguishing the technical soundness of competing bids and in practice behaves like lowest bid. Istanbul exceptionally uses lowest-bid, but the race to the bottom is tempered by three things: the delivery standards enforced by the CM and the agency, the 20% limit for total cost overruns, and the extremely competitive market for contractors.
Without technical scoring or Istanbul’s thick, competitive markets, agencies must use other, inferior mechanisms for quality control. One such mechanism, used extensively in New York, is a lengthy Requests for Information (RFI) process where the agency responds to questions specifying exactly what contractors can and cannot do, down to controlling the materials they use; this is inflexible and increases costs. Contractors throughout the United States call this the agency factor, where the agency can be the MBTA or Sound Transit, or any other large transit agency, and raise their prices by about 20% just for the red tape involved. A more flexible approach requires the agency to have sufficient in-house staff to monitor proposals, in which case they might as well pick contractors by technical merit.
Contracts can be itemized or fixed-price (also called lump-sum). The same international consultants who recommend that DB is more modern also prefer fixed-price contracts; in the Nordic countries this is justified as a way of unlocking private-sector innovation. Instead, complex megaprojects should always be itemized, in order to inform public-sector innovation, increase transparency, and reduce friction in change orders.
Moreover, the itemized costs must be public. In New York, there are itemized costs prepared by independent cost estimators to inform the MTA when evaluating fixed-price bids, but other than the negotiated wage rates with organized labor, those costs are considered a trade secret of the agency, not to be publicized or else it would interfere with the bidding process. Low-cost countries do the exact opposite: Turkey, Italy, and Spain all use official benchmark unit prices, which have proven to be an important tool for transparency and symmetry of knowledge between the clients and contractors.
The transparency of itemized contracts is especially important for further work on value engineering. To build up their own internal expertise, agencies need to know how much things cost, and the general public and watchdog organizations need to be able to oversee such contracts. In our interviews in New York we realized early that exact comparisons at the level of individual items are impossible, because the data doesn’t exist: the fixed-price contracts do have some itemized breakdowns reported but they’re sporadic and contract packages include multiple deliverables.
Another advantage of itemized costs is that they largely eliminate disputes due to change orders. Ryan (2020) demonstrates that fixed-price contracts for coal plants in India incentivize contractors to lowball their initial bids and then extract more during renegotiation. Likewise, Bolotnyy and Vasserman (2019) find that Massachusetts bridge repair contracts are overall cheaper under itemization because contractors face less risk of escalation in the cost of individual inputs. In mass transit, this has been a recognized if not academically studied problem for a generation, going back to when Los Angeles Mayor Tom Bradley called Ron Tutor the “change order king” in 1992. But Tutor-Perini still gets contracts in California, and change orders remain contentious across the country; in many interviews across multiple American cities, we have been told that contractors make the most money on change orders.
Technical scoring and cost itemization are both especially important for complex megaprojects such as urban subways, which are inherently riskier than roads or regular buildings. Geotechnical surprises are inevitable, and tunnel boring machines need regular maintenance and in practice only operate about 20%-40% of the time.
Spain, Italy, and Turkey are all positive examples. In Spain, an in-house team supervises contractors and approves changes; costs are itemized, so the change is already priced in and eliminates the need to litigate. Turkey approves changes at the construction stage even when they are large, and the contractor that gets the final design and construction contract may still make significant changes from the separate 60% design contract. Since the total cost increase is limited to 20% of the contract value, the agency and the contractor make every effort to balance the change in costs to avoid going over this limit, which would require political approval.
Other places do this less well. Traditional DBB procurement in the Anglosphere as well as in the Nordic countries has been more rigid with regards to changes. In Norway, the rule is that the designer is liable for damages caused by construction if the builder does not make any changes but otherwise the builder is liable; thus, builders avoid making changes, and designers respond with defensive design, trying to anticipate every problem that may arise. American DBB has also been marred by underinvestment in internal capacity—if there are too few design review engineers relative to project size then they will not be able to oversee changes promptly and the project will be stuck.
Regardless of itemization, it is important to keep the risk in the public sector, not the private sector. The private sector compensates for risk by bidding higher, as is common with fixed-price contracts. In the most extreme case, a private contractor can more easily walk away from a stalled project, whereas the public sector cannot due to political embarrassment: the Maryland Purple Line, a PPP designed to transfer risks associated with design, inflation, and utility relocations to the private contractor as trumpeted by Governor Larry Hogan, blew out so much that the concessionaire walked away from the project and collected a $250 million kill fee (Shaver 2020).
Finally, it is important to optimize for minimizing absolute cost, rather than minimizing cost overruns. The deep literature on cost overruns has led agencies to enact changes that improved estimations and reduced overruns; by the 2000s, American light-rail projects stayed on budget, on average (Button et al. 2010). Unfortunately, some of those mechanisms have led to higher upfront costs, such as the private sector’s aforementioned risk premiums as well as higher contingency rates. The use of excessive contingency is especially notable as bad practice. If the money is already allocated in the budget, there is no incentive not to spend it.
This does not mean that tolerance for cost overruns is good. Multiple good planning practices, including itemization to reduce conflict, flexibility about small changes, and avoidance of early commitment, operate by reducing the scope for cost overruns. However, relative costs should not be the only metric used for evaluation, because then contractors have an incentive to bid higher, and then the extra money is guaranteed to be spent.
Overall, we believe that the difference between the best and the worst procurement practices contributes a factor of 2 difference in construction costs. Many different contractors have spoken about how red tape and poor oversight contribute a 15-20% cost premium across American agencies, as noted above. The contentious change order process is harder to quantify; in Ryan (2022) it is said to raise solar power prices in India by 10%. A manager with extensive background in MTA capital construction added, on top of this cost premium, factors related to risk, risk compensation, subcontractor red tape (for example, the Minority- and Women-Owned Business Enterprise rule, or MWBE), and, owing to insufficient competition that sometimes results in one-bid contracts, profit (Personal Interview A 2021); overall, this manager estimates a factor of 2 difference in costs purely due to procurement problems.
Moreover, we believe that, unlike some of the other problems in this report (see below on labor), the procurement problems are not purely American. The globalized system is rife in the English-speaking world; we note that London Underground construction costs were in line with Italian levels and only diverged in the 1990s, when there were massive changes in British procurement reducing the role and expertise of the civil service and (after cost overruns on the Jubilee line extension) replacing it with private consultants. Indeed, the London cost premium over Italy and Sweden is not a factor of about 10 as in New York, but a factor of about 3.
2.5 Utilities and agency coordination
Effective governance doesn’t exist solely at the level of the individual agency. Coordination within and between agencies is unavoidable and critical to managing a project in a built-up urban environment. These can include peer mass transit operators sharing the same right-of-way, but also agencies that control streets, sewage, power, or other utilities. All of these interfaces add a layer of coordination, which is invisible when done right but drives delays and costs when done poorly.
We have repeatedly heard from people involved in the construction of urban rail tunnels in the United States that physically dealing with underground utilities is difficult, and not just in New York but also in much newer and less dense places like San Jose and Los Angeles. Due to ongoing construction and maintenance work, utility lines frequently are added or moved, and utility maps are perpetually out of date; this partially explains why urban tunnels are more expensive than tunnels for intercity rail outside urban areas, and why city center tunnels cost more than metro tunnels in farther out neighborhoods.
And yet, the utility problem is really a problem of coordination with other agencies and utility providers. Italian cities are old and densely populated, too, but have a clear process, the conference of services, that allows each impacted administrative entity to represent its interests prior to construction. In Milan this has gone a step further: thanks to MM’s success in planning and designing transportation infrastructure, the city has given it responsibility for planning and designing water and sewage projects, too. The difference between Milan and New York is not density or the physical state of the utilities; it’s the governing institutions. The Milanese organization, in which the agency that builds metro tunnels also builds other city utilities but does not operate the trains, is a valuable model for improving coordination between utilities.
In American cities, the transit agency is separate from the agencies or companies that own and operate power lines, telecommunications networks, sewage, streets, and parks. What drives costs is the difficulty coordinating across these entities and reaching cooperative agreements that ensure all parties’ needs are met equitably. More often than not, megaprojects with their multibillion-dollar budgets pay for utility upgrades, new street lights, and upgraded pipes in order to buy permission to dig shafts, tunnels, and station caverns. In our Second Avenue Subway case, contractors often complained that the local power utility slowed them down and raised costs by not showing up to power down electrical lines when it said it would even though all entities had agreed to a schedule prior to construction.
In New York, we were told numerous times that MTA Capital Construction needed a sign off from New York City Transit (NYCT), the entity that operates the buses and subways in New York, before starting construction. In New York this meant adding more back-of-house space to stations than was necessary, building more crossovers along the line than were needed because NYCT wanted them (for example, at 72nd Street), and even changing the size of tiles to conform to NYCT standards. In our GLX case this meant adding spaces for MBTA staff at stations and building a larger than necessary Operations and Maintenance facility for the Green Line. By separating capital construction from operations, there are fewer opportunities to get sucked into the internal politics of the agency and design stations and facilities that deviate from international standards.
Across these examples, the key is coordination and boundaries. In terms of coordination across agencies and utilities, clear, unambiguous standards and expectations about utility replacements and street restoration are paramount. If every interaction is unique and requires a new set of negotiations, there are more opportunities for delay and uncertainty. In the case of intra-agency coordination, the same rules apply: the capital construction arm shouldn’t be held hostage by the operating arm. This means that the operations department needs to engage seriously from the outset and determine what it needs and what would be nice to add if budget allows. Taken a step further, perhaps, a complete separation of operations and capital, as we saw in Italy, Sweden, and Istanbul, is the best way to proceed.
2.6 Labor
High-cost, low-productivity labor can substantially raise construction costs. In our American cases, we found that labor costs consumed a greater percentage of construction budgets than in our non-American cases because of strict overtime rules, local union agreements that limit the available labor pools geographically, and an unwillingness to address staffing and labor agreements. In contrast, in our interviews with experts outside of the United States, none mentioned labor as a factor, even in high-cost countries like Britain and the Netherlands.
When we examined the data on labor costs, we found that in New York labor costs reportedly accounted for 40-60% of the overall construction costs. In contrast, labor amounted to 20-30% of the overall cost of construction in Italy, Sweden, and Turkey. Reducing American labor costs to their Italian, Swedish, or Turkish share would cut labor costs by a factor of about 3, and overall project costs by a factor of about 1.5.
Different low-cost countries have different levels of wages, benefits, and worker empowerment. Low-cost Scandinavia is famous for its high union density, extensive use of sectoral collective bargaining, and low inequality. Low-cost Turkey has a non-union construction workforce and few statutory labor protections, which means laborers are paid $12-15 per hour including overheads and social security. Miners in Sweden are paid around $90,000 a year, with a similar amount paid out as benefits including temporary housing, while other workers on a construction site are paid about half as much—and a union analysis from the 2000s found that 45% of megaproject construction workers were temporary or permanent migrants (Jonsson et al. 2014). Contractors we interviewed with experience in both Sweden and Turkey told us that Sweden’s high labor productivity compensates for its high wages.
Tunnel boring machine (TBM) staffing provides a ready-made example of where an unwillingness to address staffing and labor agreements drive costs without improving productivity. During construction of Phase 1 of the Second Avenue Subway 46 workers were employed to operate and support the TBM per eight-hour shift. In addition, there were another 29 management staff who oversaw construction over the course of the day. In our interviews, we were told that staffing and supporting the TBM could have been done with 30 workers per eight-hour shift and that the number of supervisors exceeded international norms (Personal Interview B 2021).
And yet, the overstaffing in the United States is not a purely blue-collar phenomenon. Much of the premium comes from white-collar overstaffing: in our GLX case, we found that during the first iteration of the project, the ratio was estimated at 1.8 craft laborers to 1 supervisor by the CM/GC. In New England, the expected ratio is 2.5 or 3 craft laborers per supervisor; thus, GLX had 40-60% more supervisors than is normal in the Northeast. In New York, each agency insists on having its own on-site supervisor. For example, Con Ed requires its own workers to handle electric utilities, and this is counted as additional staffing for what is really an interagency turf battle.
But this does not mean that the unions are blameless in New York. There, they raise costs due to three quirks of American labor relations.
The first quirk is that the American labor tradition has rigid overtime rules. In New York, tunnel workers doing weekend work get paid double their standard hourly rate. This is so lush that senior workers often deliberately seek out jobs paying extensive overtime. In contrast, French overtime is only 1.25-1.5 times normal pay and capped at 10 total hours a day and six days a week to prevent overwork. Swedish miners do not receive overtime. This applies to operations as well: American transit workers pick their shifts in order of seniority with an overtime formula, whereas German and Swiss workers are scheduled centrally according to a system that ignores seniority and aims to spread the least desirable shifts (such as night shifts) equally among workers.
The second quirk is that American labor is local. Railway workers and construction workers in Europe are nationally mobile and often mobile across the entire EU. Spanish rail maintenance workers move between different parts of the country, staying in temporary worker housing wherever they are posted to. So do tunnel miners in Sweden; many are EU migrants, and on Nya Tunnelbanan none is a native Stockholmer. No such thing occurs in unionized American labor: the tunnel workers and operating engineers in New York are rooted in the region and only work within or right next to the city.
The mobile system has its own costs. Fringe rates are high because of the need to provide temporary housing: they add 100% to the cost of a Swedish worker, a comparable rate to that of a unionized New York tradesperson, American unions having unusually high fringe rates due to high-cost health plans. However, a nationally mobile workforce is a more productive workforce–such workers gain experience from tunnels built elsewhere, whether for infrastructure or for the mining of natural resources. Present-day New York laborers only have experience with New York projects; thus, they are a dedicated and driven workforce but also a low-productivity one, having never seen more efficient tunnel projects.
The third quirk is that among politicians, the mentality is that unions are a veto point rather than one additional interest group that they can accommodate or overrule based on circumstances. Thus, politicians are reluctant to force unilateral changes (such as eliminating the supernumerary positions among laborers or working to bring in outside workers); the view is that any change has to be a negotiation. This way, if there’s any conflict, the default solution is to change nothing, and this way, work rules can stick for generations even as labor-saving technology develops and wages rise.
2.7 Cost-effective design
Differences in design drive large differences in costs, particularly for stations. As before, the real questions are institutional, and there, three key principles emerge. First, agencies that follow consistent national or international standards for design and construction build projects cheaper and quicker than agencies that turn to bespoke solutions for every project element. Second, cities should be willing to tolerate somewhat more surface disruption to get construction done more quickly. And third, agencies that prioritize value engineering and in particular build right-size stations using conventional techniques have lower station construction costs than those that mine palatial stations with plenty of excess space.
Standardization reduces design and soft costs. For underground stations, this typically includes systems such as standardized elevators, ventilation facilities, and mechanical rooms. This way, design costs can be shared across stations within a project and across different projects in the same city, to take advantage of economies of scale. Standardization also enables agencies to learn as they go and apply lessons intelligently to speed up construction, reduce costs, and avoid future mistakes (Flyvbjerg 2021; Eno n.d.).
Italy uses international, European Union, and Italian standards for station fittings. This coexists with high levels of flexibility in contracting as mentioned above under procurement: the components are standard, but if variations from the design are needed based on unexpected tunneling surprises or changes in material costs, builders can still make changes. In Copenhagen, designers told us that the stations were 70-80% standardized (Personal Interview B 2022). But the United States has little such standardization: each Second Avenue Subway station and the stations in the initial iteration of GLX were unique, to the point that even the escalators in the three newly built stations in New York were manufactured by different companies.
Scale is important for much more than just subway stations. Inherently cheaper items such as at-grade construction and systems have unusually high design costs if they are bespoke. Thus, in Boston, it costs $20-25 million to build an above-ground commuter rail station, of which $2-7 million come from one-time design costs. The United States has also so far not used any of the standardized European or Japanese modular rolling stock, but instead either customizes trains or reuses obsolete designs that vendors no longer build.
Standardized stations do not have to be spartan. Station design in Stockholm and Helsinki is standardized, but the finishes are aesthetically pleasing, and stations have unique art installations. Stockholm achieved this historically while building the T-bana for $3.6 billion in 2022 dollars, about one-fifth the per kilometer cost of the contemporary Washington Metro, whose stations are uniformly brutalist.
But it’s not enough just to standardize. The standard design must be itself economical, which means stations as shallow as possible based on the chosen construction technique; shallow stations are also better for passengers because they minimize station access time. Standardizing around very deep mined stations hardly saves money or time, nor does it produce the best final product for passengers.
In practice, cost-effective design requires cities to be willing to disrupt the street during construction. The tradeoff is that tunnels can be built by shallow cut-and-cover or by deep mining with a TBM or (rarely) with drilling and blasting; cut-and-cover is cheaper but more disruptive, as the entire street is dug up, and therefore is almost never used today. Vancouver’s Canada Line, a rare modern example of cut-and-cover construction, faced lawsuits from store owners along the street, some resolved only in 2020, 11 years after the line opened; as a result, Vancouver is building the Broadway subway by bored tunnel (Britten 2020).
The usual compromise between the surface disruption of cut-and-cover and the high costs of deep construction is to build cut-and-cover stations but bore the tunnels between; this localizes the disruption to areas that will derive the most benefit from the opening of the line. Expensive projects’ costs are largely tied up in stations, and even medium-cost projects like Helsinki’s Länsimetro Phase 2 pay more for stations than tunnels.
Mined stations are an option as well, but cost more. The two mined stations of Second Avenue Subway cost on a per-volume basis 1.5 times more than the cut-and-cover 96th Street Station. Stockholm has long used mined stations, but in Oslo, the use of mined stations is one of the reasons the Fornebu Line cost $330 million per km compared with $110 million per km for the Løren Line, whose sole station was built cut-and-cover.
Station entrances are uniquely challenging, regardless of construction technique, because entrances are where the project meets the built environment; thus, choosing appropriate sites for both worker access and passenger access and egress is critical. City parks and squares are ideal for this because they are unbuilt upon and are usually municipally owned and don’t necessitate costly and time consuming condemnation processes. Paris, Berlin, Stockholm, and Istanbul all use public parks and plazas to site entrances, and the last three often use this to break up mezzanines into smaller cut-and-cover excavations even if the platforms are mined (as Berlin’s underwater Museumsinsel station is). Milan used city center plazas when it built M1, but could not keep doing so as it ran out of good sites in its Renaissance core. Helsinki uses shopping centers for access.
In New York, the street grid is such that the best location for station entrances is the street and the sidewalks, as at the older stations. This requires some willingness to do street closures during construction. But not only was Second Avenue Subway forced to keep the street open for traffic during construction (in Sweden, roadway disruption is acceptable but not sidewalk disruption), but also it spent extra money to avoid disruption. The TBM launch box included a chamber for storing muck overnight, since overnight trucking was banned even though the TBM operated continuously. Such extra infrastructure interacts with high labor costs, since the daytime-only trucking, when traffic is the worst, tripled the number of required trucks; overall, between the chamber and extra labor costs, the excess cost was $20-30 million.
A final potential construction technique is to put the station inside the bored tube. This can be done if the platform is narrow enough to fit in an ordinary bore, as is the case for some of the recent Italian metros. Alternatively, both tracks and platforms can be put in one large-diameter bore, usually measuring 12 meters or more. This method, called the Barcelona method after its use in Barcelona L9, is controversial: L9 suffered a large cost overrun, making it Spain’s most expensive metro; and yet, some experienced engineers believe it can work for metros, based on its success in Japanese and Turkish high-speed rail tunnels. The tradeoff of the Barcelona method is that the building settlement risk is extremely high, which is why it was rejected in historically sensitive parts of Italy, but there is little need for any cut-and-cover or mined infrastructure, making it perhaps useful in city centers with complex underground metros but also wide enough streets that the building settlement risk can be mitigated.
Finally, it’s critical to limit the extent of the station dig to the smallest box required for the station. As with standardization, the result of good design is not cramped; there must always be sufficient space for passenger circulation. Unfortunately, some North American cities build the stations not just too deep but also too long, housing back-of-house space in the dig at high cost.
French, Swedish, and Italian subway station digs are barely longer than the trains they intend to serve; an excess of 5% is typical, and 20% is high. But Second Avenue Subway’s mined 72nd and 86th Street stations are, respectively, 400 and 300 meters long, where the platforms are only 187 meters long; the extra length of 72nd over 86th comes from unnecessary crossovers. The rest of the extra volume in these station boxes was given over to back-of-house spaces for mechanical rooms, fan rooms, plenums for the air tempering system, and offices, work stations, and changing areas for signal maintainers, elevator and escalator repair teams, train crews, and other MTA user groups. Where European cities build back-of-house spaces in the area above the platform, New York builds a full-length mezzanine above the platform for passengers and then builds back-of-house areas beyond the platform.
The American design tradition of full-length mezzanines goes back to 1930s New York and has never been value-engineered away. New York’s large cost premium over Paris and London goes back to that era. Engineers and designers that we spoke to about Second Avenue Subway repeatedly cited the need to evacuate stations in six minutes, per fire code requirements, as a justification for full-length mezzanines, when the same fire codes are used in Turkey and (with light modifications) Spain without this feature.
2.8 Recommendations
It is possible to realign institutions and norms in American cities to build urban rail at costs that approach what we have found in low-cost examples like Spain, Italy, Turkey, and Sweden and medium-cost ones in France. We believe the most important development should be to empower entities that build transit projects to realign regulations and practices with what is found across as wide a net as possible of low-cost cities.
To affect such realignment, it’s necessary to cultivate champions who will build long-term public-sector expertise in innovative construction and management techniques, even in the face of public and political scrutiny. All of the following changes are required toward that goal:
- Find champions who will advocate for the project, help with intergovernmental agreements, hold agencies accountable for budgets and schedules, and support agencies if there is political controversy. But the champions need to macro- and not micromanage: their role is to encourage expert civil service plans rather than supplant them.
- Import experts from abroad to get a new perspective on how to do things. Adopt standards that have been tried abroad rather than limiting options to what has been tried in America. Develop long-term connections with peer agencies, including exchange programs, data sharing, hiring and promoting people who speak the language and have the required connections, and participation in global conferences and symposia. Moreover, the people who get to travel abroad for such conferences must not be just senior management, but rather junior and mid-level planners who are eager to develop themselves; the role of leadership is to support the knowledge of junior staff and not to micromanage.
- Collaborate and work with agencies in the same city or region, particularly utilities if they are not all under one roof. It is necessary to ensure that utilities work with transit agencies to provide clear, up-to-date information about their infrastructure so that construction schedules aren’t needlessly delayed once contractors begin construction. There should be staff members within each agency with the permanent portfolio of interacting with their counterparts at peer agencies.
- Foster a culture of transparency, in which information concerning infrastructure maps, blueprints, itemized costs, and public contracts is available to the public, in easily readable forms. The information should be proactively available, without subjecting members of the public to the red tape of freedom of information requests.
- Staff up internal permanent positions, with funding out of regular appropriations and don’t rush to get outside money first. If a region chooses to increase the scope or speed at which it builds infrastructure, as Boston did for GLX and may in the future for the Regional Rail program and as Paris did for GPE, it should proactively staff up in-house. It’s critical to have well-thought-out plans in advance for when money becomes available, to prevent problems of politicization and early commitment, for three reasons. First, to be able to oversee all contracts as well as consultants if they are used. Second, to prevent a GLX-style panic and the costs associated with restarting the project. And third, to make sure that what the planners learn during the project can be folded into the agency’s permanent in-house knowledge base.
At the federal level, it would be wise to empower an agency, perhaps within the FTA or FRA structure, to hire experienced builders of cost-effective mass transit and act as public-sector consultant. In addition to providing assistance, this same agency could also supervise grant applications, with enough staff to ensure fast turnarounds.
Moreover, the entire procurement process must be reformed, and medium-cost countries that believe that the British model is more advanced must cease adopting the methods of such a high-cost country. Instead, the procurement process must be based on the principle of public-sector expertise, with an in-house engineering team that is competent enough to do planning and design. The best practices in procurement are as follows:
- Use either DBB or DB delivery, but if DB is selected for a complex project, the contractor should be involved early to identify the most pressing risks. For a DBB project, the construction contractors should be empowered to make small changes to the design, and this should be codified by only doing the design up to 60-90% so that the construction contractor can make final decisions. In either case, there must be ample in-house expertise to supervise the contractors.
- Itemize contracts with publicly-reviewable itemized costs, and avoid fixed-price contracts.
- Ensure the change order process is flexible and lawsuit-free, anchored by the itemized contract, with an allowance for a mid-project change in itemized costs due to changes in market wages or global commodity prices. This requires a substantial in-house design review team to respond to change orders quickly, and may not be compatible in the long run with the pure client model that the Nordic countries wish to transition to under British influence.
- Keep the risk in the public sector. Requiring the private sector to own all of the risks just leads to higher bid prices, without reducing the risk of major cost overruns; this interacts with itemized change orders, since the itemized contract anchors a price that the public client has to pay.
- Award contracts based on technical merit and not just price. The technical score’s share of the overall award decision should be at least 50%, and possibly 60-70% or higher.
- Standardize regulations to ensure that national and international contractors can understand and comply with them without having to hire local bundlers or subcontractors. Unique state regulations, for example MWBE in New York, reduce the ability of outsiders to break in and compete in the domestic market.
- Limit contingencies: high contingencies, sometimes going up to 40-50%, just end up getting absorbed into the budget with little benefit. It’s more important to control absolute costs than to control cost overruns; in the United States, cost overruns have been uncommon since 2000, but absolute costs are very high. Additionally, for projects that are broken up into phases, contingencies should decrease between phases as lessons learned and actual costs shape future phases.
Finally, the design must be cost-effective. Value engineering must be proactively integrated into every project, and this is especially important for the construction of stations, since the differences in costs between different cities are more in the stations than in the tunnels between them. All of the following principles are critical:
- Standardize designs so that they can be repeated between different expansion projects, without the urge to tweak the design every time based on small changes in taste or law. Tweaks should only be done based on local physical conditions, such as the shape of the street network or surrounding infrastructure, and lessons learned during construction.
- Use cut-and-cover infrastructure whenever possible, especially for stations. Mined stations can be cost-effective but only in very hard rock or in extremely sensitive archeological environments, and large-diameter bores are only viable if all platform infrastructure can be put inside the bore and if the line has to weave around many older city center subways. To support this, the stations should be built as shallowly as possible based on surrounding infrastructure and, if the tunnels between them are bored, the minimum bore depth.
- Build simple station boxes, with little more space than is required for passenger circulation. If employee space is required, it should be placed around circulation space, on spare platform width, or above ground, rather than in dedicated spaces that increase dig volumes.
3. The Boston Case
The Story of the Green Line Extension
3.1 Why the Green Line Extension?
Boston and its Green Line Extension (GLX) project form the first of six case studies that we are tackling in order to understand how one can build public transportation more efficiently and less expensively. When choosing cases, we looked for a number of different variables to avoid drawing general conclusions from sui generis examples. These included the following:
-
- For the first American case, we wanted to avoid New York. The reason is that while American costs are generally high, New York’s are uniquely high, and therefore it is likely New York has an unusual set of failures not seen elsewhere in the country.
- Capital construction costs in Massachusetts have exploded over the last 40 years. While there hasn’t been any expansion of the existing network since the 1980s, we see in Table 1 that even after adjusting for inflation, GLX is only 6% cheaper per kilometer than the Red Line extension to Alewife, which is entirely underground and has deep, cavernous stations. The Orange Line project may be a better comparison because the majority of the project was at-grade, with a short tunnel under the Charles; GLX, without any tunneling, is more than twice as expensive per kilometer.
Table 1: Capital Expansion Projects in Massachusetts
| Capital Expansion Project | Start | End | Length in KM | Tunnel Percentage | Stations | Cost (in millions) | Real Cost (in millions) | Cost/KM (in millions) |
|---|---|---|---|---|---|---|---|---|
| Green Line Extension | 2012 | 2021 | 7.6 | 0 | 7 | $2,289 | $2,289 | $301.2 |
| Red Line Extension to Alewife | 1978 | 1985 | 5.1 | 1 | 4 | $574 | $1,641.7 | $321.9 |
| Orange Line Haymarket North | 1966 | 1977 | 8.6 | 0.14 | 6 | $180 | $1,155.6 | $134.4 |
-
-
- We need excellent quantitative data in order to be able to see if there is a specific thing that went wrong. There is fairly uniform data reporting throughout the United States, but certain public-private partnerships like that of the Maryland Purple Line make it hard to disaggregate data.
- We need excellent qualitative data, that is, access to many different experts and practitioners who could help us understand what is going on. For idiosyncratic reasons, we have better access to such sources in Boston than in the rest of the United States, save New York and California.
- The history of GLX is dramatic: as we explain in more detail below, planning activities for GLX began in 2004 and continued through 2012. It underwent a cost explosion, and, in 2015, it was threatened with cancellation before it was rebooted with a new design, budget, and project delivery, leaving nearly $700 million of the old project’s budget as a sunk cost. Each of these periods in GLX’s story provide an opportunity to assess why costs diverged from expectations and how the MBTA salvaged GLX. Lessons learned here will provide avenues of inquiry as we pursue future cases.
-
3.2 Project Timeline
The idea of extending grade-separated rapid transit from Boston north to Cambridge, Somerville, and Medford has been discussed since the 1920s. Studies in the 1940s, 1960s, 1970s, and 1980s all kept the idea alive, but the most recent iteration of the Green Line Extension (GLX) dates back to 1991 and the Central Artery/Tunnel Project highway project, also known as the Big Dig. In an effort to mitigate the negative air quality impacts of the Big Dig, Governor Michael Dukakis committed to several transit projects, including completing GLX by 2011, in order to comply with the Clean Air Act.[1]
While GLX has been in the pipeline for the last 30 years, changes in political administration, from Governor Michael Dukakis to Governors William Weld, Paul Cellucci, and Jane Swift, none of whom demonstrated any interest in expanding the existing transit network, have delayed its arrival. Without a champion in the governor’s office pushing the project forward, other advocates took up its mantle. During Mitt Romney’s tenure as governor, from 2003 to 2007, GLX did have the support of super-secretary Doug Foy, who, before joining the Romney administration, worked alongside the advocates pushing the Commonwealth to build GLX and honor its other transit commitments. In 2005, the second to last full year of Governor Romney’s term, the Commonwealth, compelled by threat of legal action for being in noncompliance with the Clean Air Act, recommitted to opening up new Green Line service by December 31, 2014. In order to move the project along and avoid losing federal funding for roads and transit, the Massachusetts Bay Transportation Authority (MBTA) hired Vanesse Hangen Brustlin (VHB) to conduct an Alternatives Analysis to determine how best to serve the proposed corridor through Cambridge, Somerville, and Medford, which was published in 2005.
With the election of Deval Patrick as governor in 2006, the project did move forward—at least on paper. After completing the Alternatives Analysis and selecting a two-branch expansion of the Green Line as the preferred alternative, the Executive Office of Transportation & Public Works (renamed as the Massachusetts Department of Transportation (MassDOT) in 2009) took the lead on planning the project with support from VHB. Between 2007 and 2009, MassDOT convened a Green Line Extension Advisory Group, made up of representatives from civic groups, advocates, and appointees from Cambridge, Somerville, and Medford. The Advisory Group worked with the state to refine alignment, select stations, and, in the words of Chair Steven Woelfel, to “make the project work for everyone” (Executive Office of Transportation and Public Works 2007).
It was also in 2006 that the MBTA entered into a Settlement Agreement with the Boston Center for Living, a non-profit organization that provides services to people with disabilities, to make the MBTA’s network accessible to all users. While the agreement only required adding elevators at existing stations in the network, such as Park Street and Downtown Crossing, those working on GLX decided to apply the agreement to their new stations as well, designing stations with redundant elevators, escalators, full enclosures, and fare arrays rather than a platform with a partial weather shelter, as was initially planned. In the “Beyond Lechmere Northwest Corridor Study” (2005), which contains the first conceptual cost estimate of GLX, it was estimated that these original no-frill stations, on average, would cost $535,000.
In 2007, the Executive Office of Transportation & Public Works and the MBTA submitted a New Starts Initiation Package to the Federal Transit Administration (FTA), which indicated that the Patrick administration intended to apply for federal funding to help pay for GLX. While the letter accompanying the initiation package stated that “the Commonwealth anticipates making an application to the FTA for entry into the Section 5309 New Starts process during calendar year 2008,” the actual submittal occurred at the end of 2011 (Stern 2007).
In the intervening period between 2007 and the end of 2011, the primary project management responsibilities shifted from MassDOT to the MBTA. The MBTA hired a joint venture from HDR and Gilbane (HDR/Gilbane) to manage the project, advance the design, and draft project delivery documents. VHB, a newly hired HDR/Gilbane team, and the MBTA moved the project through a number of regulatory hurdles, including a state-mandated Environmental Impact Report and an FTA-required Independent Risk Assessment.
As these steps were completed, a detailed project scope and cost estimate for GLX emerged.[2] In February of 2012, the plan for GLX was to thread 6.94 kilometers of track along two exclusive at-grade existing commuter rail rights-of-way, relocate an additional 6.44 kilometers of commuter rail track, widen the existing trench so that both the commuter rail and light rail tracks could comfortably fit, construct six new stations, relocate the existing Lechmere Station, erect four multi-span viaducts, reconstruct 11 bridges, build two new bridges, purchase power and train control systems, order 24 light-rail vehicles, install 21,000 square meters of retaining walls and noise walls, add a vehicle maintenance facility with test tracks and a transportation building, and acquire all of the necessary real estate to complete the project.[3] In 2012, the total project cost estimate, excluding finance charges, totaled $1.12 billion.
During the planning and design phase of a capital project, design and engineering advances from a general idea, such as an alignment along a specific corridor with a broad idea of station design and amenities, to a detailed final design that specifies quantities of materials and systems details. At the earliest stages of design, such as conceptual design or 10% design, cost estimates include large contingencies to account for inevitable changes. As a design approaches 100%, the contingencies decline as the details and project scope are finalized. GLX’s $1.12 billion estimate was based on an early stage, 10% design. Thus, many of the cost categories, such as stations, stops, terminals, intermodal and guideway and track element were assigned a 25% contingency to account for uncertainty. Additionally, the entire estimate had an additional unallocated contingency of 7%, which amounted to $80,474,000.
While the MBTA waited for the FTA to approve its submission to the New Starts grant program, the MBTA and its consultants bid out the first package of work for GLX. Massachusetts fully funded this initial contract, and it followed a traditional Design-Bid-Build procurement: HDR/Gilbane designed the project, and the MBTA and HDR/Gilbane team reviewed nine bids and selected Barletta Heavy Division. Their low bid was $12,989,300 to widen and reconstruct the Harvard and Medford Street railroad bridges, make roadway and drainage improvements, and demolish an MBTA-owned property in Cambridge that would serve as staging area for future construction. At the groundbreaking in December of 2012, United States Representative Michael Capuano, one of the few consistent GLX cheerleaders, underscored the urgency of getting GLX moving, saying, “We need to get as much of this project done and committed in an irrevocable way before [Governor Patrick] leaves office” (Jencks 2012). Capuano’s desire to move GLX out of the ethereal realm of studies and artistic renderings and into the tangible world of concrete and steel stemmed from his concern, based on previous administrations’ disinterest in GLX, that the project could be delayed or cancelled at any moment.
In principle the first package of work affirmed Massachusetts’ commitment to GLX with or without federal funding. In July of 2012, the FTA issued a Finding of No Significant Impact for GLX, which allowed GLX to be considered for a New Starts grant. In trying to expedite construction and keep GLX moving forward before the end of Governor Patrick’s term in January of 2015, the HDR/Gilbane team proposed that the MBTA pursue a Construction Manager/General Contractor (CM/GC) project delivery strategy.[4] The agency opted for CM/GC because as HDR/Gilbane did more design work, it discovered unknowns and uncertainty, which is common, but also because, with a tight deadline to finalize a Full Funding Grant Agreement (FFGA) with the FTA and without all of the specifications identified in advance, incoming bids would be much higher in a Design-Build than in a CM/GC, which allows for joint exploration of the project and holds the winning bidder to a fixed markup rather than a fixed cost at the outset.
Under CM/GC, the MBTA contracted with a Program Manager/Construction Manager (PM/CM), the HDR/Gilbane team, to manage the design and construction of the project. Separately, the MBTA hired a design consultant, a joint venture between AECOM and HNTB, to advance the HDR/Gilbane design from the 30% level to final design and estimate all of the different elements needed for construction. Finally, the MBTA selected a Construction Manager/General Contractor (CM/GC), a joint venture between J.F. White, Kiewit, and Skanska, to build the project.[5] The CM/GC was brought on board prior to finalizing GLX’s design so that the MBTA and its consultants could benefit from “preconstruction advice during the advanced preliminary and final design phases…concerning constructability, pricing, scheduling, staging, methods, efficiency, material procurement strategies, risk identification/management, and other areas related to the construction of the project” (Massachusetts Bay Transportation Authority 2012, p.1).[6] The MBTA and HDR/Gilbane argued that CM/GC’s appeal stemmed from its ability to tap contractors’ specific knowledge to establish a final contract price before approving a final design. CM/GC is less rigidly sequential than Design-Bid-Build. When assessing these types of projects, the FTA is less concerned about a project being in the final design stage and more interested in seeing that the local financing is in place and that a list of standard items has been identified before approving an FFGA. We were told by someone with decades of experience with CM/GC that “items, such as bridges, retaining walls, and train control systems were left in preliminary design with the idea that the [CM/GC] would be able to use its means, methods, and materials that meet the specifications of the program and played to their expertise” (Interview B 2020). Thus, CM/GC could get to an FFGA more quickly than a standard Design-Bid-Build, because there was an understanding that the CM/GC’s input would change the design, even if the overall objectives remained the same.
While the MBTA had never used CM/GC before GLX, its program management consultant, HDR/Gilbane, had experience with a variant of CM/GC, known as Construction Manager at Risk in vertical building projects. Based on its experience with this alternative project delivery method and the legacy of cost overruns and delays in transit projects, including the MBTA’s recent Greenbush commuter rail project, HDR/Gilbane believed it could deliver an on time, on budget GLX by using CM/GC rather than Design-Bid-Build or Design-Build. CM/GC, while uncommon in Massachusetts transit construction, does have a track record in the United States. In an interview with the former head of capital construction at a transit agency on the West Coast who used CM/GC routinely, he told us that, “When [CM/GC] works well, it is us [the agency and all of the contractors] against the project” (Interview C 2020). Design-Bid-Build, by contrast, he described as extremely confrontational and riven with bitterness because each contractor tries to protect its liability and offload risk onto the agency or subcontractors. Design-Build, on the other hand, is designed to keep the agency out of the design and construction work, which is a level of control that many agencies want to retain.
Without passing judgement on CM/GC, it is instructive to simply follow the reported FTA cost estimates for GLX as it worked its way through the FTA New Starts approval process.[7] According to the FTA’s 2013 “Annual Report on Funding Recommendations: Fiscal Year 2014, Capital Investment Grant Program,” GLX’s total estimated project cost was $1.1158 billion. One year later, the FTA reported that the total project cost increased to $1.4288 billion. In 2015, the FTA approved GLX for a Full Funding Grant Agreement (FFGA), even though the total project cost had increased again: that year the MBTA reported that its projected cost was $1.992 billion, and that it sought $996 million from the FTA.[8] In the span of three years, GLX’s projected costs increased by nearly a billion dollars, or 79%. Massachusetts Secretary of Transportation Richard Davey explained that changes to the project’s scope, which now officially included a continuous pedestrian and bike path running alongside GLX, known as the Community Path; greater costs associated with building a new viaduct connecting GLX to the one-hundred-year-old Lechmere viaduct; and a 30% contingency explained the cost increase. Even with these additions, Davey exuded confidence when he told the media that the project would be on time and under budget: “I’m thinking it will be more along the lines of $1.6 billion” (Metzger 2014).
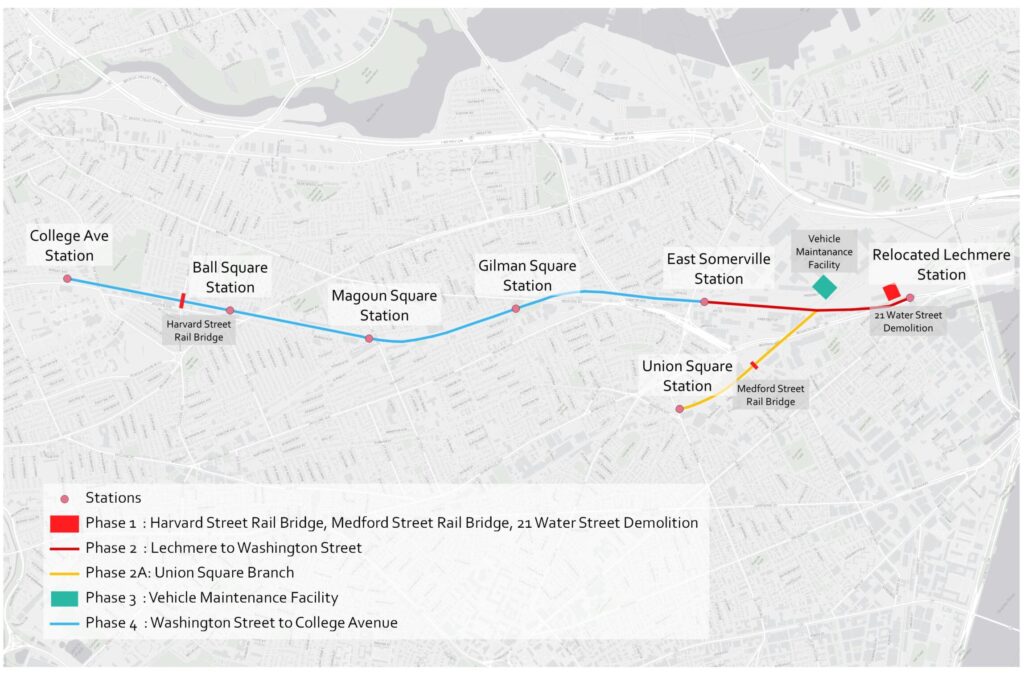
figure 1. GLX alignment and phase map adapted from Green Line Extension Project presentation 2/27/2012
2015 should have been a moment of triumph for the GLX team. Even though Governor Patrick left office in January, that same month, the FTA agreed to contribute $996 million of the $1.992 billion project. While the project was still years from completion, this was, seemingly, the “irrevocable” commitment, to borrow a phrase from Representative Capuano, that assured GLX’s future.
During 2013 and 2014, however, it was clear that internal cost estimates from the PM/CM, HDR/Gilbane, and the CM/GC, the trio of J.F. White, Kiewit, and Skanska, were growing further apart, and that the five approved contracts were outpacing the projected costs underlying the FFGA and eating into the project’s contingency. While negotiating the sixth GLX contract, in August of 2015, the CM/GC cost estimate for 100% design came in at more than double the projected amount. At this point, it appeared that GLX would likely require $3 billion to complete. Rather than pushing ahead and accepting the higher costs, the MBTA suspended negotiations with the CM/GC, and, in December of 2015, the newly created Financial Management and Control Board (FMCB) resolved that unless the project’s costs could be reined in, it would cancel the project (Massachusetts Department of Transportation 2015).
Cancelling this version of GLX was an easy decision to make for several reasons. First, 2015 was an unusually challenging year for the MBTA. Beyond GLX’s steady budget creep, multiple snowstorms paralyzed the system, which led to a litany of operating nightmares, namely major service disruptions—including day-long outages and severe delays. As this drama was unfolding, Beverly Scott, the MBTA’s general manager, resigned. In the aftermath of the winter of 2015, the recently inaugurated Governor Charlie Baker convened a special panel to examine the agency’s finances, operations, and general health. This added scrutiny brought to light a number of problems within the agency, such as a $7 billion backlog in State of Good Repair projects. In this environment, spending more money on GLX was untenable, despite nearly $700 million in sunk costs.
Second, observers of GLX believed the project could be value engineered to deliver the core promise of GLX for the initial price tag. As one agency insider told us, “We took the view that this project has to get done…[and] there was no doubt we could do better” (Interview D 2020). In 2016, in an effort to do better, the MBTA hired Weston & Sampson, an engineering firm based in Massachusetts to take a fresh look at the project and see where it could reduce costs without jeopardizing the goals of GLX. The interim team brought down costs by paring back the largest cost centers, namely stations, bridges, the vehicle maintenance facility, and the quantity of retaining walls required. By the close of 2016, the MBTA hired John Dalton, an experienced capital construction manager who had worked in the public and private sectors, and managed projects in Dubai and Chicago, to manage the GLX reboot and build a capital construction team within the agency. By 2018, there were 83 full-time employees working on GLX. During the first iteration of GLX, as a point of comparison, it was reported that only four to six full-time MBTA employees managed the multibillion-dollar project.
In 2017, GLX Constructors, a joint venture led by Fluor was selected to build GLX by December of 2021. This time, GLX will be delivered via a Design-Build contract. The final estimated project cost is $2.3 billion, but GLX Constructors received a $954 million construction contract with an additional $127.5 million in contingency controlled by the MBTA.
3.3 Our Findings
Over the course of 45 interviews conducted over Zoom or the phone, hundreds of emails and text messages, and a review of relevant project-specific documents and media reports, we identified three core areas to help explain the trajectory of GLX.[9]
First, as GLX worked its way through the planning pipeline, it was passed back and forth from the MBTA to MassDOT and back to the MBTA. Staff at both agencies didn’t always agree or appreciate input from the other. In particular, we were told in three separate interviews that the MBTA, the transit experts, disengaged from the project as MassDOT took a greater role in its planning. MBTA staffers bristled as MassDOT planners with no experience planning or operating a transit system took charge and established GLX’s conceptual design and scope.
Despite objections from the MBTA’s staff about MassDOT planners’ involvement in GLX, the MBTA also lacked the expertise and experience to manage a multibillion-dollar subway or light rail project. From the 1960s to the 1980s, the MBTA developed its ability to plan and manage the construction of large-scale capital construction projects. With the election of William Weld as governor in 1990 that changed. Weld came to power with a mandate to slash the Commonwealth’s payroll by $1 billion and shed thousands of public employees. Under the supervision of his budget director Charlie Baker, Massachusetts cancelled transit expansion plans and contracted out functions that were previously done by the public sector. By 2005, on a day-to-day level, the MBTA no longer had the capacity to manage megaprojects like GLX because the most experienced construction managers had left the agency or retired decades earlier.
Even when planning and management responsibilities for GLX returned to the MBTA, MBTA staff committed the cardinal sin of expanding the budget and scope by calling for bigger and more expensive additions, such as the 8,733-square-meter vehicle maintenance facility, which was estimated to cost $195.5 million. As GLX design advanced and the project moved toward an FFGA, the MBTA hired HDR/Gilbane to manage the project. Internally there were only six MBTA staffers managing the project on a full-time basis, but HDR/Gilbane served as an extension of the MBTA and managed the project for the agency. Without the capacity to manage the project itself, the MBTA and MassDOT spent $212.99 million dollars on professional services to carry out this work. Even with the help of outside consultants, the agency struggled to stay on top of the volume of requests for information and requirements that accompanied a nearly $2 billion project. When GLX was redesigned and restarted, the MBTA hired more staff internally to manage the project, a sea change from the previous version of the project.
Second, the managers of GLX did little to discipline the budget. Thus, ideas from stakeholders were added to the project scope or studied even if impractical. In the early stages of planning, public members insisted that the consultant, VHB, study the feasibility of tunneling GLX. While there is nothing wrong with this suggestion on its face, as minimizing property takings and nuisance mitigation are valid concerns, an informed professional committed to keeping costs down should have immediately explained that, as GLX is a light rail extension operating in an existing right-of-way with active commuter rail, building a tunnel would be costly and redundant. After months of study, this is exactly what the consultant found. In reading through the studies of GLX, we see that the design and cost estimates of stations also changed dramatically in the span of five years. In 2005, stations were designed to be unstaffed, unembellished, and easy to construct. By 2010, the concept for GLX’s stations changed: “The design for each station is envisioned to provide a headhouse with automated fare lines, vending machines, an information booth, and restrooms. Entry to and exit from the platforms would be by elevators, escalators, and stairs” (Final Environmental Impact Report 2010).
Third, the more we spoke to people, the more we understood what was meant by the common refrain that “the politics of GLX are tricky” (Interview E, 2020). Because of the long delay of getting GLX built, the residents and elected officials from Somerville, Medford, and Cambridge were tired of being told to wait. Adding insult to injury, GLX, as proposed in the Final Environmental Analysis, wasn’t what had been promised in the “Beyond Lechmere” analysis. Instead of going to the Mystic Valley Parkway, GLX terminated at Tufts University/College Avenue, with the hope of extending it farther north in the future. The public aired its discontent at public meeting after public meeting. While people still supported GLX, they wanted more. The Community Path, a multi-use bicycle and pedestrian path, was a popular addition to GLX that was sold to the FTA as a station accessibility improvement, since none of the new stations along the Path would have automobile parking. In principle, the Path was a win-win: residents of Somerville got an extension of a grade-separated bicycle and pedestrian path that they had been trying to get built since at least 2001, and the MBTA and MassDOT built the community an amenity it wanted. In practice, the Community Path added costs to GLX and created tension between the Interim Project Management Team and the public as the Interim team tried to salvage GLX by scaling back the Path.
Even though we treat these three elements—project management and delivery, expensive design, and politics—as distinct subsections below, they overlap and interact in obvious ways.
Managing the Managers: Project Management and Delivery
From our interviews and a review of GLX-related documents, the combination of GLX’s moving deadline (first 2011, then 2014, 2015, 2019, and, now, 2021), the perception that capital construction projects in Massachusetts needed new delivery mechanisms to keep them on time and on budget, and the desire to get FTA money led to the adoption of a poorly calibrated version of CM/GC rather than the preferred Design-Build or the more traditional Design-Bid-Build. Even though the court-mandated deadlines for GLX continued to slip and the Commonwealth had been granted the flexibility to swap projects in and out of its State Implementation Plans (SIP) to achieve clean air compliance, the December 2014 deadline for opening GLX created an urgent need to get the project built. Furthermore, December 2014 marked the final full month of Governor Patrick’s second term in office, which, according to one senior person we interviewed meant that “figuring out how to get the FFGA done before 2014, meant not figuring out the project” (Interview D 2020).
Fundamentally, MBTA oversight was understaffed and stretched thin. Different experts that we interviewed who were involved with different aspects of the project put the number of in-house MBTA design review engineers at either five or six. With at most six people supervising the GLX project, little oversight was possible, leading to bottlenecks in signing off on orders and contracts. When GLX was finally rebooted in 2017, the MBTA addressed this deficiency by building a capital construction team with more than 100 MBTA staff. One senior person involved with the current GLX project told us “I would rather be overstaffed than understaffed” (Interview F 2020).
In an interview with someone who has worked in multiple transit agencies in the United States and abroad, we were told that the benefits of internal staffing and capacity extend to the operating side of the agency, too. (Interview, 2017) contrasted London’s overstaffed, right-hand-does-not-talk-to-left schedule planning favorably with New York’s understaffed planning—and indeed, London’s unit operating costs (Transport for London 2016) are about two-thirds those of New York (Federal Transit Administration N.D.).
Hiring more in-house planners is a challenge. Public-sector wages for office workers are not competitive. A project manager for capital construction at the MBTA earns $106,000 a year in base salary; the equivalent in the private sector in Boston is $140,000 in transportation, and more in other industries such as tech. An official with the MBTA office workers’ union, the Local 453, gave a number of additional examples: a director of asset management at the MBTA earns $120,000 per year, although similar positions in New York and Chicago pay $180,000–200,000; a climate resilience specialist took a $20,000 pay cut to come work for the MBTA; the MBTA’s energy efficiency manager earns $85,000 and could make twice as much in the private sector (according to the official, the manager is only staying to put in the number of years required to earn a full pension when they retire).
The current GLX project has to some extent fixed this, by hiring outside consultants as well as in-house supervisors, generally at a competitive wage. However, the competitive pay is restricted to senior management. Junior planners still earn well below market rate. There is fiscally conservative reticence to expand government spending in the long run, especially in light of stories in the Boston Globe shaming workers who, through overtime, earn atypically large wages, leaving the impression that those wages are common for the public sector (Rocheleau 2020).
But regardless of what the current GLX project does, it is clear that the original GLX project did not attempt to expand the MBTA’s institutional capacity to manage such a program. Decisions were made slowly, and there was much desire to limit risk. In contrast with transit agencies in Madrid or Istanbul, the MBTA was trying to limit its own risk. One contractor we spoke to complained of red tape that made contracting less flexible, saying “the T factor” or “the MTA factor” raised costs by about 10% (Interview G 2020). Despite this inflexibility, the MBTA wanted the contractor to take more risk, which the interview subject said just meant the contractor would find ways to mitigate their risk by charging extra if it ended up taking on additional costs.
This arrangement contrasts with Public-Private Partnership (PPP) structures in low-cost countries, which aim to minimize risk to the private contractor. Seoul, for example, built Line 9 cheaply using this type of partnership: rather than shifting the highest risk elements to the private sector, the PPP was designed so that the private sector would do the low-risk parts of the line, such as the tracks and systems.
We see the results of diminished internal capacity at the MBTA throughout the project. Even though public meetings started back in 2004 and the outline of a plan emerged in 2005, no one at the agency took ownership of the project and shepherded it to completion. Instead, planning and design moved from department to department, knocking off one requirement at a time, such as the Alternatives Analysis and the state-mandated Environmental Impact Report (EIR). This meant that even after six years, the project hadn’t moved out of the conceptual design stage.
In 2011, the MBTA hired HDR/Gilbane to draft a Design-Build procurement for GLX based on the design work VHB had done. As HDR/Gilbane did its due diligence, it realized there were still a number of unknowns, such as how to manage the elevated track work where the two branches of GLX converge by Lechmere Station, or how to address drainage problems in Somerville, and it determined that it would need to conduct its own studies rather than building on the existing work from VHB. With the agency short on time, spending more time studying the details of the project meant that it couldn’t reasonably pursue its preferred Design-Build procurement, because it still didn’t know what needed to be specified in the contract. Faced with uncertainty and a tight deadline, the MBTA and HDR/Gilbane latched on to the idea of building GLX using CM/GC, a project delivery mechanism that would allow them to hire a construction manager to provide input on the design, schedule, and costs. Once design was finalized, the construction manager would shift to the role of general contractor and build the project. Thus, the MBTA could hire the CM/GC before final design, which under a Design-Bid-Build procurement could take several additional years.
CM/GC is an integrated planning, design, and construction method. In principle this means that as the design develops, the CM/GC provides input on constructability, value engineering, scheduling, and costs. Proponents of CM/GC argue that this collaboration between designers, PM/CM, and the CM/GC, all of whom contract with the agency separately, leads to CM/GC-vetted designs, predictable schedules, and greater cost certainty, all of which is meant to limit agency risk while allowing for the designers and CM/GC to innovate. As designs develop under CM/GC, say from 60% design to 90%, the CM/GC and an Independent Cost Estimator (ICE) provide cost estimates for the project based on a shared project scope and unit of quantities.
In the case of GLX, the MBTA selected a CM/GC project delivery, but made four critical errors drafting and implementing the agreement. Each of these flaws on their own created conflicts, but in combination they ramified through the project and brought it to collapse in 2015.
First, the MBTA failed to require open-book accounting, which allowed the CM/GC to price its work without meaningful oversight from the MBTA or the ICE. With limited ability to decompose CM/GC cost estimates, it was difficult to check the assumptions of the CM/GC’s pricing.
Second, the MBTA hired the CM/GC too late—only after the design team had advanced the design from 30% to 60%. This sequencing meant that the CM/GC had zero input in this first phase of design work. In an interview with someone familiar with this stage of the project, we were told that the “whole philosophy [of CM/GC] is to get input from the contractor” (Interview H 2020). Thus, by starting the more advanced stages of design without CM/GC feedback, the design was not tailored to the CM/GC’s strengths and there was less time for the CM/GC to innovate. As one source who has worked on dozens of CM/GC projects explained, “In CM/GC versus [Design-Bid-Build], the GC has the time to figure out a better way to build the mouse trap” (Interview G 2020).
Third, even though the MBTA had a CM/GC handbook that explained what to do when cost estimates from the CM/GC eclipsed the ICE’s by more than 10%, the MBTA failed to manage these moments of conflict effectively until five contracts into the project. Rather than taking the final design and bidding it out via a Design-Bid-Build contract, it instead instructed the ICE and CM/GC to continue working on the bids until the CM/GC’s estimate was within 110% of the ICE’s estimate.[10]
And fourth, the MBTA’s management capacity, which was spread thin, limited its ability to intervene constructively when the PM/CM and CM/GC failed to agree on costs. The MBTA was also slow to respond to inquiries from the CM/GC and designers on issues like what systems would be installed in the stations, such as the CCTV or communications specifications. Without clear guidance from the agency, the CM/GC priced these elements higher than normal to avoid the risk of taking on greater costs when the agency finally made a decision.
* * *
Let’s take a closer look at how the lack of open-book accounting and the inability to hold the CM/GC to the 110% of ICE estimates interacted with and led to much higher than anticipated costs. Thanks to the “BRG Look Back Study” (2015) prepared by the Berkeley Research Group, we have a clear accounting of the summaries of the cost estimates for some portions of the project, referred to as Interim Guaranteed Maximum Price (IGMP) and Guaranteed Maximum Price (GMP). In a CM/GC, it is traditional to prepare multiple IGMPs through the preconstruction and design phase so that the agency and its program manager can track price throughout the design process and revise budgets and total project cost estimates prior to finalizing design. In this section of the case study, we take a closer look at IGMP 3 and IGMP 4.
Once the design reaches the 100% phase, final design, the CM/GC submits its final estimate, and if it falls within 110% of the ICE’s estimate, it becomes the GMP. The GMP, which takes effect before construction, serves as a cap on final costs. This provides certainty to the agency and shifts risk from the agency to the CM/GC. If things do not go according to plan, the CM/GC is supposed to take on the added costs. In the case of GLX, rather than having one GMP, the project was broken up into multiple contracts. One of the people we interviewed with extensive knowledge of project delivery in Massachusetts told us that this was another fatal flaw, because it made it difficult to hold the CM/GC accountable if its costs outpaced ICE estimates, and it allowed the CM/GC to recalibrate bids as construction progressed (Interview I, 2020). However, it is common for transit projects delivered with CM/GC to include multiple IGMPs. The broader issue with this version of CM/GC was the MBTA’s implementation of its own CM/GC guidelines. The MBTA proved unwilling to push back on the CM/GC and bid out the final designs using Design-Bid-Build even if it meant slowing down the project. In fairness to the MBTA, at this phase of the project, little construction had been completed, and internal staff believed that, over time, the CM/GC estimates would become more reasonable.
The scope of IGMP 3 included relocating commuter rail track; making significant drainage improvements under the Washington Street bridge, including installing new pump stations and larger-diameter pipes; and drilling viaduct shafts. The estimate for this phase of work, which was the basis of the FFGA, totaled $63 million. Disaggregated slightly, direct costs equaled $50.4 million, indirect costs $10 million, and the fee $2.6 million (Table 2).[11] At the 90% stage of design, the CM/GC estimated its direct costs of construction at $69,763,112. So before reaching final design, the CM/GC submitted a bid 10% greater than the FFGA estimate without accounting for indirect costs, estimated at 20% of direct costs in the FFGA, or the CM/GC’s 4.25% fee. At first glance, this seems like an obvious red flag, especially given that it was significantly higher that the PM/CM’s estimate, $34,695,229, and the ICE’s estimate, $35,832,193. We were told, however, that despite the name, sometimes 90% design doesn’t mean all facets of the design are 90% complete. In this particular phase of work, the drainage component was a bigger risk and required more monitoring and mitigation than initially anticipated, so perhaps the CM/GC was being excessively conservative.
Table 2
| FFGA Estimate GMP 3 | |
|---|---|
| Direct Costs | $50,400,000 |
| Indirect Costs | $10,000,000 |
| Fee | $2,600,000 |
| TOTAL | $63,000,000 |
Once design was finalized, all three (CM/GM, PM/CM, and ICE) submitted a new round of estimates (Table 3). This time, the PM/CM estimated $49,257,908 for the direct costs plus the CM/GC’s contractually agreed to 4.25% fee. While the PM/CM did raise its estimate, the CM/GC increased its estimate, too. At this stage of the bid submission cycle, also known as the drop, the CM/GC hit the high watermark of $101,865,073. Again, the two sides were as far apart as could be, which fueled discord between them. The ICE’s estimate for the first drop grew to $70,753,609. Since the CM/GC estimate was greater than 110% of the ICE’s, the MBTA asked the two sides to resubmit bids. Since the PM/CM and CM/GC were more than 100% apart from the PM/CM’s estimate, and the relationship was already strained, the MBTA asked the PM/CM to stop participating in subsequent bids because the enmity between the two had become unproductive. One person we interviewed who participated in this stage of the project told us that “it was getting to the point where the [CM/GC] couldn’t be in the same room as the [PM/CM] (Interview H 2020).” Another person we interviewed with knowledge of this round of drops told us that in order to carry out the estimate reconciliation process, the ICE met with the PM/CM and CM/GC separately in order to avoid confrontations.
Table 3
| 90% Design Direct Costs | 100% Design #1 Direct Costs + Fees | |
|---|---|---|
| PM/CM Estimate | $34,695,229 | $49,257,908 |
| ICE Estimate | $35,832,193 | $70,753,609 |
| CM/GC Estimate | $69,763,112 | $101,865,073 |
After four more drops, which are detailed in Table 4, the two sides finally reconciled at a direct cost plus fee price of $88,704,746. When the indirect costs were added to this phase of work, the final contract came to $116,635,126. Looking back at the estimate included in the FFGA documentation, this final price was 85% greater than the estimated $63 million. Part of the problem with the initial estimate, we were told, is that once the CM/GC put the drainage work out to bid, even the lowest estimate from subcontractors put the total price tag of the work above the direct cost estimate prepared by the PM/CM. Additionally, the CM/GC’s indirect costs, which we were told “were off the charts” (Interview J 2020), were so much higher than anticipated because the CM/GC wanted to bring on more staff in preparation for the next phase of work, GMP 4. By bringing on more staff now, it argued, it would be able to move more quickly through the next phases of the project, which would save money. Despite this line of reasoning, as we will see next, indirect costs broke even higher off of the charts in the next phase of work.
Table 4
| 100% Design #2 Direct Costs + Fees | 100% Design #3 Direct Costs + Fees | |
|---|---|---|
| PM/CM Estimate | N/A | N/A |
| ICE Estimate | $80,914,140 | $79,744,911 |
| CM/GC Estimate | $90,732,868 | $84,940,606 |
| 100% Design #4 Direct Costs + Fees | 100% Design #5 Direct Costs + Fees | |
| PM/CM Estimate | N/A | N/A |
| ICE Estimate | $83,411,507 | $83,615,247 |
| CM/GC Estimate | $88,954,854 | $88,704,746 |
| Indirect Costs | $27,930,380 | |
| FINAL CONTRACT | $116,635,126 |
While market conditions certainly played a role in the cost escalation, the lack of open-book accounting allowed the CM/GC to price work without the pressure of detailing its true costs and verifying that its profit was capped at 4.25%. Furthermore, since the PM/CM developed the initial cost estimates, it was defensive when both the CM/GC and the ICE ended up exceeding its estimates from the FFGA.[12] In a few instances, during the negotiations, we were told, the CM/GC did provide quotes from subcontractors showing that the cost of drainage elements for the project exceeded the PM/CM cost estimate. Open-book accounting would have clarified the CM/GC’s assumptions, but the PM/CM needed to recognize that its estimates were also flawed, especially when faced with concrete evidence. Without more transparency, the PM/CM assumed the problem was the CM/GC rather than its own estimates.
This issue of flawed cost estimation is a much deeper problem that relates to the process of how the federal government reimburses project costs and the rush to get an FFGA. Because costs incurred on a project do not qualify for reimbursement until the preliminary engineering stage, agencies want to spend as little money as possible to get to preliminary engineering. Thus, consultants work up cost estimates by taking historical data from “similar projects” and adding an escalation rate. This back-of-the-envelope approach is reasonable at the outset, as decision-makers think about pursuing different projects. But, as we were told by cost estimators, risk assessors, and project leaders from consultancies, the cost estimation of a project that has been selected from an Alternatives Analysis needs to be based on the specific conditions of the project, and that takes time and money that no one wants to spend. Where historical data is valuable, we were told, is in estimating quantities required to build a viaduct or drill a shaft. From there, however, a good estimator will take into account market prices for materials and labor rather than applying an escalation rate to old data. Whether or not this kind of upfront investment would mitigate uncertainty is hard to know, but it is certainly something to investigate across cases.
As worrisome as this round of drops was, things only deteriorated as the PM/CM, ICE, and CM/GC submitted estimates for the largest contract to date, GMP 4, which included track work, retaining walls, three stations, viaduct work, and other key components of the overall program.
During GMP 4 negotiations, the MBTA put the project on hold to see if it was possible to salvage GLX within a budget it could afford. We were fortunate to access the cost estimates for GMP 4. We have reproduced a portion of the fourth and final drop in Table 5. Right away, we see that the CM/GC’s estimate is more than double the FFGA estimate of $387,588,371 (Tables 5 and 6). In fact, the CM/GC, PM/CM, and ICE all exceeded the FFGA estimate by at least 60%. The CM/GC’s total cost estimate was $869,214,343. The PM/CM estimate, unsurprisingly, was $250,000,000 less, at $619,009,838. The ICE’s estimate, after learning some of the logic of the CM/GC from the last round of negotiations, ended up at $732,810,425. Since the CM/GC’s estimate was more than 110% of the ICE’s, this contract was never finalized. After looking more closely at the line items in this estimate, we see vast discrepancies lie in the indirect costs estimated by the CM/GC.
Table 5
| GMP 4 100% Design | CM/GC | PM/CM | ICE | DELTA CM/GC vs. ICE |
|---|---|---|---|---|
| DIRECT COSTS | $572,375,396 | $460,714,878 | $534,598,952 | 0.0707 |
| Indirect Labor | $106,997,531 | $54,327,123 | $70,354,338 | 0.5208 |
| Indirect Expenses | $118,405,819 | $65,572,205 | $84,199,356 | 0.4063 |
| CM/GC Exposure Items | $36,000,000 | $13,160,219 | $13,783,013 | 1.6119 |
| INDIRECT COSTS | $261,403,350 | $133,059,547 | $168,336,707 | 0.5529 |
| FEES (fixed 4.25%) | $35,435,597 | $25,235,413 | $29,874,766 | 0.1861 |
| TOTAL COSTS | $869,214,343 | $619,009,838 | $732,810,425 | 0.1861 |
In negotiating GMP 4, the CM/GC estimated its indirect costs at $261,403,350. When we looked at the cost estimate for GMP 4, instead of finding line items broken out with hourly wages and quantities of materials, we found lump sums at the top of section headers, such as Indirect Labor, with no labor hours to accompany line items like Field Supervision, Engineering, or Construction Manager Staff.
What we do know is that the CM/GC believed that it would require 1,792,301 hours to complete the construction work of GMP 4 and an additional 995,820 hours to manage it. In our interviews with cost estimators, they said that the ratio of direct hours to indirect hours on large projects usually falls within a range of 2.5 to 3, that is, for every 2.5 or 3 craft laborers on the job there is also 1 supervisor or manager. In this GMP, the CM/GC proposed a ratio of 1.8, or 30% more indirect labor hours. If this GMP had followed convention, the number of indirect labor hours should have been closer to 700,000. Two people we interviewed who worked on the review of this phase of GLX specifically commented that there were two to three times more field supervisors on site than one would expect. The PM/CM, in stark contrast, estimated the indirect labor hours at 450,146 hours. The ICE, which had hewn closely to the CM/GC on the construction elements in the cost estimate, lost the thread when it concluded that GMP 4 would require 713,680 hours of indirect labor rather than the 995,820 proposed by the CM/GC.
When we compared the total indirect costs to the total direct costs, we found that the CM/GC’s indirect costs equaled 46% of direct costs. This is an extraordinary proportion. Throughout our study of GLX, we have seen indirect costs estimated at 20% of direct costs, as we saw in the estimate for GMP 3. The actual indirect cost percentage of GMP 3’s direct costs was 31%. In the FFGA estimate of GMP 4, the indirect costs estimate was 15% of $324,450,166 in direct costs. During negotiations for GMP 4, the ICE applied the same 31% from GMP 3, but still managed to miss the CM/GC’s indirect costs estimate by $93 million. In our interviews with cost estimators, capital construction veterans familiar with CM/GC, and transportation design and engineering consultants, some of whom worked on GLX, we were told that indirect costs usually fall within the 15–20% range of direct costs, but that in dense environments, such as Somerville, it was likely that those percentages could creep up to 30% because of the restrictive nature of work windows that limit the hours of construction and the difficulty of getting materials into and out of the construction site.
Clearly, CM/GC was not the silver bullet the MBTA believed it would be. Even after ten years of planning and multiple cost estimates, GLX still didn’t have a reliable budget as of 2015. The dull work of figuring out the best way to build the Green Line Extension and staffing up the project appropriately was stymied by the pressure of staying ahead of different court-ordered mandates to build GLX and a lack of leadership from different political administrations, and a race to win an FFGA.
Table 6: Contract Packages 1-7 for GLX
| CM/GC IGMP | Status | CM/GC | FFGA | Variance | % |
|---|---|---|---|---|---|
| 1 | Awarded | $32,235,006 | $22,528,833 | 9,706,173 | 0.4308 |
| 2 | Awarded | $18,042,718 | $12,452,060 | 5,590,658 | 0.449 |
| 3 | Awarded | $116,635,126 | $62,667,946 | 53,967,180 | 0.8612 |
| 4A | Awarded | $39,600,110 | $44,688,166 | -5,088,056 | -0.1139 |
| 4 | Cancelled | N/A | $387,588,371 | N/A | N/A |
| 5 | Cancelled | N/A | $391,816,547 | N/A | N/A |
| 6 + 7 | Cancelled | N/A | $143,252,063 | N/A | N/A |
Big, Expensive Everything: Stations
As GLX was falling apart because of the inability of the CM/GC and ICE to find a workable price for GMP 4, the MBTA hired a new group of consultants to make sense of why GLX’s budget exploded. Many of the people we interviewed explained that while the structural problems of CM/GC were the primary culprit, these problems manifested themselves in overly ambitious plans that did not fall within the GLX’s strict purview: to build amenity-packed stations, to re-engineer the existing trench to fit the commuter rail and GLX tracks, to integrate the multiuse pedestrian and bicycle Community Path, and to repair dilapidated overpasses and remedy decades-old drainage problems in Somerville.[13] Internally, the MBTA also pushed for a bigger vehicle maintenance facility and transportation building and personnel rooms in the new stations. One person we interviewed who was involved with the look back process and redesign of GLX explained that the project suffered from “pushing the yes button” (Interview K 2020): whenever a request was made to add an element, rather than managing the budget and sticking to the core goal of GLX, providing rapid transit service connecting Medford with Cambridge, the MBTA simply said yes.
The initial concept for GLX, as sketched out in the Beyond Lechmere Alternatives Analysis called for generic open-air stations with ramps to ensure ADA compliance. Through the planning process, these simple stations morphed into bespoke neighborhood icons with headhouses, redundant elevators, escalators, personnel rooms, fare arrays, larger footprints, and additional landscaping and street grading extending beyond the stations. One planner we interviewed who participated in the public forums on station design and the project admitted to us that “we could have been stronger at holding the line on some stuff” (Interview L, 2020). Another observer of GLX, who sympathized with the instinct to “push the yes button,” explained, “Just because someone asks for something and it’s a good idea doesn’t mean it’s possible” (Interview M, 2020). The Interim Project Management Team, which was responsible for getting GLX back within its initial budget, estimated the cost of GLX’s seven stations at $409,500,000, more than 100 times more expensive than the estimate in Beyond Lechmere.
By looking at a specific station and the CM/GC’s cost estimate, we see how costs scale with amenities and size. The proposed Union Square station, which we have included an image and cost estimate of below (Figure 2; Table 7), was designed to occupy 1,387 square meters. The CM/GC estimated that it would cost $39,926,449, or $28,786/square meter, to build. For this specific station, the largest cost centers were steel, electrical systems, concrete, and site construction, which includes things like foundations, landscaping and irrigation, and site improvements.[14] In addition to these external elements, the station included a headhouse, bicycle storage, an entryway, a lobby, a concourse, two elevators, two escalators, two bathrooms, an employee lounge, fare vending, fare arrays, canopies, and mechanical rooms for all of the different systems. While elevators and escalators are expensive on their own—about $2 million in total in this instance—these amenities also require additional area dedicated to mechanical rooms, which means more concrete, steel, and electrical work. The cost of electrical work, in particular, is stable over multiple footprints. Based on the estimate reproduced below for the three stations included in GMP 4, the range of costs for the electrical work is a tight band of $5,217–$5,597 per square meter. In other words, as station area increases, the costs of wiring and communications systems push total costs higher. The costs of elevators and escalators, on the other hand, relative to the overall station budget, reduces, so long as the design of bigger stations includes the same number of elevators and escalators as the smaller ones.
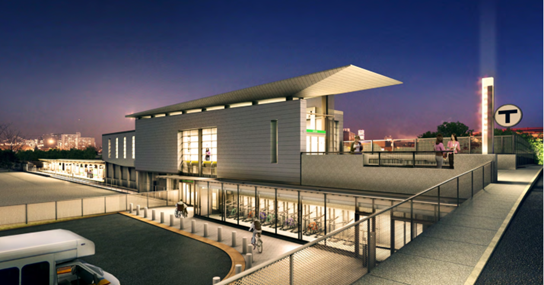
figure 2. Rendering of Proposed Union Square Station from 11/6/2014
Table 7: Union Square Station CMGC Cost Estimate
| Category | Estimate | % of Total |
|---|---|---|
| General Requirements | $1,773,593 | 0.0444 |
| Site Construction | $5,341,805 | 0.1338 |
| Concrete | $5,200,133 | 0.1302 |
| Masonry | $1,126,719 | 0.0282 |
| Metal | $8,446,352 | 0.2115 |
| Wood and Plastics | $120,050 | 0.003 |
| Thermal and Moisture Control | $3,138,236 | 0.0786 |
| Doors and Windows | $1,265,550 | 0.0317 |
| Finishes | $1,973,009 | 0.0494 |
| Specialties | $563,397 | 0.0141 |
| Furnishings | $26,381 | 0.0007 |
| Special Construction | $117,186 | 0.0029 |
| Conveying Equipment | $2,061,867 | 0.0516 |
| Mechanical | $1,508,253 | 0.0378 |
| Electrical | $7,263,918 | 0.1819 |
| Total | $39,926,449 | 1 |
As the Interim Project Management Team redesigned the project to get costs in line with the remaining budget, one of the first areas it attacked was the stations. The Interim design team slashed the estimated stations budget from $409.5 million to $121.2 million, or by 70%, by eliminating station amenities, namely iconic headhouses, personnel rooms, fare vending, escalators, and redundant elevators. By removing these items, the overall square footage of the seven stations shrunk by a staggering 9,959 square meters, or 91% of the previous plan. Based on our calculation of electrical work/square meter, we estimate that the bill for electrical work alone declined by more than $50 million. After GLX was redesigned, stations returned to their spartan origins: today’s stations will again be open air and have uniform materials, signage, and lighting so that there are both economies of scale when ordering materials and the same maintenance procedures at each station, which will reduce operating costs going forward (Figure 3).
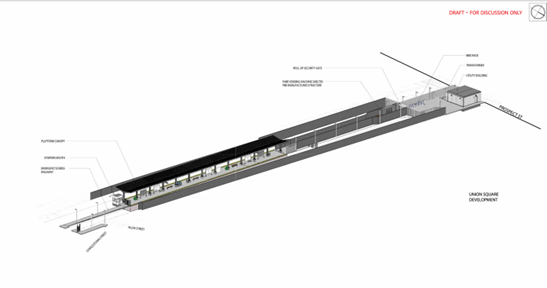
figure 3. Design as of December 2018 for Union Square Station. There are no elevators, escalators, personnel rooms, or fully enclosed public spaces.
Politics is the Project: The Community Path
Even though the Community Path, a three-kilometer shared bicycle and pedestrian path running alongside GLX’s Medford branch from the proposed Lowell Street Station to the new Lechmere Station in Cambridge, was not included in the Green Line Extension’s 2011 project scope, it had active supporters who fought for its inclusion by showing up to public meetings and lobbying elected officials. The Friends of the Community Path, an advocacy group based in Somerville, met regularly from 2001 to 2004 and again from 2010 to 2018. The City of Somerville prepared feasibility studies of the path dating back to 2006 and sought federal funding for it on its own.
In October 2011, MassDOT and the MBTA hosted a hearing on GLX designed to give the public the opportunity to comment on the planning and analysis that had been conducted to date. 34 different speakers voiced their opinions about GLX. The comments tended to focus on GLX’s delays, worries about the alignment being too short, and concerns about property and pollution. The specifics of each person’s testimony often reflected their location; Brickbottom residents voiced noise concerns and Somerville residents were concerned with diesel train emissions. However, when it came to the Community Path, 13 different people, or 38% of all speakers, called for its addition to GLX.
Despite the Community Path’s late entry into GLX’s project scope, the MBTA argued that the Path improved access to stations. Once construction was completed, people living adjacent to the four stations intersecting with the Community Path would be able to safely access them on bicycle or foot. Since these stations lacked automobile parking, the Path was pitched as a real benefit to the overall project. How real those benefits were is up for debate—after all, why was station access only emerging as a problem to solve after the Environmental Assessment, which more or less locked in the mandatory project elements? While the project managers, designers, and others we interviewed about the Community Path defended its merits, they also acknowledged that politics more than any technical consideration led to its adoption. Just as the scope of stations increased over time, the decision to enlarge the project scope and build the Community Path reflected a broader decision to appease the public and elected officials rather than maintain the project’s scope and budget.
Integrating the Community Path with GLX was always an expensive proposition that would cost at least tens of millions of dollars—though in the grand scheme of GLX, it was a drop in the bucket. The primary issue was one of either cutting the Community Path into the same trench as GLX or hoisting it above the tracks (Figure 4). Since GLX is in a constrained trench, the trench had to be widened to accommodate GLX’s tracks; thus, folding in the Community Path and keeping it in the same right-of-way required additional excavation, retaining walls, and, in the proposed portion by Lechmere Station, its own viaduct rising above street level. Just as we saw with the cost estimates from GMP 4, mundane elements, such as concrete, metals, and electrical works drive costs. In the case of the Community Path’s initial conceptual design and estimate from 2010, VHB projected that retaining walls and concrete would account for nearly 60% of the $22,329,000 budget. Since this was an early stage budget, it also included a 50% contingency to account for large changes to the plan. At this point in the design process, for instance, there were no plans to build a viaduct for the Community Path. By the end of 2015, the cost estimate, according to Grove (2016) had ballooned to $100 million, or $33 million per kilometer.[15]
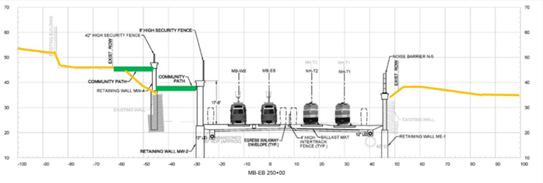
figure 4. Selection of a Community Path Section from the Interim Project Management Team Report: Green Line Extension Project (2016).
When the Interim team examined the Community Path, they approached it with the same ruthlessness as they had the stations and other elements in the project. One idea was to cut it from the project altogether. As noted throughout this section, however, the Community Path’s popularity made it impossible to scrap, especially after it was included in the FFGA. Rather than eliminate the Path, the Interim team decided to realign it and trim it from 3,000 to 2,150 meters. By reducing the costliest section of it, the viaduct connecting it to Lechmere Station, the Interim team estimated that it would cost $20 million to complete. Even after MassDOT and the MBTA revealed that GLX’s cost overruns jeopardized GLX’s realization, one attendee commented at a public meeting, “I think Somerville deserves a $100 million community path…. Somerville has sacrificed for everyone else’s transit convenience.” Another attendee stated their preference more plainly, “The path itself is at least as important to us as the Green Line” (Grove 2016). Today’s Community Path design includes the full three kilometers, but the new Design-Build team has stripped away amenities included in the previous design and narrowed it in places to keep costs low.
3.4 Conclusion
In our first case study, we have identified project management and delivery, design, and politics as three driving forces of costs. Understaffed agencies lacking experience with large capital construction projects struggle to manage consultants. In the aftermath of the first version of GLX, the MBTA committed to staffing up its capital construction team and streamlining its administrative processes so it can pay bills and respond to inquiries quickly. Once GLX is complete, it will be valuable to return to it and see what increasing internal capacity means in practice and if it made a difference. As of now, the projected construction costs are 43% of total project costs. By contrast, in Istanbul construction costs are often 75%–80% of total project costs.
We selected GLX as a case study because it is an extreme case with costs that defy global and even American averages for at-grade light-rail construction (Eno Center for Transportation N.D.). Rather than trying to understand the average case, which is also valuable, we studied GLX to identify specific areas of inquiry as key drivers of costs. Flyvbjerg (2006, p.13) highlights the value of extreme cases when he writes, “from both an understanding-oriented and an action-oriented perspective, it is often more important to clarify the deeper causes behind a given problem and its consequences than to describe the symptoms of the problem and how frequently they occur.”
As we complete more case studies, we will have a larger sample of project delivery mechanisms to compare and contrast. While GLX could be interpreted as a warning against CM/GC, we caution against that reading. Project delivery, like everything else, depends on the details. CM/GC as practiced in Massachusetts is different from CM/GC in Utah or Washington.
We are drawn to debates about alternative project delivery methods because it is an active area of policy debate in the United States. In New York, as part of a broader MTA transformation plan enacted in 2020, the agency must procure projects greater than $25 million via Design-Build (Slowey 2019). This concerns us because in Madrid, one of the lowest cost cities in the world to build subways, Metro de Madrid insists on Design-Bid-Build. We suspect the way they do Design-Bid-Build, using itemized lists leads to different outcomes than Design-Bid-Build with lump sum contracts, as it is practiced in New York. Our leading hypothesis, for now, is that internal capacity determines success or failure. The best designed project delivery can fail if implemented poorly. Conversely, Design-Bid-Build, Design-Build, Public-Private Partnerships, etc. can all work if the agency manages the project scope, budget, and relationships effectively. We have learned from international examples in Madrid, Istanbul, Milan, and Seoul that projects can be delivered at lower costs, relative to the United States, independent of delivery method.
Design, especially as it adds or subtracts materials and direct and indirect labor hours, has a significant impact on costs. In the case of GLX, we focused on stations because they were dramatically descoped during the redesign process. Along the existing Green Line, we see simple stations that resemble bus shelters with zero charms or comfort along Commonwealth Avenue. The proposed Union Square Station that has now been scrapped drew no inspiration from these utilitarian stations. Instead, it was designed to include a showpiece headhouse, spanning nearly 1,400 square meters, two levels, plazas, redundant elevators, escalators, and other amenities. In New York, Los Angeles, and Toronto, we have seen costs for transit projects increase as station designs have become more elaborate. One capital construction executive explained rising costs as the product of a mixed mandate: “We aren’t building transportation projects; we are building community” (Interview 2019). According to this executive, stations and the surrounding areas are no longer just places to wait for a train, but also places to meet up with friends and anchor neighborhood identity. As we shift our focus abroad, it will be interesting to see how station construction designs and methods in Madrid, Milan, Turin, and Istanbul differ from those in Massachusetts. These cities have figured out how to build uniform stations cheaply and quickly.
Disentangling the influence of politics on transit projects is challenging, but it doesn’t mean we should ignore its impact. We see politics interacting with projects in two distinct ways: first, there are the blatant alignment and program decisions made to appease politicians, advocates, and detractors, like the Community Path. In Ethan Elkind’s Railtown (2014), he describes the origins of the alignment of Los Angeles’ first subway as a “political negotiation.” Instead of serving the densest corridor along Wilshire Boulevard, early plans were designed to build a coalition of the many by serving “the primary power centers in the county” (p.20).
Second, in an attempt to “do no harm,” as Altshuler and Luberoff (2003) explain, projects are designed to avoid all controversy, real or perceived. As we saw with GLX, trying to satisfy Governor Patrick’s desire to get an FFGA before he left office and win over members of the public who favored the community path or complained about noise impacts drove decision making. First, siting GLX in an existing right-of-way was the politically safe decision because it minimized property takings and obviated the need to clear a new right-of-way. Second, the current Design-Build contract limits the construction work that can be completed between 10PM and 7AM, requires bridge work on College Avenue to keep traffic flowing by only allowing temporary lane closures, and is careful to protect commuter rail service during construction. These well-intended overtures end up extending construction timelines and adding costs, because laborers are less productive when they have to spend the first hour of their shift setting things up and the last hour breaking things down to mask the fact that there is a major construction project underway.
In our interviews with consultants and cost estimators who have worked on transit projects across the country, they all agreed that productivity levels in the Northeast were especially low compared to other parts of the country. In Philip Plotch’s Last Subway (2020, p.197), he recounts an interview with the former head of capital construction at the Metropolitan Transportation Authority, who described the challenge of minimizing disruptions while constructing Phase One of the Second Avenue Subway as “‘trying to ride a bike and change the tire at the same time.’”
By contrast, in Istanbul, transit construction projects run 24 hours a day, breaking down into three eight-hour shifts. It is no surprise that in the span of seven years, which is the expected duration of GLX construction, the Istanbul Metropolitan Municipality built M5, a 19.7-kilometer subway.
Since GLX is our first case, it informs what questions we will ask and which variables we will quantify in future cases so we can compare data more easily across countries and cities. We will continue to look closely at fine-grained cost data that allows us to compare the ratio of direct labor hours to indirect labor hours, the costs of stations per square meter, production rates, headcounts for key activities, and how indirect costs vary as a percentage of construction budgets.
In contrast with the failures in Boston, we hope that more cases will shed light on what success looks like. These should include very low-cost cities like Milan and Istanbul, but also medium-cost cities, which presumably have done some things right and other things wrong.
The ultimate goal of this research is to figure out how to bring down the costs of rail transit projects in the United States and other high-cost countries. We take a comparative approach to understand what drives costs, what reduces them, and how to build transit projects more efficiently so we can build more of them. In future studies, we intend to look at how other cities contend with the three issues we’ve identified as cost drivers here: project management and delivery, design and engineering, and politics. Is this everything? Definitely not. But it’s a start, and it should help us productively study more cities in the future.
[1] There is some controversy over the origins of this commitment and how much mitigation needed to be done because of the Big Dig; however, this is beyond the scope of this study. For more see Altshuler and Luberoff (2003) and former-Secretary of Transportation Fred Salvucci’s testimony at the Green Line Extension Hearing (2011).
[2] The first conceptual cost estimate dates back to at least the 2005 Beyond Lechmere Northwest Corridor Study.
[3] This project scope is compiled from multiple documents published by early 2011 rather than one document. The details differ from document to document and there is no reference to a Community Path.
[4] Project delivery is a critical element of transit-infrastructure projects. Throughout this case, we will discuss Design-Bid-Build, Design-Build, and CM/GC. While we suspect our readers have some idea of the different project delivery methods, it’s worth stating that traditionally, North American transit projects are delivered using Design-Bid-Build. In a Design-Bid-Build project, a transit agency will hire a design and engineering consultant to develop a detailed plan for a project. The agency will then take those plans and solicit bids from contractors to construct them. The key part of Design-Bid-Build for our purposes is that the design team differs from the construction team. In a Design-Build project, an agency will hire a single entity, usually a joint venture, to design and build the project. While the agency will not hire a designer to develop final designs, the agency will hire a consultant to specify the project and make sure that the Design-Build bidders have enough information to bid on a project. CM/GC sits between Design-Bid-Build and Design-Build. Rather than buying a final design and then putting it out to bid, as in Design-Bid-Build, or entrusting a Design-Build entity to design a project with minimal oversight from the agency, CM/GC enables the design team and the Construction Manager/General Contractor to work together on designs iteratively and ensure that they are constructable and match the strengths of the construction team.
[5] The MBTA also hired an Owner’s Representative and an Independent Cost Estimator.
[6] It is important to note that the design team was hired a full year before the general contractor. This means that as design advanced from 30% to 60%, there was no input from the general contractor as the design team committed to new plans and designs.
[7] We have also tracked other cost estimates that appeared in internal documents and the press.
[8] Each total project estimate excludes financing charges.
[9] While some of the people we spoke to were willing to be on the record, many were adamantly opposed to being on the record for fear of losing out on future business or promotions. Since GLX is still in the process of being built, we decided to anonymize everyone we interviewed. However, we can say that we spoke with planners and staff at the MBTA and MassDOT, transit agency staff at other agencies, current and former FTA employees, consultants from firms who worked on and continue to work on GLX, members of the public working groups, advocates, former Secretaries of Transportation, elected officials, professional cost estimators, risk assessors, members of the Interim Project Management Team, academics, lawyers specializing in project delivery, and historians of Massachusetts’ transit network.
[10] Two people we spoke with about CM/GC generally explained that 10% was too great a variance. The structure of CM/GC encourages the CM/GC to estimate its costs at the top end of the range. With a 10% window, a savvy CM/GC could underbid the initial procurement by claiming a too-good-to-be-true markup in order to secure the contract, and then make up the difference by maximizing the bid-on-work process. A smaller 5% window encourages the same behavior, but also incentivizes a more honest markup rate.
[11] Direct costs are the costs for building GLX, such as labor, materials, and subcontractors. Indirect costs are the costs required to manage the project, such as paying for office space, field supervision that ensures work matches blueprints, and contract administration.
[12] We were told that CM/GC best practice only included the CM/GC and ICE estimates for this reason.
[13] According to Hopkins (2015), it would cost $5 billion to address Somerville’s drainage problems.
[14] We include site improvements and landscaping because this station included two levels of exterior plazas with connecting ramps and outdoor seating and plantings.
[15] In our interviews, we received conflicting reports on the costs of the Community Path, but no one agreed that the Community Path added $100 million in costs. One designer we spoke with explained that if the Community Path had been built without GLX, perhaps it would cost $100 million, but in reality the extra retaining wall work extended existing retaining walls a few more feet rather than requiring new retaining walls. The viaduct portion in Lechmere, no matter what, was always going to be expensive.
4. The Istanbul Case
4.1 Introduction
In 2019, the International Public Transport Association (UITP) named Istanbul the world’s leading city in the total length of urban heavy rail under construction (İstanbul Büyükşehir Belediyesi [İBB] 2019). Within less than two decades, Istanbul went from commissioning its first metro line to managing 17 projects with a total length of 222 kilometers under construction. How had a city with little experience building subways become a leader in the global transit construction arena? This study explores rapid rail construction in the Turkish city of Istanbul, pinpointing the best practices that facilitate its efficiency in project delivery and how these processes developed over the years so that Turkish experts now design and engineer rail projects abroad.
In 1989, İstanbul Ulaşım,[1] under the Istanbul Metropolitan Municipality (IMM) commissioned Turkey’s first light rail transit (LRT) line. Now known as M1A, the line was 8.5 kilometers,[2] and from September when it opened until the end of the year, it carried almost 1 million passengers (Metro İstanbul n.d.-a). The construction of the first phase of M2, which was 7 kilometers long, took 8 years to build. It was the city’s first heavy rail line and connected some of the most important commercial, touristic, business and residential centers on the European side of Istanbul. The line started service in 2000. M1B has Istanbul’s first rapid rail tunnels mined by a Tunnel Boring Machine (TBM). The 5.5-kilometer light rail line features 4.35 kilometers of tunnels and began operations in 2013.
During these early years of building metros, there were only a handful of Turkish firms which were qualified to undertake heavy rail contracts that involved extensive tunneling. Track systems were imported and European experts were brought in to operate TBMs and train crews. As the city rapidly expanded its rail network over the following decades, the IMM, local contractors and consultants gained extensive experience. They adopted or developed new methods and technologies in construction, design and management; streamlined their project delivery processes; and raised the standards of occupational health and safety as well as environmental mitigation measures implemented. Today, Turkish agencies and contractors carry out metro projects from conception to construction of lines much larger than the M1B.
Since the 1950s, Turkey’s population grew from 21 million to 85 million, and from only 25% of the population living in its urban centers to over 75% today. The country was able to leverage urbanization to boost economic growth, through a number of economic and urban management policies (The World Bank 2015). A metropolitan municipality regime was adopted, which consolidated regions’ infrastructure and investment functions as well as granting greater power to cities over their planning decisions. The informal land rights were legalized, leading to household and public investment in dwellings and neighborhoods (Karpat 1976; Uzun, Çete, and Palancıoğlu 2010). Housing stock was expanded and demand was instigated through mortgage-based financing. National programs were adopted to support access to water, sanitation and other municipal services, the financial burden of which was shared between the municipal government and the private sector through Public-Private Partnerships (PPPs) (The World Bank 2015). The economic and urban management policies Turkey adopted to encourage urbanization attracted domestic and foreign investment into cities and eventually led to a construction boom starting in the early 2000s (Balaban 2011; Yeşilbağ 2016). Along with an explosion in the construction of new housing, many megaprojects have been realized through PPPs paid for by domestic and international loans through the guarantorship of the Turkish state.
Among the thousands of contractors that the country’s construction boom produced, a number of firms have gained global experience in projects of significant size and complexity; they employ experienced teams of architects, engineers and construction workers; and are able to mobilize quickly. With over 300 kilometers of rail tunnels including those that are under construction and a steady stream of urban rail projects built within the last decade, the city cultivated a rapidly growing, competitive rail construction market. This experience has enabled Turkish contractors to compete on a global scale: Doğuş has rail projects in Bulgaria, Georgia, Saudi Arabia and India; Gülermak builds in Sweden, Poland, India, and UAE; Yapı Merkezi in Qatar and Saudi Arabia; Prota has designed rail projects in Germany and Poland.
We selected Istanbul as one of our six cases because the lessons learned through years and several kilometers of rail building can help inform practices in other cities around the world. This report is the second in a series of case studies the Transit Costs Project research team has undertaken in an effort to understand how various urban centers and regions tackle building urban rapid rail infrastructure from planning, design, financing and procurement to construction and commissioning (Transit Costs Project n.d.). We highlight practices that help cities save money and time while delivering quality infrastructure to communities and ensuring high standards for health, safety, and environmental (HSE) impact policies throughout construction. Our research involves studying academic publications; government, trade and media documents; and conducting interviews with professionals from government agencies, contractor firms and consultants.
4.1.1 A Global Leader in Building Rapid Rail
Istanbul is the economic, financial, industrial and cultural activity center of modern Turkey. It has grown rapidly in the last three decades with its population doubling during that period to exceed 15 million inhabitants. Striving to meet its increasing travel demand, the city built a large network of public transit that includes buses, metros, trams, funiculars, bus rapid transit (BRT), ferries, sea buses, aerial trams as well as paratransit.[3] Nonetheless, as was the case with many urban centers globally, rapid urbanization brought rapid motorization and public transit planning fell short in providing widely accessible, sustainable mobility options to Istanbulites (Batur and Koç 2017).
Istanbul ranks as the fifth most congested city in the world (Tomtom n.d.) and to address this, IMM has committed to increasing the share of public transit ridership,[4] decreasing private car use and prioritizing the expansion of its rail network as one of its main transportation strategies.[5] The 2011 Transportation Master Plan outlined a maximum rail system network of 749 kilometers of which 227 kilometers were already in service, under construction or in the process of being tendered. The additional 522 kilometers of proposed lines were evaluated and 388 kilometers of these new lines were selected to be completed with a target of 37 lines in operation by 2023, including funiculars, trams, light rail, the Marmaray commuter line and metros.
Since the completion of the 2011 Transportation Master Plan, Istanbul commissioned the commuter rail line Marmaray with a submerged tunnel crossing the Bosphorus Strait, M6, the first phases of M3, M5, M7 and multiple phases of M2 and M4 along with new trams, funiculars and cable car lines. As of 2021, Istanbul has 17 rail lines measuring 253 kilometers; four of which are trams, two are aerial trams, two are funiculars, one is Marmaray and seven are heavy rail lines totaling 135 kilometers in length (See Figure 1 for the heavy rail lines). There are 15 ongoing heavy rail projects measuring 193 kilometers, and an additional 10 kilometers of trams (See Figure 1 for the heavy rail network targeted to be completed by 2024).
Within all modes of transportation in Istanbul, the share of private car use is 20%, public transit ridership is 28% and the remaining share of trips is split between walking and private shuttles (Beyazit-İnce et al. 2020). 18.6% of the public transit ridership is by rail, 77% is by rubber-tired vehicles and 4.3% by sea transport (İstanbul Elektrik Tramvay ve Tünel İşletmeleri [İETT] n.d.). With the addition of approximately 200 kilometers of rail including commuter lines, trams and funiculars, the city anticipates that the share of rail ridership within public transit will increase from 18.6% to 30% by 2024.[6] By 2029, the total length of the rail network is planned to reach 622 kilometers (Emlak Kulisi 2021). Figure 2 shows the timeline of Istanbul’s heavy rail construction.
figure 1. Istanbul’s rail network in 2000, 2014, 2021 and he network targeted to be completed after 2024.
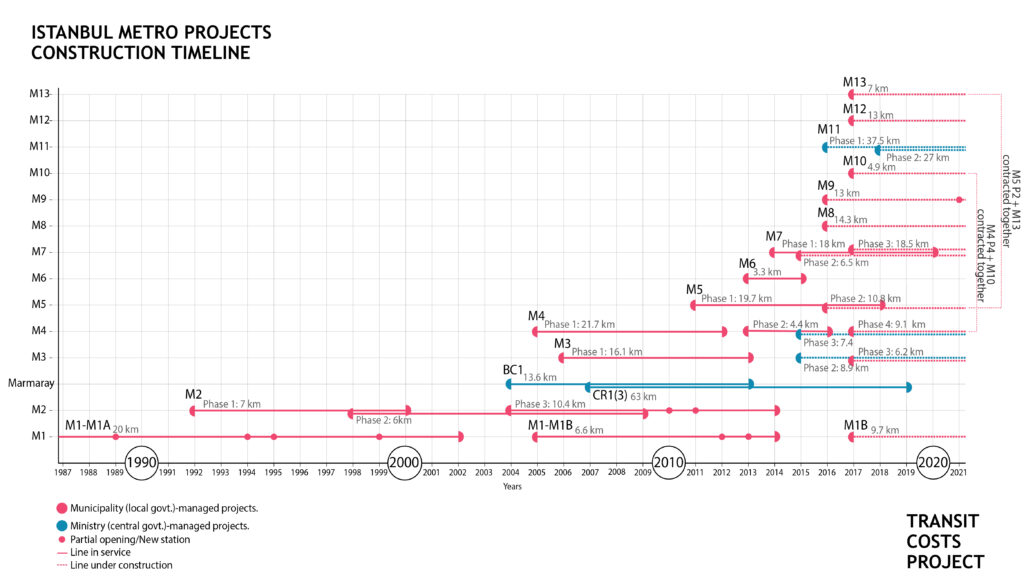
figure 2. Timeline of Istanbul heavy rail projects.
Among Istanbul’s rapid rail lines, the average length per contract is 16 kilometers (9 miles), and the weighted average cost per kilometer of rail is $126 million PPP[7] (Figures 3 and 4). Even though a linear relationship does not exist between the length of a line and the duration of its construction, based on the total length of completed lines and the total time it took to build them, we can say that 1 kilometer of subway in Istanbul is built in 7 months on average.
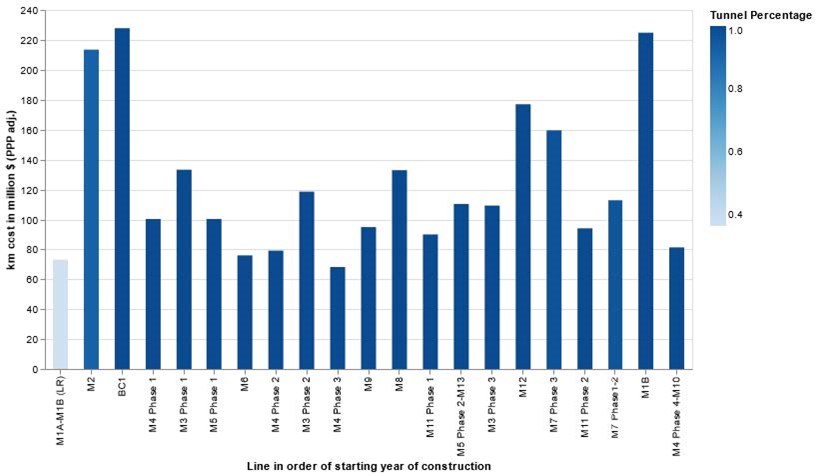
figure 3. figure 6. Project cost/kilometer, in order of starting year of construction of lines in Istanbul. Colors show the percentage of tunnel. Project costs that include the construction of a yard, oftentimes to be shared with other lines are M1A-B (at grade yard), M2 (at grade yard and 3 large parking lots), M3-P1 (at grade yard), M4-P1 (underground yard), M5 P1 (at grade yard, +2,750m connection tracks), M7 P1-P2 (at grade yard), M8 (at grade yard).
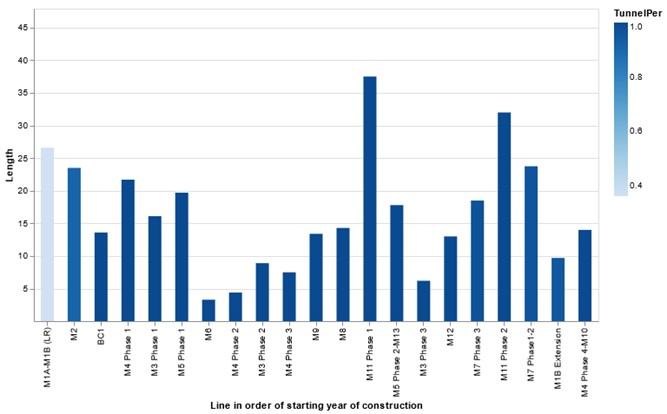
figure 4. Project length, in order of construction starting year of rapid rail lines in Istanbul. Colors show the percentage of tunnel.
4.1.2 Politics of Urban Rail Construction in Istanbul
Building urban rail in Istanbul is difficult due to the city’s unique geography, geology, rich archeological heritage and old building stock; yet, politics often breed the greatest challenges against rail construction in the city. Situated between the Black Sea in the north, the Marmara Sea in the south and the Bosphorus Strait bisecting the city, many construction sites are close to the water or under the water table, and often require diaphragm walls for structural stability and to keep water out. Thicker walls and heavier reinforcements are also necessary because the city is in an earthquake zone. Multiple archaeologically significant sites, some as old as eight thousand years have been unearthed while building the Istanbul Metro over the last two decades. The existing city is dense and the majority of the building stock is old, poorly reinforced or made of low-quality materials. On top of these challenges, the local and central governments might disagree on rail projects’ financing plans dependent on international loans, meddle in tenders and put pressure on the contractor to finish construction earlier for better publicity opportunities. All of these factors impact the construction processes, inevitably elevating project costs.
Politics play a major role in deciding what gets built, who builds it and how fast it is built. Until 2019, the IMM was run by the same political party as the central government, Justice and Development Party (AKP). Following the election of the current mayor Ekrem İmamoğlu from Republican People’s Party (CHP), the municipality and the central government have been in competition over building and commissioning rail projects (See Figure 8 for the timeline of key events and rail construction in Istanbul).[8] Even though such a race can seem to be a positive influence on the construction of metros in the city, the conflict between the two parties’ impacts metro projects negatively. Since the opposition party took over the Istanbul Municipality, not only did the central government refuse to guarantee international loans; but the public banks that were on good terms with AKP failed to provide loans to the municipality (Altaylı and Erkoyun 2019; Savaşkan 2020). Istanbul turned to European banks for loans to restart their rapid rail construction. The treasury under the central government still needed to approve these loans, which it delayed until Mayor İmamoğlu’s complaints were amplified by some left-wing media outlets (Güvemli 2020a, Cumhuriyet 2020a).
Local politics also influence construction processes and can create roadblocks in different stages of planning and building subways. Istanbul’s municipal parliament consists of members from both CHP and AKP, with the latter holding a majority of the seats. After the new mayor was elected, AKP members delayed the decision permitting new muck yards,[9] which became critical with the increasing number of underground metros being built in the city (Güvemli 2020b). Similarly, land acquisition is easier for the central government both because they have access to more disposable funds and can expedite legal processes which they are unwilling to do for the current municipal government. Hence IMM under İmamoğlu prefers utilizing municipally owned land when building surface structures, rather than waiting for approvals.
Central and local governments have undermined competition in Istanbul’s rail construction market by interfering with tender processes. The construction tenders of five heavy rail lines in the city were carried out on the same day in March 2017, in which the same group of contractors submitted separate bids to all five and each was awarded one project.[10] The resulting contract values were uncharacteristically higher than the estimated costs by the Rail Systems Department. Furthermore, the 21b law intended for extraordinary circumstances, that eliminates the request for qualifications (RFQ) stage in tenders started being used, through which the municipality could award tenders to contractors without public notices or following open tender procedures. Based on 21b, two airport connector metro lines were awarded to contractors known to be favored by the central government. Before the election of the new mayor, the local government also lowered the track record requirements to bid on rail construction tenders, which led to less experienced contractors with government connections winning some contracts.
Political pressure sometimes accelerates the construction of projects, which can facilitate earlier access to new transit lines for the public. There is always pressure on the local and central governments to complete projects within their terms. Opening rail projects are valuable publicity events for mayors and presidents, so towards the end of construction, usually after the initial deadline has already been extended due to delays, it is common for agencies to ask that opening dates of lines be rescheduled to coincide with a national or religious holiday. This requires rushing construction programs and often means a phased opening or completion of part of the work after revenue service starts. The Turkish contractors are accustomed to such rescheduling and often bear the risks and share the extra costs of an earlier opening with the agency. On the other hand, such changes in the program can raise costs and risk the quality of construction. Three senior level engineers with international experience in rail construction mentioned in our interviews that it is for this reason that such a concession would be unthinkable for a European contractor (Personal Interviews G, I 2020 and N 2021).
Despite these issues, there is sustained political will to build urban rail, a certain level of streamlining is built into the system, and agencies ease processes which allow Istanbul to build rapid rail cheaper than most cities in our database (Transit Costs Project n.d.). Below we present a summary of our takeaways from this study. In the next section, we provide an overview of how the agencies, contractors and consultants work together to bring down construction costs together with a detailed overview of cost information. Chapter 3 presents three projects studied in more detail. Our conclusion highlights the lessons that can be learned from Istanbul’s approach to building heavy rail infrastructure, and lays out the challenges the city still needs to overcome to improve its project delivery processes and quality of construction.
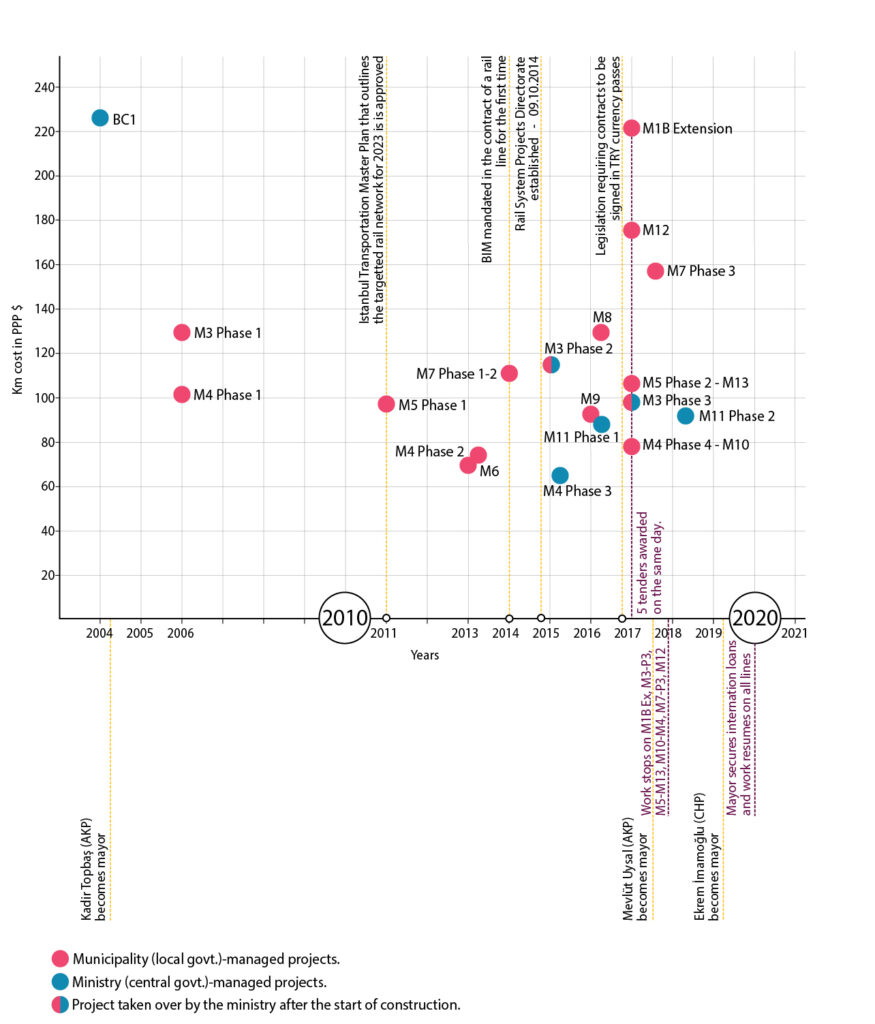
figure 5. Timeline and costs of Istanbul projects, changes in administration and legislation
4.1.3 Main Takeaways
Over the course of 36 interviews and a review of numerous documents, we identified four main factors that contribute to lowering costs and speeding up the construction of urban rapid rail projects in Istanbul. These are:
- The cultivation of a rail construction ecosystem through the completion of 15 urban rail projects[11] within the last 3.5 decades which facilitate competition in the market as well as an increased know-how. Political will, being partly responsible for this steady stream of projects.
- The established processes of project delivery that have been refined over the years.
- The flexibility of the agency and the contractors in collaborating to overcome obstacles by accommodating design changes during the building process, stemming from the understanding that speed saves money.
- The adoption of technology in design, management and construction through investment in software tools such as Building Information Modeling and expansion of equipment pools that involve purchasing new TBMs.
Agencies most commonly use a Design-Build (DB) project delivery method, but work with an initially procured, 60% design document that affords them a level of control over the project. While this design document is essential for estimating costs, conducting feasibility studies and evaluating construction bids; when working with the contractors, the agencies approach design change proposals with a level of flexibility that allows for innovation, which cuts down costs and saves time. In addition to this well-established practice of working with a design document while being adaptable to change, the city sustained a pipeline of rail projects within the last few decades (Figure 5) through which, the agencies, contractors and consultants gained experience and know-how. Availability of work encouraged an increase in the number of contractors in the city, and the competition soared. It became feasible for contractors to invest in technology and expand their capacities.
A streamlined procurement method that strengthens the agency’s hand, a collaborative and adaptable approach to changes, developing capacity and know-how owing to a steady stream of projects, and the rise of the rail construction market constitute lessons to learn for other cities wanting to bring down their rapid rail construction costs. Some other components of construction that Turkish teams allocate smaller budgets and time for, compared to the North American and European teams are more questionable. Low labor and professional service costs in Turkey bring with them substandard working conditions; HSE mitigation is well-enforced with legislation but lacks in execution resulting in higher numbers of fatal occupational accidents[12] and more disruptive environmental impact; and perfunctory community engagement along with minimal land acquisition can prevent conflict in order to save time and money, but the alignment of lines end up being suboptimal for the transportation of the city (Personal Interview C 2020).
Labor conditions, HSE and stakeholder management are critical issues that require control mechanisms, good planning and proper execution. However, it is worth taking a critical look at the resources allocated to deal with them both in Istanbul and other parts of the world. How much time and money cities spend on managing different aspects of construction should be considered in accordance with what is achieved, and the negative consequences when they are poorly executed.
4.2 Process Overview
In this section we present a process overview of how urban rail gets built in Istanbul. By examining Istanbul’s processes and how they have been refined over more than 30 years and the construction of more than 200 kilometers of urban rail, we can learn from Istanbul’s struggles and successes to develop best practices for subway construction. At the end of this section, we present cost information for labor, material and tunneling equipment as well as general cost estimates for metro lines in Istanbul.
4.2.1 Planning and the Internal Capacity
IMM and its agencies are responsible for transit planning and building the majority of rail infrastructure in Istanbul. They are bound by larger scale plans developed by the central government and need approvals from the central government at various points during the course of the planning of a rail project. The Ministry of Transit under the central government also builds rail infrastructure in the city, but only assumes projects of national significance such as the airport connectors and the commuter rail, Marmaray. As an exception, two additional urban rapid rail projects were taken on by the central government due to the financial difficulties IMM faced and the project’s contractor connections with the central government before the change of mayors in 2019. Thus, some projects in Istanbul are built by the IMM and others, by the Ministry of Transit, and each agency is responsible for securing funding for their own projects. The local and the central governments do not collaborate on projects.
The Transit Planning Branch Office (TPBO) under IMM appoints a team of 10 people to work on the transit demand and planning, together with coordination of intermodal transportation. Under IMM, the Rail Systems Department develops the preliminary rail projects in coordination with the TPBO and works on route designs based on the Integrated Urban Transportation Master Plan for Istanbul Metropolitan Area which is based on the City of Istanbul Environmental Plan developed by the Ministry of Environment and Urban Planning under the central government. This plan is dependent on the Strategic development plan prepared by the Presidency of Strategy and Budget (Figure 9).
The Integrated Urban Transportation Master Plan for Istanbul Metropolitan Area, the latest of which was issued in 2011, outlines the planned rail transit routes in Istanbul (İBB). The timeline for any project in the masterplan starts with the Rail System Projects Directorate under the IMM, or the General Directorate of Infrastructure Investments under the central government’s Ministry of Transit picking up the project. A group within a 35–40-person team carries out an alternatives analysis for the line internally (Personal Interview V 2021). The next step is to procure a final design document[13] at 60% design and a feasibility report. With these documents, the agency acquires a thorough understanding of the project prior to the construction tender, and, according to a project manager of an independent design firm that has completed several final designs and feasibility studies for the Istanbul metros, estimates costs with 90% confidence (Personal Interview A 2020).
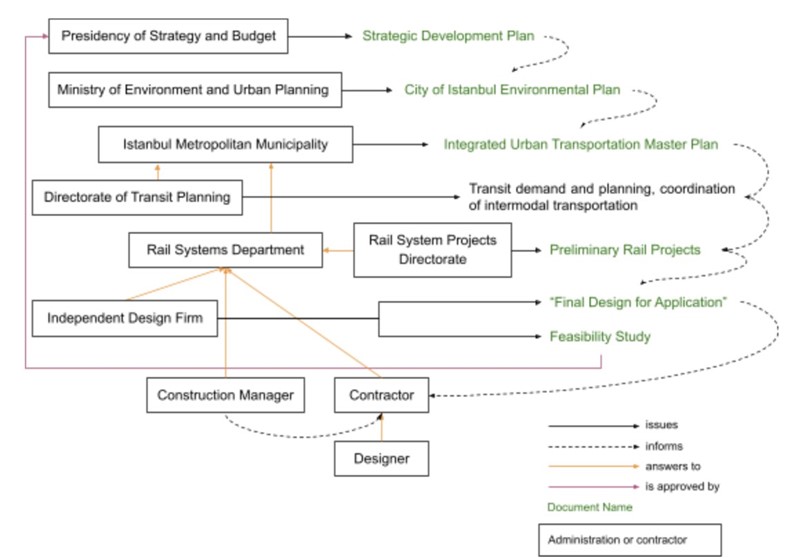
figure 6. Rail planning and procurement flowchart
Next, a Project Promotion Document is prepared and the Environmental Impact Assessment (EIA) process is initiated. Metro projects are not directly subject to EIA (EIA or “ÇED Report” in Turkish), but fall in “the List of Projects Subject to Selection and Elimination Criteria”, hence, the owner agency applies to the Ministry of Environment and Urbanization, and upon evaluation, an “EIA Not Required” decision is issued. To obtain this waiver, a Project Promotion Document is prepared and an application is submitted to the Ministry of Environment and Urbanization. The preparation of this document takes about a month, and its approval process takes approximately two months.[14] This process has been streamlined in consideration of the net-positive environmental effects of urban rail projects. Compared to the US, where the average time it takes to obtain an Environmental Impact Statement is 4.5 years (Council on Environmental Quality [CEQ] 2018, 2020), the process in Turkey is extremely rapid.
The Rail System Projects Directorate under the Rail Systems Department of IMM was established in 2014, and is responsible for the preliminary planning phases of rail projects in Istanbul. Beside procuring the 60% design document before launching the construction tender, the responsibilities of the department include the initiation of land acquisition processes for the lines approved by the municipality’s Transportation Directorate; preparation or procurement of the feasibility analysis and tender documents for the design, construction management, construction and rolling stock tenders; conducting the EIA process; evaluation of the design revisions during construction; supervision of the operating agency’s technical and maintenance work for lines in revenue service; specifying the architectural materials to be utilized in rail projects; developing strategies that encourage the use of local resources in procurement; enforcing the use of Building Information Modeling (BIM) technology; coordination with utility companies during construction and keeping record of the communications among all parties throughout the construction of rail projects.
The directorate typically carries out three more tenders after obtaining the EIA waiver, one for the construction management (CM), one for the construction work and one for the rolling stock. In the early years of metro construction, the tender package for construction used to include the rolling stock procurement as well. The agency did not have the capacity to procure the rolling stock on their own, however, transferring the risk to the contractor consequently increased the costs of procurement. Today, the agency carries out procurement tenders for rolling stock on their own.
The operating agency Metro İstanbul is consulted during the design process, but IMM’s Rail System Projects Directorate is more influential so Metro İstanbul does not demand significant changes. During construction, an 8–10-person team from the Rail Systems Department supervises the project on site. It is common to have 10 people on the agency side while a team of 60 people work on the project from the CM, which the agency considers their representative.
4.2.2 Financing
As part of the planning stage, the owner agency submits the feasibility report to the Presidency of Strategy and Budget for approval, in order for the project to go into the National Investment Program. This step is crucial when seeking financing options; once a project is included in the National Investment Program, the central government can act as a guarantor for the agency to obtain international loans with low interest rates; and even if not, the central government’s approval is still required for loan agreements or the issuance of bonds to finance projects. The construction cost estimates on the feasibility study reports are kept 10-20% higher than the actual estimated costs in order to account for possible overruns (Personal Interview C 2020).
Different financing options are evaluated in the feasibility reports. These include scenarios of 100% self funding, 75% self funding with 25% funding by commercial or export loans, 50% self funding with 50% funding by commercial or export loans, 25% self funding with 75% commercial or export loans, and also, 100% funding by commercial and/or export loans. Export loans indicate loans obtained from Turkish banks and commercial loans are those that are granted by international institutions such as the European Investment Bank, the European Bank for Reconstruction and Development, the World Bank, the Islamic Bank and Japanese International Cooperation Agency. In the feasibility reports, financial analyses explore different payment plans for the loans, interest rates and fees over specified payback periods as well as expected fare and advertising revenues.
Typically, the feasibility studies find a combination of 55-60% commercial and 40-45% export loans to fund 100% of a project’s costs to be the most advantageous. The interest rates are calculated based on the EURIBOR or LIBOR[15] rates, with an added 0.75 – 3.5%. A 0.6% commitment fee for both types of loans and a 1.27% commission fee for the commercial loans also apply. Grace periods of 1-4 years after the starting date of construction, payback periods of 10-14 years for the commercial loans and 20-24 years for the export loans are considered.
Even though projected ridership numbers and therefore the expected fare revenues utilized in the feasibility studies are considered to be optimistic, the projects are found to be financially infeasible (Personal Interviews F, I and J 2020). On the other hand, the economic feasibility analyses that take into account the travel time saved by commuters switching from different modes of transit; the savings realized by the reduction in crashes, maintenance and operating costs of rubber-tired vehicles and the upkeep and expansion of road infrastructure; as well as the environmental impact benefits show that the economic benefits of rail projects outweigh the financial costs. Hence these studies generally conclude that the projects are feasible to build when considered in terms of their economic benefits.
Foreign entities make decisions to grant loans for rail projects based on the credit rating of the owner agency (the municipality or the central government). Once major international investment agencies agree to provide loans, smaller banks also get involved through consortia. A single loan granting institution rarely finances 100% of the projects, their loans usually cover 20% or 30% of the costs. When foreign investors finance a project, they demand that the agency works with prominent designers and CMs, and also require reports to guarantee that stakeholder engagement plans are made; occupational health, safety and environmental impact standards are high. They visit the site and do quality control every six months.
There is a political side to the foreign financing mechanisms. When a financing institution agrees to provide a loan, it is common that they require a percentage (i.e., 30%) of the budget to be spent on procurement from the loan granting institution’s country of origin. For example, for the Marmaray Commuter Rail’s Bosphorus Crossing Phase, the Japanese Investment Bank which financed the project allowed for only a specific group of countries to bid on the construction tender, and the Japanese-Turkish consortium Taisei-Gama&Nurol (TGN) was awarded the contract.[16]
Politics between the local and central governments play an important role in the financing of rail projects as well. Most of the rapid rail lines in Istanbul are built by the local government, however, construction of some including the airport connectors M11 and M4’s airport extension as well as M3’s phases two and three are conducted by the Ministry of Transit under the central government. Due to congestion and a dire need for public transit infrastructure in the city, it is a matter of pride and prestige for both administrations to build rapid rail lines, and now that the local government has been run by the main opposition party since 2019, the two administrations race over who builds more rail infrastructure. Thus, the central government does not provide funding for municipally run projects; the municipalities find funding on their own. Among the rail projects that are owned by the Ministry, those from cities run by the same political party as the central government receive disproportionately more funding (Savaşkan 2020).[17]
4.2.3 Procurement
For the procurement of urban rail infrastructure, IMM utilizes a method that was modeled after the FIDIC Red Book Design-Bid-Build contract template, but evolved into what resembles a Design-Build method over the years.[18] The agency adopted a working relationship with its contractors, which meant that it was open to revisions coming from the contractor’s designer, if it found them to be reasonable and believed that they would save time and money. Examples include changes in the tunneling method, i.e., from using TBMs to building by NATM, the conditions of which are predefined in the contracts, or modifications in structural design, as was done in one case by replacing diaphragm walls with bored pile walls to make use of the contractor’s abundantly available piling machines (Personal Interview E 2020). The Public-Private Partnership (PPP) scheme is not preferred for the procurement of rapid rail lines in Istanbul due to the projects’ feasibility mainly being dependent on their economic rather than the financial benefits.
The pricing model of the construction contract is based on an itemized list of quantities for the civil and finishing works, which constitute about 65% of the items. The rest of the work such as tunnel ventilation system design, drainage system design, power and traction power design, training services and station common spaces environmental control systems or station sewer system for each station are also added to the itemized list but are priced as lump sum “sets.” The cost estimate, not announced before the bidding is complete, is carried out by compiling the list of quantities, quotes for services and lump sum items, then adding 25% on top of the total to amount for overheads, profit and contingency. Prepared by the Rail System Projects Directorate, the list of quantities for each project is provided to the tender applicants together with the final design documents, and is required to be filled out and submitted as part of the bids. The proposed prices are expected to be based on a standardized unit cost schedule that is annually issued by the Ministry of Environment and Urbanization for labor, equipment and materials, but can vary across bids.[19]
Usually, the procurement of construction works is carried out through a restricted procedure which is a two-phased tendering process; first an RFQ is issued to shortlist applicants, who submit offers to the later announced request for proposals (RFP). Construction tenders are evaluated based on the lowest bid, however, a minimum limit value is calculated dependent on the estimated value and the average of the proposed bids. Any bids under this limit are disqualified. A minimum of three and a maximum of ten bidders are shortlisted and invited to the second stage. If the number of qualifying firms is fewer than three, the tender is canceled. As opposed to the construction tender, the design and CM bids are evaluated based 70-90% (usually 80%) on the technical score and 10-30% (usually 20%) on the bid price (Directorate of Presidential Administrative Affairs, General Directorate of Law and Legislation [DPA] 2009).[20]
The scope of the construction contract generally includes tunneling, the civil and the finishing works of the stations and support facilities, the procurement and installation of the electromechanical systems, training of the operating staff and commissioning of the metro line.[21] This is a turnkey project delivery method; however, the agency and the contractor collaborate regularly throughout construction. The agency approves design and implementation decisions at several stages but also provides assistance to the contractor in third party relationships. For example, the electromechanical systems that make up approximately 25% of the contractor’s direct costs are often subcontracted to foreign firms such as Siemens, Thales and Alstom over which the agency has some leverage as a long-term customer when negotiating on prices. The agency helps the contractor in these negotiations and they both benefit (Personal Interview J 2020). The agency also aids the contractor regarding utility replacements by providing excavation permits and utility blueprints.[22]
Some construction tenders require the contractor to partner with a credit granting institution and their credit offer is evaluated as part of their bid. The contractor doesn’t owe or guarantee the money but, in those cases, arranges for the financing.
Landscaping design at the site of the cut and cover stations, station entrances and exits are within the scope of construction contracts. Sidewalks, signage, vegetation, water drainage are included but the designs are kept at minimum. Bridges, over and underpasses are built or renovated within the scopes of the contracts.[23] Contracts also include maintenance of the whole system for 2 years (or other predefined duration), including all elevators, escalators, pumps, vents and other systems. The contractor procures the maintenance work from the suppliers and subcontractors.
The electromechanics systems of extension projects are usually purchased from the same provider that installed the systems of the initial phase and hence are expected to be a little costlier. However, in some instances as was the case for M2, the agency may choose to go with a completely new system, requiring for the first section to be re-wired. In M2, the initial phase was built by Alstom, but because the agency found their offer for the second phase overpriced, the agency decided to switch the whole system to Siemens.
Agencies building rapid rail in Istanbul specify very short timelines for projects when compared to average durations of construction globally,[24] but multiply the number of TBMs required in the contracts, specifying schedules for mining different sections of lines simultaneously. Despite the implementation of these work programs, such timelines play out to be unrealistic and the contractors almost always negotiate for time extensions.
4.2.4 Average Cost Breakdowns
In this section, we summarize cost information from 17 rail projects in Istanbul between 2012-2018 (Figure 10). We examined government presentations, public procurement results, feasibility studies and trade news. A majority of this information is based on early estimates that are likely to change over the course of construction of a project and interviews with multiple engineers and project managers working in Istanbul, who are comfortable making estimates for projects based on a few inputs like length of a line and tunnel percentage. We also provide a walk through of a cost estimator’s process of estimating the costs of a project in Istanbul. It is important to note that these estimates do not account for ground conditions, archeology and financial difficulties hindering timely payments which also change the real costs and their breakdowns.
Excluding rolling stock, the majority of a project’s budget is spent on construction; and since agencies in Turkey prefer contracting infrastructure projects in a single package rather than breaking them up into several contracts, this 65-70% of the budget goes directly to the contractor. Soft costs, the majority of which are the financing charges, but also include the preliminary design, construction management and the preconstruction costs that are expenses related to obtaining the environmental assessment report, make up an average of 25-30% of the total budget. Utility replacements, remedial work, and mitigation costs are usually less than 5%.
When we look at the general breakdown of the contractor’s expenses for Istanbul rapid rail lines, we see 65 to 75% is spent on the direct costs (Table 1), which comprise all labor, material and equipment utilized in the construction. 3 to 5% is allocated to professional services such as the design and construction documentation; 5% to setting up and maintaining the construction sites; 2% to contract fees, insurance and securities; 1 to 2% to the head office costs; up to 7% to contingencies and the remaining 5 to 15% to profit.
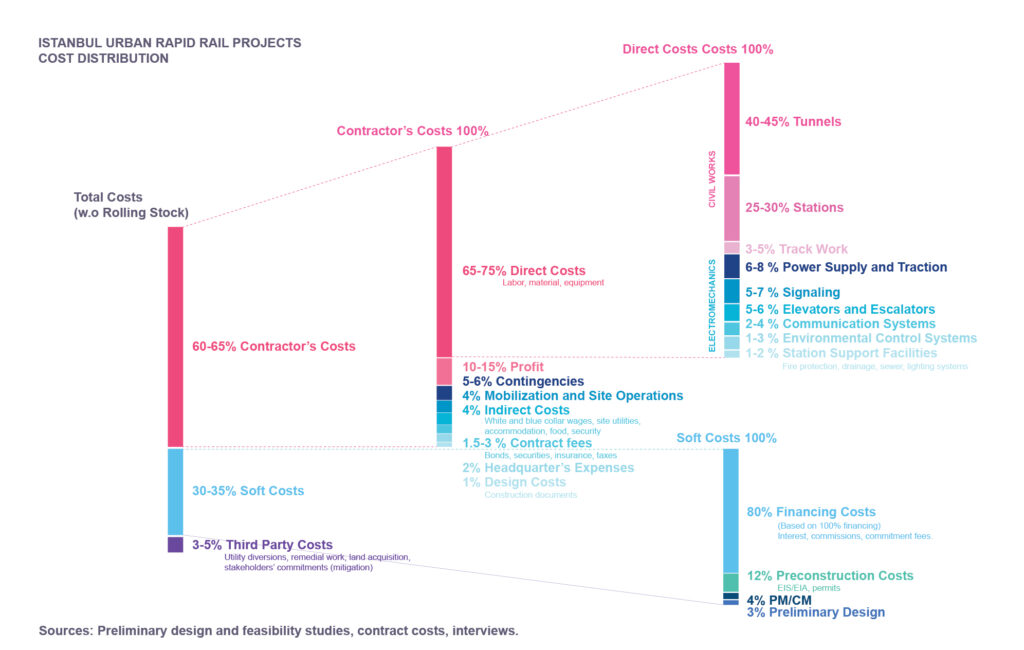
figure 7. Breakdown of average capital costs of a heavy rail line in Istanbul
The most striking difference between the overall cost breakdowns of Istanbul rapid rail lines with those of an estimate recently made for the US subway projects, is the professional services costs constituting 15 to 20% or less, and the utility relocations, 5% or less within the overall budget in Istanbul. Instead, the construction costs make up 65 to 75%, which is 10 to 20% higher than in the US projects (Table 2). Within the direct costs, the US spends double to 2.5 times the proportion of the construction budget on labor, less than half the percentage on the permanent material, and 10-12% less of the budget on the equipment (Table 3).
Table 1. Turkey construction cost breakdowns.
| Contractor’s Fee: Total of construction and electromechanics contract values | Percentage within the total (based on Personal Interview B 2020, and consultation with colleagues) |
|---|---|
| Direct construction costs (labor, material, equipment) | 65-75% |
| Design, construction documents etc. | 3-5% |
| Contract, financing, securities, bonds | 0.02 |
| Site spending | 0.05 |
| Central office costs | 1-2% |
| Contingencies | 0-7% |
| Profit | 5-15% |
Table 2. US vs Turkey construction cost breakdowns. US values from “Why Tunnels in The US Cost Much More Than Anywhere Else in The World” (Tunnel Business 2020).
| Overall Project Costs Breakdown | US | Istanbul (based on Personal Interview B 2020, and consultation with colleagues) |
|---|---|---|
| Soft costs (includes owner’s costs, preconstruction costs including EIS/EA, feasibility studies, program management consultant, design consultant, construction management, right of way easement, permits, insurance, finance, bonding, etc.) | 35% | 25-35% |
| Third party costs (includes utility diversions, remedial work, and stakeholders’ commitments) | 10% | Up to 5% |
| Construction costs (excludes the rolling stock but includes the installation of all related systems and the commissioning.) | 0.55 | 65-75% |
Table 3. Cost distribution of labor, material, equipment in Turkey vs the US. (Tunnel Business 2020).
| Breakdown of the Construction Costs | US | TURKEY (based on interviews) |
|---|---|---|
| Labor | 40% to 50% | 20% |
| Permanent material | 15% to 18% | 40% |
| Construction material, temporary works, consumables, etc. | 10% to 12% | 10% |
| Contractor construction equipment, TBM, etc. | 18% to 20% | 30% |
According to a contractor’s design director with experience working on urban rapid rail projects in Istanbul, the costs of a 10–12-kilometer twin bored tunnel project can be estimated as in Table 4 (Personal Interview G 2020). These costs include 10%-15% contractor’s profit and contingency, 10% indirect costs which account for 2-3% design and 7-8% overheads, without issues regarding surface structures and with easy ground conditions. All values have been PPP adjusted for 2020.
Table 4. Turkey construction cost breakdowns
| Work | PPP (in million) |
|---|---|
| Tunnels and stations | $1,800-$2,070 |
| Track | $70-$90 |
| Power and traction | $145-$165 |
| Signaling | $70-$90 |
| CCTV, SCADA, ECS (communications, control, environmental control systems, support facilities) | $215-$250 |
| Total | $2,300-$2,665 |
| For the above estimate | |
| Number of stations | 6 to 12 |
| Tunnel cost per kilometer, including tracks and finishings | $18-$45 |
| Per station cost with finishings | $120-$290 |
- $150-$200 million/kilometer can be estimated for tunnels + stations: deep, tube or cut and cover. If constructed closer to the surface, the price can go up 30-100%. A regular TBM tunnel of 6-meter diameter costs approximately $30 million PPP per kilometer. If tunnels are close to the surface as was in Marmaray, an additional 10-20% will be spent on mitigation for noise and vibration. The threshold is about 2x the tunnel radius below the basement level of buildings, so if the tunnel is twice its radius below the basement level, these costs will be minimal. The cost of an NATM tunnel of similar radius can go as low as 60% of a TBM tunnel, however, if the ground conditions are challenging, it can go up to 150% of the TBM costs. This is true even if the ground is hard rock that can be blast drilled, despite the excavation reinforcement requirements being less, since the permitted work hours and mitigation increases the costs.
- A cut-and-cover structure that is 30 meters deep is exponentially more expensive than a 15 meter deep cut and cover one. This is due to a change in the reinforcement design required.
- Signaling costs should be about $7-9 million PPP/kilometer for lines under 15 kilometers, unless it is a very complicated line. Change is rare in electromechanics costs across projects. The cost differences between projects are mostly due to the tunnel and civil works.
- Depot and maintenance areas cost roughly between one to two times that of one station’s costs, depending on their size.
In Istanbul, even though project cost estimates are made by adding a 25% profit on top of the total costs, according to multiple sources, contractors give up a large part of this amount to be able to compete in tenders, and end up bidding with approximately a 3%-5% profit margin, that can go as low as 2% (Personal Interview P 2021). For the same reason, a minimum proportion of the budgets are allocated to contingency and risk management. As the majority of risk is on the contractor, this minimal profit margin strains the contractors more than it would in cities of other countries such as Germany where the larger proportion of the risk is taken on by the owner agencies.
4.2.5 Professional Services, Staffing, Labor, Equipment and Material
The budget breakdowns of rail projects differ significantly between Istanbul and the US. More importantly, the overall costs are much lower in Istanbul and that is because professional services, labor and equipment cost remarkably less. Material and consumable prices do not show significant differences across most countries, but the speed and duration of construction inevitably influence their dent in the project budgets. Here we give an overview of costs for each of these components in the Istanbul rail projects and comparisons with the US and other countries to provide a context for the case studies we present in the next section.
Professional services costs in Turkey are low due to small teams and low wages. White collar jobs are more than twice as expensive in the US as in Turkey (Personal Interview I 2020); a junior engineer in Turkey is paid a net amount of $2,000 to $2,500 PPP a month, whereas in the US, this number is closer to $5,500 (WPI 2020). The case is similar when Turkish white-collar wages are compared to those of Canada and a number of European countries. Below are the average costs for the most commonly outsourced professional services in metro construction in Turkey.
- The initially procured preliminary design contract which sometimes includes a feasibility study, on average, costs $26 million PPP or 1.2% of the total of construction and design costs. (Based on 5 projects).
- The average fee the contractor pays their own designer is $20 million PPP or 0.9% of the total costs (Based on 5 projects).
- The CM contracts cost, on average, is $49 million PPP or 2.3% of the total costs (Based on 14 projects).
Typically, professional service teams of Istanbul metro projects have the following staff numbers. A practice that keeps the teams smaller, is that the professional services and construction staff perform a variety of different tasks as part of their jobs, rather than being dedicated to a single task that is specified in their contracts. For example, it is possible to hire the same person as the head of technical office and the deputy project manager.
- Contractor’s designer’s team has 4-5 supervisors on the construction site, full time. 1 project manager and 7-8 team leaders work full time from the beginning to the end of the project. In addition to that, there are 15-20 people who jump on and off so in total, about 30 people are involved from the designer team’s office throughout the construction, approximately 15 full time staff being dedicated to the project.
- The CM has about 10-12 people full time on the project and about 50 working on it on and off.
- On the agency side, 10-15 people work on one project full time.
- The contractor firm assigns 150-200 people for each project, excluding the laborers. 30 to 40 of these are management staff at the central office and 100-150 on the site all of which are white collar workers that are the full-time employees of the contractor. Additionally, 10-15 service staff are allocated on the construction sites. The construction workers and the rest of the service staff are employees of the subcontractors (Personal Interview M 2021).
One of the key factors that keep construction costs low in Istanbul is the low labor costs in Turkey. Tunneling staff are the highest paid workers in rail construction, and in the States or countries where labor costs are high, tunneling staff wages, benefits and fees can account for a considerable percentage of the construction costs. The size and efficiency of the teams are also influential. One way Turkey cuts down on labor costs is that skilled laborers perform a variety of different tasks on the construction site on top of the specific jobs they are hired to complete. The national social security system standardizes health benefits for all workers and costs an additional 30-35% of the net wages to the employer. 90% of workers are accommodated on the site in temporary structures. In total, accommodation, food and insurance add 40% to the wages as contractor’s labor expenses.
The main reason for the low labor costs of Istanbul projects are the wages. If we compare the wages of tunnel workers in Istanbul and New York, a city that is known to have high labor costs and influential labor unions, the differences are astounding. In January 2021, Istanbul tunnel workers earned $100-$125 PPP per day working 12-hour shifts and had a gross compensation of $140 to $175 PPP when including social security and taxes bringing their hourly gross compensation to a range between $11.6-$14.6 PPP. In New York, in 2010, tunnel workers earned on average $350 per day, working 8-hour shifts and had a gross compensation of $700 dollars when including additional benefits (Personal Correspondence A 2021). So, their hourly gross compensation came to $87.5 exclusive of overtime. What is interesting is, the 6.7-fold difference is not parallel to the difference between wages in general. The minimum hourly wage in New York is slightly higher than twice the minimum hourly wage in Turkey and the minimum monthly wage, only 60% higher than in Turkey (Table 5).
Table 5. Turkey Minimum Wages
| 2021 | Turkey (Lira) | Turkey (PPP) | US (dollars) |
|---|---|---|---|
| Monthly gross minimum wage | ₺3,578 | $1,653 | $2,640 |
| Daily gross minimum wage | ₺120 | $55 | $120 |
Below we provide wages and costs of tunnel workers calculated based on four recent rapid rail projects in Istanbul and for two TBMs working simultaneously on site (Table 6). This team saves on staff and equipment through coordinating resources between the two TBMs.[25] Working in two twelve hour shifts per day, a total of 81 TBM personnel and 92 surface crew members are employed to run two TBMs simultaneously. The total cost of this team, including wages and benefits add up to $493,000 PPP per month.
Table 6. Summary of monthly wages of workers in a 2 TBM rail construction team in Istanbul
| Summary Table | 2 TBMs Tunnel Crew | 2 TBMs | 2 TBMs | 2 TBMs |
|---|---|---|---|---|
| (total for 2x12 hour shifts) | Surface Crew (total for 2x12 hour shifts) | Tunnel and Surface TBM Crew Total (total for 2x12 hour shifts) | Tunnel and Surface TBM Crew Total (total for 2x12 hour shifts, PPP) |
|
| Crew Size | 81 | 92 | 173 | 173 |
| Total Monthly Costs (wages *1.4: includes insurance, accommodation, food) | $75,460 | $74,760 | $149,380 | $492,954 |
For comparison, a New York team working with a single TBM employs a total of 60 TBM workers, 78 support crew members and 44 management staff who split work in three shifts of 8 hours (Table 7). The labor costs of this team including wages, benefits and union fees total $593,000 per month. This number is higher than the monthly operating costs of a two-TBM operation in Istanbul with each TBM being expected to mine at a speed of up to 24 meters per day. In the construction of New York’s Second Avenue Subway’s first phase, the average speed was 12-15 meters per day. Based on these numbers, a conservative estimate says that Istanbul could build almost 18 times the length of TBM-mined tunnels that New York builds, with the money New York spends in a month:
$593,000 x 4.3 = $2,550,000 (NY team monthly cost)
13.5 meters x 22 (work days a month) = 297 meters/month (NY team mining speed)
$493,000 (Istanbul team monthly cost)
20 meters x 2 TBMs x 6 days x 4.3 weeks = 1,028 meters/month (Istanbul team mining speed)
($2,550,000/$493,000) x 1028 = 5,317 meters/month (Istanbul can build with NY money)
5,317/297 = 17.9 times (Istanbul builds 17.9 times as NY with the same money spent per month.)
Table 7. Summary of weekly wages of workers in a single TBM rail construction team in New York
| Summary Table | 1 TBM Tunnel Crew (total for 3x8 hour shifts) | 1 TBM Support Gang (total for 3x8 hour shifts) | 1 TBM Management Staff (total for 3x8 hour shifts) | 1 TBM Tunnel and Surface TBM Crew Total (total for 3x8 hour shifts) |
|---|---|---|---|---|
| Crew Size | 60 | 78 | 44 | 182 |
| Total Weekly Costs | $221,000 | $270,000 | $102,000 | $593,000 |
On the down side, labor conditions in Turkey, in general, are inferior when compared to those in the Western world. Most teams work 8-hour shifts and TBM teams operate 2×12 hour shifts which is comparable to the shifts in Europe, but workers only take one day off every 14 days, staggering their off days in order not to slow down construction. In comparison, tunnel workers in New York are not allowed to work more than eight hours a day, unless they work 10 hours x 4 days a week (State of New York Department of Labor [SNYDL] n.d.).
According to a contractor’s engineer who has worked with French teams in Africa, the French and Turkish laborers, even when working on the same project, work under significantly different conditions. The French are hired by contracts that cover their travel expenses on top of insurance and accommodation (Personal Interview N 2021), cannot work more than six days in a row and 39 hours/week, they are paid 25% more than the base rate until the 43rd hour and 50% more after 44 hours, and can have extra days off in compensation (Personal Correspondence B 2021). The ratio of a Turkish laborer’s versus a French laborer’s monthly cost to the contractor, including food, benefits and accommodation is 11 to 18 (Personal Interview N 2021). Also, Turkish workers are rarely compensated for overtime (Personal Interview O 2021).
Tunnel excavations with a TBM costs $11-$12 million PPP/kilometer (Table 8) to the contractor, for which they will most likely bid for $13.5 to $15 million PPP/kilometer. The contractor’s tunneling costs for a twin bore line with 7-kilometer tunnels (in total 14,000 meters) are presented in Table 8.
Table 8. TBM tunneling costs from two Istanbul metro projects in 2020
| Per Meter Cost (PPP) | Depreciated Costs (due to equipment share with another project) |
|
|---|---|---|
| 2 TBMs | $1,970 | $1,280 |
| Machinery Equipment (cranes, conveyor belts, concrete and welding stations) | $1,075 | $690 |
| TBM consumption (fuel, oil etc.) | $1,180 | |
| TBM Staff | $1,130 | |
| Concrete Segments | $3,735 | |
| Grout | $195 | |
| Customs and Delivery | $570 | |
| Electrical Equipment | $60 | $12 |
| Power | $2,100 | |
| TOTAL | $12,015 | $10,892 |
Including contingency costs, shipping one cubic meter of excavated earth to a dumping ground costs $15 PPP. Based on the costs for four lines recently constructed, an average of 40.5 cubic meters of earth is excavated per meter length of TBM tunneling, the costs of which come to $600,000 PPP per kilometer of tunnel.
Turkey produces good quality cement for a low cost; January 2021 cost is $160 PPP per ton (Table 9). The cost of steel in Turkey is similar to other countries but these rates vary very little globally (Personal Interviews I and J 2020).
Unlike costs of labor and material, energy prices in Turkey are high. Electricity costs $0.5 PPP per kilowatt which is 40% more expensive than in Italy and almost 9 times more expensive than in the US. Diesel fuel, which is used for earth moving trucks, is also costly in Turkey. It is $3.08 PPP/liter, and gas (fuel) costs (as of November, 2020) $3 PPP/liter whereas it costs $0.6 PPP/liter in the US.
In Turkey, social security, income taxes, VAT and customs taxes do not constitute a serious burden on the contractor that results in a premium for project costs. The corporate taxes are 22.5%, and the VAT is 18%. For comparison, the corporate taxes in the US are 35%.
Table 9. Cement costs by country
| Cost (per ton) | Currency | Year | PPP | Real Cost (PPP) | Source | |
|---|---|---|---|---|---|---|
| Turkey | 320 | TRY(₺) | 2020 | 0.5 | $160 | Contractor’s cost sheet |
| China | 443 | CNY(¥) | 2021 | 0.24 | $106 | (Sunsirs n.d.) |
| Korea | 75000 | KRW(₩) | 2019 | 0.001 | $75 | (Tamotia 2019) |
| India | 6307 | INR(₹) | 2019 | 0.047 | $296 | (Directorate of Economics and Statistics Government of Andhra Pradesh [DESGAP] 2019) |
| Italy | 108 | EUR(€) | 2020 | 1.3 | $140 | (Colacem 2016) |
| Spain | 101 | EUR(€) | 2020 | 1.6 | $161.6 | (El Instituto Nacional de Estadística n.d.) |
| Sweden | 800 | SEK | 2010 | 0.1 | $80 | (Fagerlund 2011) |
| UK | 124.8 | GDP(£) | 2019 | 1.5 | $192.6 | (Department for Business, Energy and Industrial Strategy (UK) [DBEIS] 2020) |
| USA | 128 | USD($) | 2021 | 1 | $128 | (IBISWorld n.d.) |
4.2.6 Cost Overruns
The price of a project can increase based on the changes throughout its construction. This increase, however, is limited to 20% of the contract value by Turkish procurement law, otherwise it is required to be approved by the cabinet of ministers.[26] This is a lengthy process, therefore to avoid it, if a project is estimated not to be completed within the contract budget, or if the contractor foresees losing money, it finishes what it can submitting change orders totaling no more than 20% and terminates the contract in mutual understanding with the agency.[27] This usually happens gradually with the agency tracking costs through progress payments. Change orders are quickly assessed and approved because all contracts are based on itemized costs. Following the decision to terminate the initial contract, the agency opens a new completion tender. In some cases, as in the case for M4, subcontractors are rehired by the new contractor when a new company or consortium is awarded the completion tender.
In 2016, Turkey started mandating contracts and all business transactions to be carried out in the Turkish currency, TRY. This is counterproductive, because Turkey imports a significant amount of the material and equipment which make up 70-80% of the project construction costs, so the changes in exchange rates increase the costs drastically in the Turkish currency. State issued yearly inflation rates remain below the currency exchange rate increases, therefore the price adjustments the contractors are permitted to make based on these yearly inflation rates do not cover the increased costs of material and equipment.[28] This is why there is almost always a 20% change order – even though contracts specify that the exchange rates cannot be shown as a reason for change orders.
Due to recent rapid devaluations of the Turkish Lira, it is difficult for a contractor to profit from a contract based in the currency and, according to a senior engineer with international and local experience in the field, the only reason contractors undertake projects in these conditions is to gain political favor (Personal Interview I 2020). Once a contractor completes a government owned project, it is likely to establish a positive relationship and get other, more profitable jobs in the future. But if a contractor’s losses exceed 15% of the contract value due to inflation or currency exchange rate increases, because this percentage already exceeds the profit + contingency margin, the contractor will likely request the termination of the contract, finish the portion of the work they can within the budget and the 20% increase, and the remaining work will be re-tendered.
4.3 Cases
Through three case studies, we have explored existing practices and lessons learned by the Istanbul Metropolitan Municipality and the Turkish Ministry of Transportation and Infrastructure over 3.5 decades of building urban rapid rail in the city.
We selected the M4 Kadıköy-Kartal line to highlight how early projects in Istanbul struggled. M4 suffered from a chaotic preliminary design process conducted by an IMM that lacked internal capacity and experience. Major project scope revisions after the start of construction led to significant budget increases. Presenting the IMM with these challenges, the project laid the groundwork for better optimized planning phases and design outcomes in future projects.
BC1, the Bosphorus Crossing section of the 76-kilometer Marmaray commuter line, was chosen as a project with extraordinary risks which unlike other rail projects in Istanbul, was carried out with a contract based on the FIDIC Silver Book, built by an international consortium and completed after significant delays and cost overruns.[29] With capital costs only slightly higher than the average cost per kilometer among the 600+ projects in our database, Marmaray exemplifies a learning process within the lifetime of a project that steadily improved the productivity and collaboration between the multiple stakeholders involved.
M9 is a more recent line with lower rider capacity than M4 and BC1, but is considered better optimized in terms of design and construction by experts in the field, while falling within the cheapest 10% of rail projects in our database. By the time IMM started working on the line, it was armed with experience from decades of rail construction and had streamlined its planning, procurement and management processes. IMM also benefited from the advantage of working within an efficient ecosystem of industry experts in the city.
Some overarching themes we explore within these three cases are, the improvement of the internal organization and know-how in the agencies, evolution of the procurement methods, optimization of the final designs, cultivation of the rail construction industry in the city, flexibility during the stages of construction as well as the use of technology in design, management and construction.
4.3.1 M4, an Early Example
Overview
M4 is a fully underground, double track urban rapid rail line on the Asian side of Istanbul, with Kadıköy as the western terminus, a residential and commercial district along the southern coast of the city that provides important transit connections to the European side via ferries, the Eurasia tunnel and an interchange station with the Marmaray commuter line (Figure 11). Once the line reaches Acıbadem, it follows the D100 (E5) highway and was planned to reduce the heavy motor vehicle traffic load of this busy transit route.[30] As part of its fourth phase of construction, the line is currently being extended to the Sabiha Gökçen Airport which is a hub for domestic flights on the east side of the city. Our study focuses on the first phase terminating at Kartal and includes 16 stations in the span of 21.7 kilometers. With 180m long platforms, the maximum capacity of the system was planned as 70,000 passengers per hour per direction.
We studied M4 to understand the planning and management processes during the early years of rapid rail construction in Istanbul. Additionally, M4 is unique in that it saw extensive changes to its project scope, normally a red flag. The agency and contractors, however, managed these changes and major technical challenges all while keeping the new budget below the 20% allowable cost increase limit following a second construction contract.
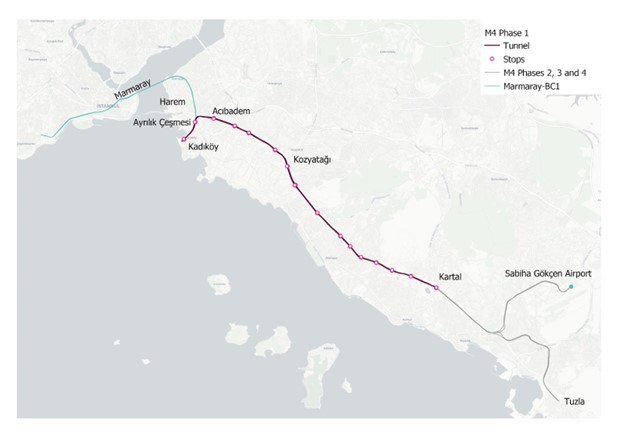
figure 11. M4 Phase 1, Kadıköy – Kartal Metro Line
The first of the key lessons from M4 is that, the role of the planning and design process preceding the construction tender is critical for equipping the agency with the necessary information to manage the project effectively throughout construction. Without a well-established preliminary design process that would allow the IMM in later projects to develop a thorough understanding of the design, produce a well specified construction tender package and keep contractors in check, M4 ended up with over-designed elements and a massive increase in its budget. We also saw that the later re-organization of the IMM through the establishment of the Rail System Projects Directorate, and the streamlining of the initial design process were pivotal in increasing the agency’s productivity in the many years of rail building to follow. Lastly, the flexibility and collaboration between the agency and contractor during construction, which for M4 facilitated the decision to drill and blast tunnels that were initially planned to be built by TBMs, are aspects that we would like to highlight as beneficial to Istanbul projects, as they speed up processes and consequently, reduce costs.
Timeline and Financing
M4 was initially conceived as a tram line during Erdoğan’s term as mayor of Istanbul, between 1994 and 1998 (Table 10). A 22 kilometer right of way was planned which would run from Harem through Kadıköy, and follow the D100 (E5) highway all the way to Tuzla, a district in the southeast of Istanbul. The section between Acıbadem and Kartal was to be constructed at-grade in the highway’s median. However, due to D100 being the only highway serving the international highways network in Istanbul until the TEM highway was built to relieve its traffic, D100’s right of way belonged to the central government. In 2002, the General Directorate of Highways handed over the right of way to IMM, removing a key obstacle to building M4.
In 2004, Mayor Topbaş announced that the IMM had considered asking the Ministry of Transportation under the central government to run the project, but IMM changed its mind and decided to build it through a PPP in order to speed up the process, also mentioning that it was considering making it an elevated line (Türkiye Gazetesi 2004; Wowturkey n.d.). All major deviations from the initial conceptions regarding the line, no official plans were disclosed for any of these statements in the days to follow.
Plans changed again as M4’s terminal was shifted from Harem to Kadıköy to integrate it with the Marmaray Commuter Rail line at Soğütlüçeşme. Following this decision, M4 was planned as a light rail with the Acıbadem-Kartal section at-grade, as was initially conceived, with 3.3 kilometers of bored and 2.5 kilometers of cut-and-cover tunnels from Kadıköy to Acıbadem (Ocak 2006). The tender was announced in December, 2004, and within one month, the contract was awarded to Yapı Merkezi-Doğuş-Yüksel-Yenigün-Belen İnşaat consortium (the “Anadoluray Group”), for $225 million PPP. Construction began in February 2005.
Construction projects move quickly in Istanbul. It’s common for construction to begin within a couple of weeks to three months after awarding the contract, even as the contractor’s design process is underway.[30] This overlapping process of design and construction can lead to missteps that require revisions during construction. During the construction of M5, the contractor had already bored the piles for one of the stations when the agency decided that the station needed to be one story smaller, so the station was built with deeper piles than necessary (Personal Interview G 2020). In the case of M4, the nature and number of changes that followed the start of construction were drastic.
Table 10. M4 Timeline (Metro İstanbul n.d.). Contract values retrieved from various media
| Date | Item |
|---|---|
| 1994-1998 | An early study of the route is carried out during the office of Mayor Erdoğan. The central government owning the right of way of the central traffic island between Acıbadem and Kartal poses a problem for the at-grade section to be constructed by the IMM. |
| 2002 | Protocol signed between IMM and the General Directorate of Highways handing over the central traffic island between Acıbadem and Kartal to IMM. |
| 01-04-2004 | Kadir Topbaş becomes Mayor. |
| 12-30-2004 | First tender with a scope of 5.6 kilometers underground and 16 kilometers at grade light-rail line. |
| 01-28-2005 | Contract signed with Yapı Merkezi-Doğuş-Yüksel-Yenigün-Belen İnşaat consortium for $225 million PPP. |
| 02-11-2005 | Construction works start. |
| 01-14-2008 | Tender for the completion of Kadıköy-Kozyatağı section, the construction of Kozyatağı-Kartal section both fully underground and electromechanical works of the whole metro line. 3 offers received. Best offer by Astaldi–Makyol–Gülermak ($1.6 billion PPP). |
| 03-06-2008 | New contract signed with Astaldi–Makyol–Gülermak. Deadline: 1460 days (4 years). |
| 03-21-2008 | New contractor starts construction. |
| 05-05-2008 | Tender for rolling stock of metro line. 30 sets, each with 4 cars, 120 cars in total. Delivery in 1200 days. |
| 06-30-2008 | Agreement for the funding of the 1.6 billion PPP construction fee was finalized between the IMM and a group of local and international financial institutions led by Fortis, SACE, and WestLB. |
| 07-14-2009 | 2 offers to rolling stock tender, CAF and Alstom. Best offer by CAF ($330 million PPP). |
| 09-09-2009 | CAF is awarded the rolling stock contract. |
| 03-12-2022 | Signaling is completed on the line. |
| 04-06-2012 | Total number of cars increased by 20%, reaching 144 in total. |
| 05-08-2012 | Test runs start. |
| 08-17-2012 | Service starts (the second construction contract was closed at $1.9 billion PPP, with a 20% increase). |
| 08-3-2012 | The delivery of all 36 train sets completed. |
After M4’s construction began, the owner agency Istanbul Electric Tramway and Tunnel Establishments (İETT), made a decision to upgrade the line to a fully underground, heavy-rail line. IETT believed that managing D100’s traffic during construction, an international freeway at the time, would cause congestion, create conflicts with local residents, and delay construction, and lead to major cost overruns. Once construction was completed, the planned LRT was slated to use one of the highway’s travel lanes, which would reduce the road’s vehicular capacity and exacerbate the already congested conditions. Additionally, a heavy-rail system which the travel demand analyses justified, would provide a capacity of 60,000 to 70,000 ppl/hr/direction, more than three times that of an LRT’s 20,000 ppl/hr/direction (Ocak 2006).[32]
The scope of the first contract had involved a 21.6-kilometer LRT line with 16 kilometers of its length at grade, while the new plan was to build a fully underground line with heavy rail capacity. This enormous scope change meant that a considerable increase in the budget was inevitable. A law that had gone into effect in 2003 required that any cost overrun for public projects greater than 20% of the contract value would have to be approved by the central government. While the budget for the new project would far exceed the 20% limit, the central government’s approval process was feared to be burdensome and lengthy. Instead, it was decided to keep the initial contractor doing part of the work while opening a new tender to complete the sections of the construction that would remain.
The initial contractor, Anadoluray Group re-submitted an estimate of $288 million PPP and redefined their scope; it would only cover the nine kilometers section of the tunnels from Kadıköy to Kozyatağı and the civil works for seven deep-tunnel stations. The work was completed slightly under budget in 2010. In the meantime, the new tender carried out in January 2008 for the remaining works was won by Astaldi–Makyol–Gülermak (the “Avrasya Consult”), for $1.6 billion PPP, in March.[33] The tunnels were completed in October 2011, the signaling system installation in March 2012, test runs were carried out in May 2012, and the line started service in August 2012. The second contractor completed their work with a cost increase that was just under the permitted 20%.
The IMM secured the funds to finance M4’s second construction contract of 1.6 billion PPP through a funding package agreement finalized in June 2008. Led by the international financial institution Fortis, the Italian Export Agency SACE and the German Bank WestLB, the group of funders included Calyon, Dexia/Deniz Bank, Vakıfbank, Depfa Bank, ABN AMRO, Societe Generale, Unicredit Corporate Banking, Black Sea Trade and Development Bank, Mcc- Mediocredito Centrale (Globe Newswire 2008). $1.1 billion PPP of the sum was provided in the form of commercial credits (international loans) to be paid back with a 2.2 + Euribor interest rate in seven years after a three-year grace period. The $490 million PPP was loaned as export credits (local) and would be paid back in 10 years following a grace period of four years (Arkitera 2008).[34]
The indecisions in the planning and management persisted until the second construction contract was signed in 2008, and extended the duration of the project by three years. The following four-year timeframe within which a majority of the construction was completed was a very fast-paced construction process.
Scope and Contracts
The two contracts involved the construction of a fully underground, 21.7-kilometer line from Kadıköy to Kartal with 16 stations, each having cut and cover mezzanines and tunneled platforms, as well as an underground maintenance and storage yard. A third tender was opened for the completion of the Ayrılıkçeşmesi station, part of which had been built within the scope of the connecting line, Marmaray’s construction. The total cost of the line ended up $2.2 billion PPP or $102 million PPP/kilometer. Tables 11 and 12 show the details of the scope and contracts.
Table 11. M4 Scope. (İBB n.d.; Uysal 2016; Railway Gazette 2012; Rail Turkey En 2012; Indian Railway Stations Development Corporation Limited [IRSDC] N.D).
| ELEMENT | SCOPE | FEATURES |
|---|---|---|
| Guideway | • M4 new rapid transit line | • Single line • Completely underground system |
| Track | • 21.7 kilometers double track + additional tracks for depot and maintenance area connections | • 54 kilo/meter UIC 54 (54E1) • 1,435 mm gauge • Switches: 42 main line, 12 depot and workshop, 3 rail crossings Switch Type: R: 300 m 1 / 9 type (Main line), R: 100 m 1 / 6 type (Workshop and Warehouse) • Gradient: 4% • Lucchini and Voestalpine rails • Pandol fastenings • ABB switchgear and transformers |
| New Stations | • Kadıköy • Ayrılık Çeşmesi • Acıbadem (100% Deep tunnel) • Ünalan • Göztepe • Yenisahra • Kozyatağı • Bostancı • Küçükyalı • Maltepe • Huzurevi • Gülsuyu • Esenkent • Hastane-Adliye • Soğanlık • Kartal | • 16 new underground stations • All platforms are 180 meter long, for 8 car operation and built with side platforms. • Bostanci Station: Additional track with 2 side platforms • Maltepe Station: Depot and maintenance area constructed as two parallel tunnel structures. • Esenkent Station: Main control center • Total entrances: 52 • 264 escalators • 70 elevators • 315 turnstiles (29 wheelchair accessible) • A minimum of 90,000 cubic meter excavation was done for each station |
| Tunnels | • 21.7 kilometers main line twin tunnels and station tunnels constructed using TBM and NATM techniques | • 6.30-meter diameter, and 5.70-meter inner diameter (as in majority of lines in Istanbul). • Total Single Line Tunnel Length: 43,326 m • 2 EPB-TBMs: Kadıköy - Kozyatağı • 2 TBMs: Kozyatağı - Kartal • NATM: Station tunnels (2 or 3 x 240-meter platform tunnels), connection and crossover caverns of 13 kilometers length. • Max. Depth: 40 meters (Bostancı ve Huzurevi Stations) • Min. Depth: 28 meters (Ayrılıkçeşme ve Hastane – Adliye Stations) |
| Systems | • Overhead Catenary • CCTV • Thales SelTrac® CBTC (Communications-Based Train Control) and ICS (Integrated Communication and Control systems). • The main control center (OCC) | • 1,500 V DC • 1,281 camera system • Moving block system signalization • Driverless operation • Includes traffic and storage, SCADA and ECS, communication, and supervisor sessions. |
| Support Facilities | • Maintenance and depot | • Maltepe Station (between Maltepe and Huzurevi stations): - Heavy maintenance area capacity: 2 sets of 4 cars -Maintenance area capacity: 2 sets of 4 cars -Depot area capacity: 9 sets of 4 cars -Additional depot area capacity: 4 sets of 4 cars -Total: Capacity for 17 sets of 4 cars. |
| Vehicles | • (36) x 4 | • DC Supply (Battery): 110 V DC • Traction Motors: 4 pole AC motors • Train Length: 90 meters (trains run as single sets of 4 cars or in double sets of 8) • Vehicle Height: 3.5 m • Vehicle Width: 3 m |
Table 12. M4 Contract Costs
| Contractor | Scope | Cost (in millions) | Year | PPP (in millions) | Total with Overruns (in millions) |
|---|---|---|---|---|---|
| Yapı Merkezi-Doğuş-Yüksel-Yenigün-Belen İnşaat | Kadıköy-Kozyatağı tunnels and civil works for the 7 deep tunnel station structures. | $140 | 2005 | $225 | $288 |
| Astaldi–Makyol–Gülermak | Kadıköy-Kartal construction and electromechanics tender. | €750 | 2008 | $1,600 | $1,900 |
| Haydar Sezer | Ayrılık Çeşmesi Station completion tender (Kadıköy-Kartal phase). | ₺19.5 | 2012 | $19 | |
| CAF | Rolling Stock (30 sets of 4 cars) | €138 | 2009 | $330 | |
| Total Construction | $2,200 | ||||
| Total Rolling Stock | $330 |
Planning, Design and Management Issues
The first phase of M4 encountered several setbacks early on in its timeline due to the lack of a well-developed preliminary design document. This had to do with the ongoing restructuring process of the managing authority of the rail projects in the city, and the nonexistence of a streamlined and established procurement process. The line went from an initial design of a light rail with the majority of its length at-grade, to a 100% underground heavy-rail project. Additional contractors were hired, the timeline almost doubled, and the budget increased by 900%. Moreover, both the stations and the tunnels were over-designed with larger technical spaces than those in later heavy-rail projects, built after the agency started procuring the final design documents from prominent design and engineering firms.
M4’s phase one was completed before the Rail System Projects Directorate under IMM was established in 2014. The initial planning and construction works of the line were managed by the owner agency İETT, a department under IMM that was charged with running Istanbul’s large bus network and building and maintaining trams and funicular lines.[35] By the time the decision was made to convert M4 to a fully underground heavy rail line, the Rail Systems Directorate under the Transportation Department of IMM had taken over the project, which later in 2012, would be reorganized as a separate department under the IMM. Only in 2014 would the department dedicate a team to the preliminary planning and management of the procurement processes for the rail lines, structured as the Rail Systems Projects Directorate.
Without a dedicated team conducting M4’s early planning, a detailed final design document was not available to the agency when preparing for either of the construction tenders.[36] Avrasya Consult, which was awarded the second contract after the major scope revision, hired experienced design firms to design the stations, the local Prota, and the tunnels, the Italian Geodata. However, without a binding final design through which the agency would oversee the contractor’s design decisions, M4’s stations ended up with a generous allocation of spaces and tunnels that were over-reinforced, inevitably increasing material and labor costs. Once established, the Rail System Projects Directorate would start procuring preliminary design documents at 60% design from professional design offices through tenders. Referred to as “final project for application”, these documents have informed feasibility studies and afforded the agency better control over projects to this day (Personal Interviews A, C, D 2020 and Y 2021).
Station design was a major cost driver in M4’s Kadıköy-Kartal phase. When we compare M4 with more recent lines, we can see how stations have been optimized through the size and configurations of mechanical spaces. In M4, the fan rooms and the additional mechanical spaces organized around them are located in cut and cover structures above the platform levels. Starting with M5 Üsküdar-Çekmeköy’s stations, the fan rooms were located in between the platform tubes at the platform level within shorter NATM tunnels. In M5, this configuration applied to 11 stations saved $14,2 million PPP on construction and $72 million PPP in land acquisition costs, as well as an estimated year of going through the more onerous land acquisition processes that would have been required for the larger cut-and-cover structures (Namlı 2017). The fan rooms, generally constituting the largest technical spaces in station structures, were as big as 200 to 240 square meters in M4, whereas they shrunk down to 80 to 140 square meters in the newer projects. Moreover, we see bespoke designs for each station in M4, rather than the almost identical configuration of these spaces in more recent stations. Such an established, repeating design implies a faster design process, which presumably saves additional time and money.
Rapid rail designs have evolved over time to have more generic stations and better customized tunnels in Istanbul. However, İstanbul has not approached the level of optimization achieved in Copenhagen and German cities that have opted for a performance-based design approach that allows them to reduce the number and capacity of ventilation fans, and scale down the associated mechanical spaces based on performance tests (Personal Interviews R and S 2021).[37] Turkey, similar to the US, follows a prescriptive process, where legislation and contract specifications determine the material, size and configuration requirements of spaces that will ensure safety in case of emergencies such as fire and earthquakes. What is more limiting and expensive, from a capital cost perspective, for Istanbul is that it has not managed to reduce station volumes by building shorter platforms, like Copenhagen, Milan, Turin, or Brescia. In these cities, by contrast, they maintain high passenger volumes in smaller stations by increasing service frequencies, such as trains every 90 seconds during the peak period. Istanbul, on the other hand, builds stations with long platforms to accommodate longer trains to meet growing travel demand. M4, like the rest of the lines Istanbul groups as Metro 1, has 180-meter-long platforms.[38] Hence station designs cannot be optimized to the extent that shorter platforms would allow.
Similarly with most subway stations in Istanbul, M4 stations can be considered bare-bones in terms of architectural features and finishing works. Architects who have worked on rail projects in Dubai and Warsaw point out the contrast between the embellishment and craftsmanship visible in rail stations in those cities with the blandness of Istanbul’s (Personal Interviews P and X 2021). This is a conscious choice on the agencies’ part, however; IMM and the Ministry of Transit prioritize building more lines, faster and more cheaply ahead of spending money on star architects or expensive art work like in New York and Naples. They utilize a standardized set of plain finishing materials in stations, and designate wall spaces for generic art.
Construction
The primary takeaway from M4’s construction is that speed saves money. Due to the challenges in the initial planning and contracting phase which began in 2005, M4’s construction progressed slowly until March 2008. Nevertheless, the 21.7-kilometer line was completed within the following four years, hence M4 has one of the fastest construction timelines in the history of urban rapid rail construction in Turkey (Figure 5). While certain forgiving working conditions contributed to speeding up construction, the key element that facilitated the rapid completion of the line was the mutual openness and adaptability to change exhibited by the IMM and the contractors. By changing the alignment and modifying tunneling methods, the contractors had to reallocate labor, material, equipment and work schedules.
With construction already delayed due to major design modifications, the agency wanted to proceed as swiftly as possible after the second construction contract was finalized. Three key decisions made in collaboration with the contractor over the months to follow, saved the project a total of 11 months (Sabuncuoğlu 2011). First, in the time that the contractors were waiting for the TBMs to arrive from Germany, they started building the tunnels by drilling and blasting (or the NATM method). Second, they changed the construction schedule to employ the NATM method more extensively, including in segments that were initially planned to be built by TBMs, even after the TBMs arrived (Table 13). Third, they utilized as many as 13 shafts and excavated at up to 17 locations simultaneously within the eastern 14 kilometers of the line in order to surpass TBM speeds and complete the construction quickly.
Table 13. Planned vs actually employed NATM and TBM/EPB tunneling methods for the section starting from the 13.7th kilometers to the end, studied by Öz (2012)
| TBM (all values indicate twin boring) | NATM | |
|---|---|---|
| Initially Planned | Km 3+820 - Km 8+ 520 (4,7 km EPB) Km 8+520 - Km 21+690 (13,17 km TBM) | Remaining tunnels except for a few cut and cover station sections |
| Actual Construction | Km 3+620 - Km 8+450 EPB/TBM (4,8 km) | Remaining tunnel sections except for the platform tunnels which were built with cut and cover. (16,9 km - C&C sections) |
Circumstances favored the strategies used to speed up construction after the second contract went into effect, but the agency and the contractors also deserve credit for making the right calls. Blast drilling can be a rapid tunnel excavation technique when the soil conditions are right, but a major concern is its environmental impact such as the noise, vibration and dust along the alignment. The current law in Turkey requires permits for the blasts, and mandates a work window of 8am-11pm which restricts construction schedules, but this was not the case during M4’s construction; moreover, M4’s construction took places adjacent to residential neighborhoods. The agency and the contractor informed the public and managed the PR successfully so work continued day and night without facing serious opposition from local residents (Personal Interview M 2021). Interviewees with international experience noted that this kind of flexibility was unique to Turkey (Personal Interview D 2020 and AB 2022).
The flexible and collaborative approach adopted by the agency and the contractor during M4’s construction remains a strength of the Turkish rail industry to this day, but the most significant improvement in construction speeds came from the rapid adoption of technology and increased knowledge of tunneling techniques in the years to follow.
Today, TBM tunneling is preferred over NATM due to the easier access and declining costs of TBMs as well as their faster excavation rates.[39] This improvement was possible thanks to a steady pipeline of projects in Istanbul and Turkish firms’ rapid adaptation to new technology. In the early years of tunneling, the TBM personnel learned from the Italian, German and Danish supervisors that were hired to train TBM operators. But within the next decade and a half, they gained extensive experience through several rapid rail projects built in the city, with an average length of 15 kilometers and more than 99% of their length tunneled. Commonly, with the exception of stations, platforms and switch tunnels, all subway tunnels in Istanbul are built by TBMs while platforms and switch tunnels are built using NATM. Since Istanbul has hilly terrain, most stations in the city end up 30-50m deep, making stations with tunneled platforms cheaper and more practical than completely cut and cover stations, which require costly excavation support and backfilling.
Similarly with other areas of rail construction in Istanbul, there has been a learning curve in the way contractors procure and operate TBMs. In the construction of the 12-kilometer M1B line which was the first rail line built using TBMs, and which started tunneling in 2006, the contractors were recommended to use a specific type of TBM from the German manufacturer Herrenknecht. These machines required cutter head changes every 6 kilometers, as that first section of the soil was sand/silt clay and the remaining was limestone. The contractors later learned that they could use mixed-design cutterheads suitable for both soil types under such conditions and have adopted these in their recent projects instead. In addition to Herrenknecht, Turkey has purchased TBMs from Terratech, CRCHI, Lovsuns Tunneling and Robbins. Furthermore, they have adopted more efficient TBM-related logistics by embracing multi-service vehicles (MSVs) and belt systems to deliver injection material and remove spoils rather than using train systems.
In the last 10 years, 15 rapid rail construction contracts have been awarded to firms in Istanbul alone, and a majority of these to consortia of two or more contractors, which makes it profitable to invest in expensive technology such as purchasing TBMs. With the exception of the Bosphorus crossing, all lines are designed for standardized external tunnel diameters of 6.3 meters, so that the same TBMs can be used across projects. Most tender specifications require firms to acquire four, six or more TBMs, and longer lines mean going through multiple soil conditions so construction firms prefer to buy TBMs suitable for all types of geology found in Istanbul.
Turkish contractors bring down TBM costs by purchasing second hand machines and rebuilding them,[40] as well as utilizing the same TBMs in concurrent projects. The cost for each rebuilt TBM in a recently constructed twin bore rapid rail tunnel project was $21 million PPP (Personal Interview T 2021) whereas if these were bought new from Herrenknecht, they would cost $40 million PPP. According to a tunneling engineer we spoke to, the complementary parts, such as the gantry, pipes or cuffs, can be used second hand without the risk of compromising speed, safety or quality of work, while it is preferable for the main gearbox that rotates the cutterhead to be new (Personal Interview T 2021). TBM motors could be reset at the manufacturing company with a 100% warranty, and cost $5.5 million PPP for a $22 million PPP TBM. Costs of equipment can also be shared across projects. One contractor who is simultaneously running two rapid rail projects in Istanbul saved 35% on TBM purchasing costs; 40% on machinery equipment like conveyor belts, gantry cranes, concrete and welding stations and 80% on the costs of electrical equipment (Table 8).
While the TBMs became much more accessible, the market for other construction equipment also grew in Istanbul since the construction of M4. One of the challenges in the construction of M4 was building the Kadıköy Station. The structure was designed with cut and cover mezzanines and tunnel platforms that are 32 meters below ground. It was located under a late Ottoman era historic building used by the Kadıköy Municipality. The geology at the excavation site was difficult to work with, having a variety of soil types: sand, sandy clay, highly weathered rock and rock. Along with three shafts that had to be built to speed up the construction, diaphragm walls were required to keep the water out, as the station was very close to the sea. At the time of the cut and cover section’s construction in 2009, equipment used to build diaphragm walls were scarce, so the contractor had only two options for where to obtain them (Personal Interview B 2020). Nowadays, this equipment is easily available and so the costs have come down.
Lessons Learned
M4 suffered from major cost increases and delays due to serious design changes in the early years of its construction. Nevertheless, at $102 million PPP/kilometer, the line ended up among the cheaper lines in the history of Istanbul’s heavy rail construction.[41] While the project benefited from both the agency’s and the contractor’s flexibility to adapt rapidly to changes, saving time and money, we can tell that costs could have been even lower, if the overdesign of the stations and tunnels were avoided. Our understanding is that the setbacks during the planning phase, the inexperience of the agency and the relatively recent establishment of the rail construction industry in the city took away from what could have been a much more efficient and cheaper project delivery process. As the agency re-organized, expanded and gained experience over the following years, robust preliminary design processes were established, helping to avoid cost increases due to overdesign and extensive design changes.
In hindsight, experts from the agency and design firms realized that the station-technical spaces were too large and the tunnels were over reinforced. These elements of over design have been attributed to the agency’s inexperience with rapid-rail transit procurement and project management. A preliminary design document was not procured, the alignment decisions in the internally prepared design were based on limited information regarding geology and station locations had to be revised after the tender.
The tender documents were also underdeveloped; they lacked sections and specifications that were to be added in the documents of the later projects. The missing sections include an attached geotechnical report based on ground surveys and lab tests, and those concerning public content and safety, rain and ground water drainage systems, testing and protection of existing buildings within the impact area, geomonitoring equipment requirements as well as protection of existing greenery and landscape design. Our understanding is that the costs incurred from additional work required to make up for the errors or shortcomings resulting from the lack of information on these issues were avoided in the later projects through the addition of these specifications.
Preliminary design, planning and tender processes improved and project designs were better optimized in the years that followed M4’s construction. Specifically, the Rail Systems Department, tasked with planning, procuring, and managing construction became independent from the İETT. Then it was split into European and Asian side regional departments, and later, a new Projects Directorate office was created to manage preliminary planning. By revamping the Rail Systems Department based on experiences in the field and a growing pipeline of projects, it found the right balance between inhouse and outsourced capacity. More experts were hired under these new administrations, and the total headcount grew to 251 staff members today, with 117 at the Asian side branch office, 107 at the European side branch office, and 27 at the Projects Directorate (Personal Correspondence C 2022). From these offices, IMM now appoints an on-site control team of approximately 10 experts for each project, consisting of architects, engineers (civil, mechanical, electrical, mining, geological, geophysical, signalization), and, where needed, archeologists. The Rail Systems Department has also established specialized teams for design and procurement as well as for BIM.
The agency made up for lost time in the earlier phases of M4 by being flexible and allowing the contractors to pursue their preferred means and methods, such as switching from TBM to NATM tunneling methods to speed up construction. Ultimately, this approach saved both time and money. While the planning challenges in the early stages of the project led to a slow start, once the final decision was made to build a subway rather than an at-grade LRT, tunneling progressed rapidly between 2008-2012, and the 21.7-kilometer line was completed at a record rate. This was also possible due to a lack of restrictions for blast drilling near residential and commercial zones at the time. Mitigation measures have grown more restrictive over the years.
4.3.2 Marmaray, the Perfect Storm
Overview

figure 12. Marmaray Commuter Line’s Bosphorus Crossing Phase
To this day, Marmaray is recognized as one of the most ambitious transit projects in the history of Turkish rail construction. While the complete 76-kilometer rail line was designed to accommodate commuter, high speed, main line and freight service, in this case we focus on the 13.6-kilometer Bosphorus Crossing Phase (BC1) (Figure 12). The project presented extraordinary challenges; the scope included a 58-meter-deep immersed tube tunnel to be assembled under the seabed, the right of way was situated in a seismic zone and extensive archeological sites were uncovered at all four of the station sites, some going back as much as eight thousand years. We selected Marmaray’s BC1 because at $228 million PPP/kilometer, its cost remains lower than 30% of the projects in our database despite the state-of-the-art technology implemented in its construction, the multiple challenges that were faced and archeologically-driven schedule delays that doubled its timeline.[42]
Politics played a key role in structuring the project-delivery design of this megaproject. The Japanese financiers required the project be delivered using the FIDIC Silver Book (a lump sum, turnkey, Engineering, Procurement and Construction contract template) and the selection of a Turkish-Japanese consortium as the contractor. Unlike the Design-Build contracts utilized in the procurement of most of the rapid rail lines in Istanbul, BC1s’s contract specified stringent HSE and quality standards and transferred a greater responsibility and risk to the contractor. The contract set high standards and predefined management solutions that benefitted the project in the long run, but also raised the costs significantly. On the other hand, unlike most metro lines in Istanbul that are owned by the IMM, Marmaray was owned by the General Directorate of Railways, Ports and Airports Construction (DLH) under the Ministry of Transportation of the central government.[43] This meant that the budget increase and time extension approvals could be expedited and the project wasn’t subject to conflicts between the local and central governments.
The archeological discoveries made during the excavations of the project changed the known history of Istanbul, but also more than doubled the construction timeline of the complete Marmaray project. The initial schedule of BC1 entailed completing a 1.4-kilometer immersed tube, 10.1 kilometers of twin bore TBM tunnels and four underground stations by 2009. The project was completed in 2014. The works for the remaining 63-kilometer section separately contracted as CR1 was to be completed by 2012, and included converting two existing commuter lines Halkali-Sirkeci and Haydarpasa-Gebze from 2 to 3 tracks, with the new one to serve high-speed intercity trains. CR1’s contractor, a joint venture between Alstom, Marubeni, and Doğuş, terminated their contract due to delays in the handing over of the site, likely as a result of complications related to archeology (Personal Interview H), and disagreements with DLH, which led to an arbitration process that finalized with the contractors losing approximately 50% of their bank guarantees (Alstom 2019). This section was re-contracted as CR3 to the joint venture between OHL and Dimetronic, and started service in 2019, with a seven-year delay in the initial timeline.
The mix of traffic along the line makes its signaling more difficult than a regular urban rapid-rail line. The line’s three tracks throughout the right of way merge into two along the 13.6-kilometer BC1 section. The commuter trains have 8- and 15-minute headways, and serve 142 trips a day in each direction adding up to 285 trips a day in total. As of August 2021, the high-speed rail service runs seven trains in each direction between Halkalı (European side of Istanbul) and Ankara, and three in each direction between Halkalı and Konya daily. The rest of the high-speed trains stop at Söğütlüçeşme on the Asian side, where a connection is available to Söğütlüçeşme Marmaray service for crossing to the European side. The freight trains have been operating on the line since May 2020.
Lessons learned from this project concern the power of political will, the management of archeological discoveries during underground rail system construction and the importance of selecting contractors and consultants based on their experience with the chosen contracting method:
- First, because the central government championed Marmaray BC1 as a nationally important project that would have a positive impact on congestion, elected officials supported the project even as costs and timelines doubled. This highlights the significance of support from policymakers.
- Second, the lack of a detailed survey of the station sites prior to the construction tender impeded preliminary planning that could prevent delays caused by the archeological remains discovered during the excavations. The station designs and even the right of way could have been redesigned to avoid conflicts with archeology.
- Third, the contractor’s outstanding efforts to communicate with the conservation committee regarding the management of archeology helped expedite the processes and make up for some of the delays.
- Finally, as we saw in our Green Line Extension case, due to the lack of experience with the contracting method, in this case the FIDIC Silver Book, both the agency and the contractor were slowed down following specific procedures, consequently increasing costs. Ideally, the contractor, and if not, the consultants should be knowledgeable about the specific type of contract intended to be utilized in construction projects.
Timeline and Financing
Marmaray’s history goes back to the later years of the Ottoman Empire. In 1892, Sultan Abdülmecid II hired French engineers to design a tunnel connecting the two banks of Istanbul (TCDD Taşımacılık n.d.). While the project was never completed, the plan proposed building a tunnel supported by columns driven into the seafloor (Figure 13). Nearly 100 years later, in 1987, President Turgut Özal commissioned the first feasibility study which analyzed alternatives and determined the current right of way.
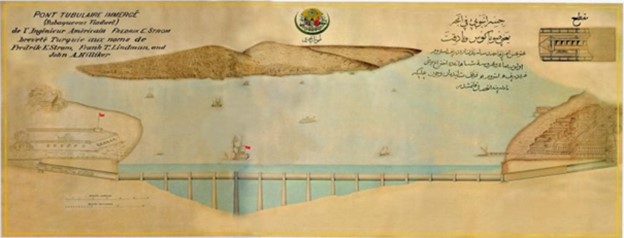
figure 13. One of the earliest depictions of a tunnel crossing the Bosphorus (Marmaray Hakkında n.d.)
The project was put back on the agenda in 1999, when an advance loan agreement was signed between the Turkish Undersecretariat of Treasury and Japan Bank for International Cooperation (JBIC) for $234 million PPP (¥12.5 billion), $63 million PPP (¥3.371 billion) of which was to be spent on the CM contract and $171 million PPP (¥9.093 billion) on building the Bosphorus Crossing (Table 14). This agreement required that the CM and construction contracts of BC1 follow rules established by the Japan International Cooperation Agency (JICA). This meant that only firms from countries on Japan’s list of Official Development Assistance Countries were permitted to bid on these two tenders and all critical stages of the tender and the contracts were to be overseen by JBIC.[44]
Also, the maintenance and operation of the line following the completion of the project was to be carried out by a Project Implementation Unit created by the Ministry of Transport, Maritime and Communications (Turkish Ministry of Transport, Maritime and Communications [TMTMC] 2013).
A CM contract worth $66 million PPP (¥5.5 billion)[45]
was signed with Avrasya Consult consisting of Oriental Consultants from Japan, Yüksel Proje and Japan Railway Tech Service on March 14th, 2002, after which specifications, contract drafts, feasibility studies and tender documents were prepared. After the CM contract was signed, deep water drilling for tests began. On June 6th, 2003, BC1 tender documents were delivered to the pre-qualifying contractors and their offers were received on October 3rd. The contract was awarded to the Japanese-Turkish joint venture TGN on May 9th, 2004.
Table 14. Marmaray’s timeline
| Date | Item |
|---|---|
| 09-17-1999 | First loan agreement between JICA and Treasury for $234 million PPP. $63 million PPP for the CM contract and $171 million PPP on BC1. |
| 03-14-2002 | CM Contract signed with Avrasya Consult. |
| 05-09-2004 | BC1 Bosphorus Crossing Contract signed with Taisei - Gama - Nurol (56-month period). |
| 10-04-2022 | BC1 construction starts. |
| 02-18-2005 | Second loan agreement with JICA and Treasury for $1.4 billion PPP. |
| 2005 | Archeological artifacts unearthed |
| 12-21-2006 | TBMs start tunneling Ayrılıkçeşme and Yedikule tunnels |
| 04-09-2022 | First contract period is up, project seriously behind schedule. Taisei wanted out as they would be losing money due to inflation. |
| 01-10-2022 | A cost escalation executive order was passed by the approval of the prime minister, a first in Turkey. |
| 11-22-2010 | Third loan agreement with JICA for $783 million PPP. |
| 08-04-2013 | First test run through Marmaray tunnel |
| 10-29-2013 | Service starts between Ayrılıkçeşme-Kazlıçeşme through the Bosphorus tunnel. |
| 2014 | Construction completed. |
| 03-21-2019 | First international trains run through Marmaray. The passenger train set that’ll run between Baku and Ankara departed from Halkalı, passed through Marmaray tunnel and continued to Baku. |
Initial excavations for the archeological surveys started in June, 2004, at the Üsküdar station site. In February 2005, the negotiations between the Treasury and JBIC on an Official Development Assistance (ODA) loan was finalized and a 40 year-term, 0.75% interest rated loan of $1.4 billion PPP (¥98.7 billion) was granted to Turkey for the Marmaray Project (TMTMC 2013).
Soon after the beginning of excavations, remains of houses and market gardens from the Ottoman and Byzantine periods were revealed. The most stunning discovery however, was the 58,000-square-meter archeological site uncovered in Yenikapı which had been designated for the construction of both the underground stations of Marmaray and M2 metro line’s extension between Taksim and Yenikapı. By the time the Marmaray excavations were completed in June 2009, 34 shipwrecks dating back to the 11th century confirmed the theory that the area had been a Port of Theodosius in the Byzantine Empire. An early Byzantine church and part of Constantinople’s first city walls had also been discovered (Boninin Baraldi et al. 2019). The tunnel excavations could not begin until December 2009. M2’s excavations had also revealed a Neolithic-period village dating back to 6000 B.C and the station construction couldn’t start until June 2012.
By April 2009, which marked the end of the initial 56 months, there had been serious increases in material and equipment costs due to inflation as archeological discoveries had delayed work schedules extensively. Within this timespan, only the immersed tunnels had come close to being completed. The Japanese contractor Taisei wanted out unless the contract was amended or renewed. In January 2010, a cost escalation executive order was passed by the approval of the prime minister, a first in Turkey. The contractors added a percentage to all item costs and through this, could retract several of their claims. The Chief Representative of JICA, who had been involved in the project since 2001, emphasized the significance of this decision for the project and issued the following statement, “If the Turkish parliament had not approved the increased construction contract amount to accompany delays from the historical ruins survey, construction might have been interrupted” (JICA 2014).
In November 2010, a third loan agreement of $783 million PPP (¥42.08 billion) was signed with JICA with the same interest rate and payment conditions as the previous agreements; with a 40-year payback timeline, a 10-year grace period and a 0.75% yearly interest rate. Our estimate for the total cost of financing including the interest and fees for the BC1 loans from JICA add up to 20% of the total loans or $430 million PPP, based on the evaluation of the loan conditions by a financial expert specializing in international infrastructure investments (Personal Interview W 2021).
CR3 was financed by the European Investment Bank (EIB) with a €650 million loan granted in two installments: $447 PPP in 2004 and $958 million PPP in 2006. An additional loan of $472 million PPP was granted by the Council of Europe Development Bank (CEB) in 2008. Later, the total value of loans granted by CEB to the project reached $1.7 billion PPP (Council of Europe Development Bank [CEB] n.d.).
Scope and Contracts
DLH, under the Ministry of Transportation, awarded the construction contract to the TGN consortium through a tender. GN built the stations and the Yedikule (Kazlıçeşme) -Yenikapı 2.2-kilometer twin tunnels using a single EPB TBM, Taisei undertook the rest of the tunnel construction including two 8-kilometer twin-bore tunnels built by two slurry TBMs, as well as the immersed tube tunnel of 1.4 kilometers crossing the Bosphorus Strait (Figure 14). Ayrılıkçeşme station was partially constructed within this project’s scope, and partially through the M4 Kadıköy-Kartal line’s contract. The signaling system was within the scope of the CR3 Commuter Rail Infrastructure and Systems Contract, and together with the Automatic Train Protection systems cost $470 million PPP. Undertaken by Invensys Rail Dimetronic, CR3 also included the systems for the 63-kilometer commuter tracks (See Tables 15 and 16 for BC1s scope and contracts).
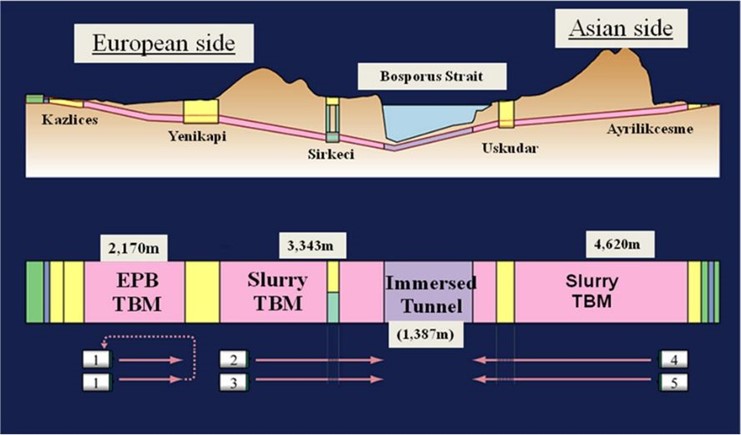
figure 14. BC1 tunnels drawing from Emergency Ventilation Systems Cold Flow & Cold Smoke Tests (Tabarra and Özince 2015)
Even though a lump sum pricing model requires the contractors to bid high to be able to bear the general risks, due to BC1 being a project of national significance, a standardized, Engineering Procurement and Construction contract template outlined in the FIDIC Silver Book was utilized to ensure a smooth project delivery. However, this was a first for the use of a FIDIC Silver Book based template, and it wasn’t utilized afterwards, due to the extensive risks placed on the contractor and the increased costs arising from the contract requirements. An example of these risks that the Silver Book assigns to the contractor is unforeseeable ground conditions. In the case of Marmaray BC1, DLH was the responsible party for the costs related to the archeological findings which were the primary reason for severe delays and cost increases. Nevertheless, the contractor lost between $180 and $280 million PPP due to the contract protecting the agency against the majority of the risks including cost increases arising from delays and other complications (Personal Interviews K 2020, and M 2021).
The use of FIDIC standards was mandated by the credit-granting institution, JICA, and FIDIC standards called for the implementation of a number of measures that we do not see in any other rapid rail project in Istanbul. Firstly, the HSE mitigation measures as well as Quality Assurance and Quality Control (QA/QC) processes were implemented at a very high standard. Secondly, an independent design verification engineer was hired by the contractor reporting directly to the agency. This was a separate entity from the CM and was a consortium of Turkish and foreign firms. Thirdly, a dispute adjudication board (DAB) was established, the $9 million PPP cost of which was covered 50%-50% by the contractor and the agency. Due to the technical requirements brought on by an immersed tunnel and a mix of commuter, high speed and freight traffic planned on the line, the unit costs in this project were higher than the national standard unit costs utilized in subway projects.
Both the timeline and the costs of the project almost doubled. The construction contract was initially 56 months, at the end of which the contractor was granted an extension for 42 months, and then another for 37 months. Following this final extension, the contractors completed construction within 12 months, not using the remaining 25 months they had, making the total duration of construction 110 months (56+42+12). The first contract cost $1.4 billion PPP and the extension of 42 months for the completion was granted through a supplementary agreement approved by the central government that was worth $780 million PPP. With the addition of price adjustments, change orders and claims, the final price tag of the construction contract reached $2.7 billion PPP, excluding the commuter rail phase, rolling stock, systems contracts and financing costs (Figure 15).
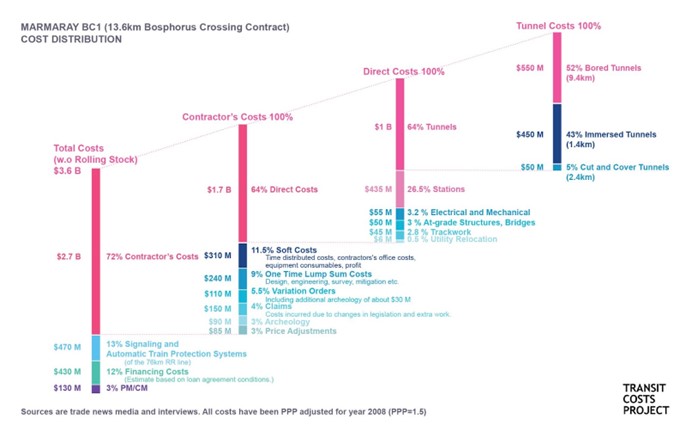
figure 15. Capital Costs Breakdown of Marmaray
Table 15. Marmaray’s Scope
| ELEMENT | SCOPE | FEATURES |
|---|---|---|
| Guideway | • Immersed tunnel going under the Bosphorus and TBM tunnels to connect the existing commuter lines of Gebze- Haydarpasa and Sirkeci-Halkali | •100% Underground elements • Partially shared corridor with high-speed rail |
| Track | 2 new LVT tracks to be shared between high speed, commuter and freight trains. | |
| New Stations | 3 new underground stations (100,000 m2 total) • Yenikapı • Sirkeci • Üsküdar Partial work on the at-grade Kazlıçeşme and Ayrılıkçeşme stations. Ayrılıkçeşme (Ibrahimaga) station was within the scope of the M4 line. (CR3 includes 35 existing surface stations to be renovated) | • Yenikapı Tube Station: 245m long, 24 m deep • Sirkeci Station: 225m long, 60m deep and 22m wide • Üsküdar station: 300m long, 30m deep, 30m wide • Ventilation shafts of 25,000 m2 in total: - Yedikule ventilation shaft: 90 m long and 14 m deep - Yenikapı ventilation shaft: 135 m long and 20 m deep - Ayrılıkçeşme ventilation shaft: 80 m long and 20 m deep |
| Tunnels | • Total of 9.7-kilometer twin-bore tunnels • 1.4-kilometer immersed tunnel (Dept: 58 m) • 444m of NATM tunnels • 1080m of out of the track route | Track Route Tunnels: • TBM 1 (EPB): 2.2-kilometer tunnel bw Kazlıçeşme and Yenikapı • TBMs 2 & 3 (SLURRY): 3.3-kilometer tunnel bw Yenikapı and Sirkeci • TBMs 4 & 5 (SLURRY): 4.6-kilometer bw Üsküdar and Söğütlüçeşme • Cut and cover tunnels: Yenikapı and Üsküdar station tunnels • NATM tunnels: Sirkeci station and Üsküdar crossover tunnels Tunnels Out of the Track Routes: • TBM: 120 • NATM: 960 |
| Bridge Structures | 2000m of at grade and C&C bridge structures | • 28 m span Yedikule steel railway bridge structure • 19 m span Ayrılıkçeşme steel railway bridge structure • 22m span Yedikule highway bridge: pre-stressed precast • Kosuyolu highway bridge • Dr. Eyup Aksoy intersection arrangement (2 overpasses and one grade road repair) |
| Systems | • Traction power supply system • Overhead catenary system • SIRIUS CBTC, ERTMS signaling systems • Telecommunication system • SCADA system • Operation control and administrative centers • Electrical distribution system | |
| Support Facilities | • Depots • Stabling yards for the intercity and commuter rails • Workshops |
Table 16. Marmaray Contract Cost
| Contractor | Scope | Cost | Year | USD with PPP |
|---|---|---|---|---|
| Oriental Consultants (Japan), Yüksel Proje, Japan Railway Tech Service | • Control/supervision, engineering and consulting | ¥ 5,500,000,000.00 | 2002 | $66,000,000 (we estimate a 100% increase, thus a $130 million final price tag, due to the doubled timeline) |
| Taisei (Japan) - Gama (Turkey) - Nurol(Turkey) Joint Venture | BC1 - Bosphorus Crossing Engineering/design, procurement and construction of 13.6-kilometer railway and related structures: • 9.4-kilometer twin bore tunnels • 1.4 immersed tunnel • Underground and surface stations with cut-and-cover and NATM tunnels • Bridges | ¥ 102,372,748,108.00 | 2003 | $2,400,000,000.00 ($2,7 million after the claims, variation orders and price escalations) |
| Invensys Rail Dimetronic | Signaling and Automatic Train Protection systems. (Within the scope of the CR3 contract) | €195,000,000 | 2011 | $407,000,000 |
| Hyundai/Rotem (S.Korea) | CR2 - Rolling Stock Contract Engineering/design, manufacture and delivery of 440 rail cars: • Testing and commissioning of the new rolling stock, • Training of the Employer’s staff in train operation, • Provision of spare parts and maintenance of railcars for defined periods. | €543,000,000 | 2008 | $1,181,000,000 |
Unprecedented Challenges
Many aspects of Marmaray demanded unique planning and management solutions, on top of which, archeological discoveries brought on immense unanticipated challenges for the contractors and DLH. The environmental impact assessment (EIA) process was longer, mitigation measures mandated by the contract were much more stringent and the management scheme had more layers of oversight and approval than that of a regular metro project. In addition to the JV, CM, and DLH, there was also a Dispute Adjudication Board, an Independent Design Verification Engineer, and a separate Technical Assistance Team. Furthermore, the Museums Directorate became almost as significant a stakeholder as DLH in the project. These led to cost increases and delays, but most importantly revealed the shortcomings in legislation and organization of the agencies involved in the management of infrastructure projects. Some of the negative consequences such as the coordination problems with the Museums Directorate in regards to the management of archaeological discoveries were overcome within the timeline of the project; solutions such as the requirement of a more specific geomonitoring plan prior to the start of construction was adopted in later rail construction contracts; while some including the lack of a framework for dealing with archeology during infrastructure construction still persist to this day.
The EIA process was unlike that of a standard metro line, as the scale, scope, contract and implementation of the project varied greatly from a metro project. The initial feasibility and EIA studies were conducted in 1998 (Personal Interviews Z and AA 2021) and the construction contract was awarded in 2004, which is a long timeline for the planning of a rapid rail line in Istanbul. While we do not have the exact dates of the EIA process or whether an environmental impact statement was issued, the mitigation measures implemented during construction reveal that these processes were not expedited, as is done for metro lines in Istanbul, but involved meticulous study.
The geotechnical planning of Marmaray also differed from metro projects at the time. IMM started requiring geological analysis reports regarding the impact of planned construction to surface structures from metro contractors only after 2014. Before that, this was not mandatory and rather than detailed preliminary surveys and the reinforcement of buildings before construction, repair costs were paid if a building was damaged during construction. For Marmaray, on the other hand, despite being a project that pre-dates this regulation by a decade, the contract required a Risk Assessment Mitigation Plan covering HSE mitigation measures from the contractor. It was determined through this analysis that the TBM tunnels were in close proximity to 158 old buildings in structurally problematic conditions. The combined risks posed by Istanbul being in the earthquake zone and the impact of ground vibration to be generated by the TBMs on these buildings required preliminary tests that would determine whether to demolish or reinforce them.
The dispute adjudication board (DAB) which had been set up as a requirement of the FIDIC Silver Book was helpful in resolving disagreements between the agency and the contractor, but often ended up bringing on unanticipated costs and delays to both parties. The disputes arose from the agency initially presuming that all costs be accounted for in the lump sum bid and wanting to charge all risk to the contractor. Later, as they came to a mutual agreement on getting the project done, such conflicts were overcome. Nevertheless, the disputes cost the contractors about $45-75 million PPP and more importantly, lost them time (Personal Interview M 2021).[46]
One costly and time-consuming disagreement was in regards to the 158 buildings that the Risk Assessment Analysis found to be within the impact area of the BC1 corridor. The contractor claimed that the costs related to the protection or demolition and rebuilding of these should be borne by the agency. The DAB referred to the Silver Book and concluded that if after the contractor carried out a structural analysis and determined that a building was near-collapse and that it should be demolished, the agency would pay for the demolition. If, on the other hand, a building could be supported, the contractor would be responsible for its reinforcement. Gama-Nurol spent $5.2 million PPP to reinforce or repair buildings between Yedikule and Yenikapı and relocate residents during construction. Additionally, they had to run on-site simulations and install extra layers of window panels to the hotel rooms around the Sirkeci and Yenikapı station sites for noise mitigation.
Today, geomonitoring of the buildings that fall within the impact boundaries by a rail line construction is a requirement for all projects. The contractor’s designer provides a geomonitoring plan and, before starting construction, the contractor visits all buildings under risk with a notary and records existing damage to avoid conflicts later. Allowable settlement limits are determined by the monitoring design, so it varies across projects, sites and buildings. Once the construction starts, the damage risk is on the contractor.[47]
More demanding mitigation measures and inexperience with the Silver Book contract undoubtedly burdened both the DLH and the TGN, but the main reason behind the doubling of costs and construction timeline was the discovery of archaeologically sensitive sites at the station locations. With the heavy construction equipment on site, ready to start excavations, the overhead costs kept adding up while waiting for the completion of the archeological work. These time-distributed costs increased by more than 200%, from around $100 million PPP to $310 million PPP. $120 million of this increase was due to the price adjustment applied to make up for the cost increases resulting from inflation through the long delays in the construction schedule.
Major design revisions were required due to archeological findings at all station sites. Station layouts including the entrance locations had to change to protect archaeological remains that were to be conserved on site rather than removed. The longest archeological digs which were at Sirkeci and Yenikapı Station sites lasted 76 months. They took six months at Ayrılıkçeşme, 37 months at Üsküdar and four months at Yedikule-Kazlıçeşme (Personal Interview K 2020). During the excavations, construction at the site stopped, and as the digs were completed section by section, the teams could go back in and continue construction. Hence the station excavations slowed down drastically.
The archeological excavations were outsourced to TGN by the Ministry of Transit.[48] So even though TGN was compensated for the overheads, profits, and roughly a 22% commission for the indirect costs of aiding the archeological work, the unanticipated schedule delay that resulted from this work ended up eroding TGN’s profits. An example was the job of purchasing for the archeological team, including materials from office supplies to trowels, brushes and spoons (Personal Interview M 2021) which was cumbersome; no matter the scale of the purchase, three quotes were required for every item with the lowest bid selected as required by the contract. Total costs for archaeology were $120 million PPP, but ultimately the work ended up costing the contractors much more when accounting for increased overheads due to delays. One senior manager who directed the QA/QC for the project explained: “If you spend $10 on archeology, you will most likely get $3-4 back with claims. It is very difficult to plan for archeology. Losing time means losing money: you pay $100,000/month for a tower crane, once you’ve leased it, you keep paying for it even if construction has to stop” (Personal Interview M 2021).
Throughout the archaeological excavations on the project site, the contractors were required to present reports to the project committee at the Museums Directorate and wait for their approval before proceeding with work. This process would take three to four months during which construction had to wait. The contractor eventually adopted a different approach to expedite the processes that involved coordination with the committee. They hired academic experts to help them prepare for the meetings and visited the committee offices regularly to avoid missing necessary procedures and better understand their concerns. These meetings guided their work and reports, ultimately preventing delays. The contractor also made the archeological team’s life easier by purchasing its material and tools without waiting for approvals from the agency, even if this meant that sometimes the items wouldn’t be fully reimbursed by DLH. Our interviewee concluded that the contractor spending an extra $5,000 to $10,000 to make these arrangements possible, ultimately saved them months of delays, and consequently, a lot more money than those extra costs (Personal Interview M 2021).
The delays caused by the archaeology extended to the CR3 work as well. Haydarpaşa Terminal’s depot area to be used for Marmaray’s rolling stock is still being renovated as of 2022. The archeological remains found at only 50 cm below the surface are from four different time periods; late Roman, Byzantine, Ottoman and early Turkish Republic. These excavations have been going on for over four years. It is not unusual to uncover archeological heritage during infrastructure construction in a city like Istanbul; Kabataş and Beşiktaş metro excavations also revealed remains. Despite the numerous examples of unearthing archaeologically significant sites during excavation, which drive delays and costs, there is no standard framework for managing construction at these sensitive sites.
The city of Rome’s approach to dealing with the archeology that is discovered during excavations of rail construction is a good example that Istanbul, and other cities which need to manage historical heritage alongside infrastructure work, can benefit from. The Roman protection agency, Sovrintendenza ai Beni Archeologici, came up with a set of guidelines Prontuario Archeologico around 2010-2011 to manage the archeological excavations for remains discovered during metro construction projects. These guidelines, agreed upon by all the stakeholders at the time they were being compiled, provide directions to devise practical handbooks for how to deal with stations, shafts and ways to proceed in case of major findings. In a city like Istanbul where it is common to discover archeological remains during metro excavations, such a guidebook would be invaluable.
Another management challenge that Marmaray’s contractors and the DLH faced was political pressure from the central government, which also led to cost increases. The ministry demanded that the BC1 be completed in time for the celebrations of the 90th anniversary of the Turkish Republic, on October 29, 2013, and indeed, the line opened to revenue service on the date. The east shaft of Sirkeci station was not complete at the time of opening; the fans in this section were installed and the ventilation system tests were completed in 2014. While this, together with the phased opening of the line as BC1 and CR3 was considered a safety issue by some trade unions, a tunnel ventilation expert we interviewed stated that the incomplete tests and certification only concerned the freight operations, which wouldn’t go into service until 2019 (Personal Interview AA 2021).[49] The majority of the additional costs incurred paid for the construction of a temporary command center at the Üsküdar station, which enabled the BC1 section to operate before the 65-kilometer commuter section was complete, and was later transferred to the commuter line’s Maltepe station.[50]
The DLH concluded at the completion of BC1 that had it worked with a contractor who had experience with navigating archeology, DLH could have avoided such a large cost increase (Personal Interview M 2021). On the other hand, a study of the management scheme of the archeological excavations reveals that ad-hoc approach to managing these events; the lack of legislation on protection of archeology discovered during infrastructure excavations, combined with the extreme centralization within the Ministry of Culture and Tourism prohibited the hiring of temporary staff by the Museums Directorate and this led to a “multi-layered outsourcing approach” to deliver human and financial resources in the Marmaray (and M2) archeological excavations (Bonini Baraldi et al. 2019). This inevitably “increased the overall complexity, cost, and level of conflict within the system” (p.439)”
Everything Cost More
At the time of its construction BC1 was the deepest immersed tunnel project in the world among 150 similar projects, including BART, Hampton Road, Baytown, Baltimore Channel, Parana and Tama Tunnels (Personal Interview K 2020). Additionally, the water current speeds at the upper layers of the Bosphorus Strait were 2.5m/sec and 1m/sec at lower layers, in opposite directions. From the costs of tunneling and ventilation to the tracks installed, multiple components of the Marmaray project were more expensive than that of a regular subway (see Figure 15). The line had larger diameter tunnels, longer platforms and had to be resistant to higher temperatures in case of freight fires as it would serve mixed traffic. Moreover, the tunnels came close to the surface around residential neighborhoods and track vibration had to be minimized to prevent noise pollution. To make up for the extensive delays in the schedule due to archaeology, work had to be expedited which also increased costs.
Marmaray’s tunnels were more expensive due to their diameter and passive fire resistance requirements. Since they were designed to accommodate freight as well as high-speed and metro trains, the tunnels have 8-meter external diameters, which is larger than the 6.3-meter wide (5.7-meter internal diameter) metro tunnels in Istanbul. Freight trains demanded the design of the system for higher intensity fire risk and also necessitated larger evacuation corridors. As a result, the TBM tunnels cost approximately $60 million PPP/kilometer, almost double the cost of standard metro tunnels in Istanbul.
The concrete used was required to have the same specifications as the Öresund bridge in Denmark: it had to have a useful life of 100+ years and no early age cracking. This level of specification was uncommon and expensive. Gama-Nurol set up a $5.2 million PPP concrete testing lab at Istanbul Technical University. Marmaray was the first project in Turkey where concrete temperature monitoring and cooling was implemented. Although Taisei initially planned to manufacture its own concrete, it ended up using the concrete manufactured by GN for the immersed tube tunnels as this concrete performed better in tests. Having acquired the experience, Turkish contractors now undertake immersed tube tunnel projects around the world.
Another reason for costlier construction was the urgency with which the contractors had to operate in, to avoid further delays after the discovery of the archeological remains. To facilitate faster drilling of the tunnels, the contractors used a 12-bar slurry TBM, and instead of sand-grout, an AB component system based on sodium silicate in spite of higher costs (Personal Interview N 2021). This system is not utilized in other metro tunnels in Istanbul. The fire proofing material which consisted of panels for the immersed tunnels and was sprayed on for the others which are usually $155 PPP/square meter, cost over $220 PPP/square meter to facilitate speedier construction.
BC1’s unique ventilation and fire protection design was a result of a number of specifications mandated by the contract on top of those mandated by Turkish rail construction standards. The differences in this aspect between projects in countries that use similar standards such as the NFPA 130 occur, because of the additional and unique technical specifications each administration requires that a project satisfies (Personal Interviews R and S 2021). The differences between projects in the US and Turkey, for instance, are an example of this. Even though both utilize NFPA 130 standards, the emergency ventilation and egress systems are designed for more stringent measures in the US. Similarly, Marmaray was different from regular metro projects in Istanbul due to its contract’s particular specifications. The fire-resistant tunnel coating and the high capacity of the ventilation required by the contract led to unique and cost intensive fire protection and ventilation design solutions.
First, additional tunnel coating for passive fire protection was required due to the addition of overnight freight trips. Moreover, the ventilation fans needed to be designed to maintain operations in temperatures as high as 250℃, or 482℉. The tunnel’s coating was designed to provide a minimum of four hours of resistance for 100 Mw fire. Istanbul’s other metro tunnels are designed to withstand 23 Mw or lower fires. Thus, for BC1, the specifications called for concrete that would stay intact at oil-burning temperatures that are four times hotter than the fires subway concrete is designed to resist. This extra fire-resistant coating was one of the major cost drivers for Marmaray and is not utilized in subway projects since concrete itself is known to be resistant to regular subway fires. However, the technique implemented in Marmaray’s construction was later applied in the Eurasia road tunnel as well as other projects across Turkey.
Second, BC1’s 225-meter long platforms added costs by increasing station-box volumes and the capacity of station MEP finishes. The longest metro platforms in Istanbul are 180 meters. BC1’s 25%-longer platforms meant longer construction times and more earth needed to be excavated and disposed off, all of which added costs. The inclusion of high-speed rail and less frequent service plan, with minimum headways going from 90 to 128 seconds, the platforms had to be widened to accommodate the increased volume of passengers waiting on the platforms (Personal Interview M 2021). Additionally, the larger diameter of the tunnels compared to regular subways increased their volume by 60%. This meant that each BC1 station needed four to eight tunnel ventilation fans, whereas most Istanbul metro stations have four, and large shafts to house station technical spaces that connect to freestanding surface ancillary structures (Figures 16-17).[51]
Third, the contract required the ventilation system to be designed to operate at the minimum air temperature of -20℃ for which the ventilation capacity had to increase even further, due to air getting heavier at lower temperatures. According to a tunnel ventilation engineer who worked on the project, this additional capacity was uncalled for, as air temperatures in Istanbul almost never reach such extreme lows (Personal Interview AA 2021). Nevertheless, the agency could not be convinced to change what the consultants had specified in the contract early on.
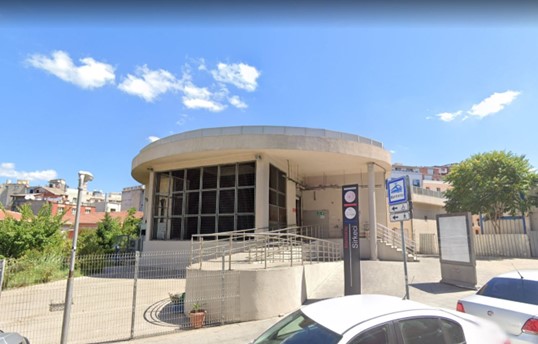
figure 16. Marmaray’s Sirkeci Station east ventilation shaft (Google Maps a).
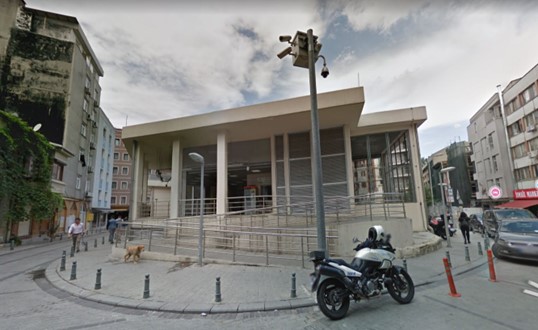
figure 17. Marmaray’s Sirkeci Station west ventilation shaft (Google Maps b).
Some unique components of the line being implemented for the first time in Turkey or even in the world, were also major cost drivers. The 1.4-kilometer-long immersed tunnels 58 meters under water cost $450 million PPP. Track construction was also expensive because low vibration tracks (LVT) were preferred throughout the line due to some sections’ proximity to the surface. They also had to be compatible with freight, high-speed rail, and metro trains. They cost $45 million PPP.
Land Acquisition
In Istanbul, agencies dislike allocating time and resources to land acquisition processes which are carried out prior to the construction tender, and this played a role in further complicating the construction process of Marmaray’s Sirkeci station. Generally, in Turkey, the agency buys the land from the owner at market value. If the parties cannot agree, they go to court, which can take at least two years to resolve. This is also the kind of conflict that will likely receive media attention, which both the agency and the contractors want to avoid. Because Istanbul is densely built and several lines are being constructed at the same time, avoiding land acquisition is a priority in designing the right of way and selecting station locations. This does speed up the initial phases but is not ideal; stations are often built-in parks, gardens or other empty land where they become harder to access from major residential or job centers, thus reducing the efficiency of transit systems.[52]
During the construction of the entrance and ventilation shaft structures of the Sirkeci deep tunnel station, an archeological site could have been avoided by acquiring a few nearby buildings, but the building owners objected strongly, which meant the process would be costly and time consuming. Rather than embarking on a contentious condemnation process, the agency and contractors preferred to deal with the costs and delays posed by archeology (Personal Interview M). All of this could have been avoided, had a more extensive initial survey of the site been conducted prior to the construction tender and the alignment been revised, or a framework addressing the management of archeological sites during infrastructure projects was available that also addressed land acquisition conflicts.
Another lesson that the Marmaray Project taught the agencies building rail in Istanbul was that the private contractors do not have the leverage the state has when it comes to land acquisition. In the Commuter Rail Phase (CR3) of the project, which involves 63 kilometers of at-grade commuter rail rehabilitation and addition of a third track to the system, acquiring land was initially a part of the construction contract. According to a senior engineer we interviewed, the arduousness of this task was one of the reasons why the contract had to be canceled and re-awarded to different contractor teams twice (Personal Interview I 2020). Eventually, the agency took the expropriation job on themselves.
Staffing and Internal Capacity
Unlike the standard metro projects in Turkey that are known to employ smaller management teams compared to the teams of rail projects abroad, Marmaray’s construction was managed by a number of larger teams.[53] This was both a requirement of the FIDIC Silver Book, and the complexity and prominence of the project necessitating a bigger management team.
For the BC1 Phase, the Ministry of Transit allocated between 30-50 staff members to DLH including everyone from cleaning staff to regional directors. Avrasya Consult hired as the CM employed 50-100 people, which would be considered high for a metro project of the same length but was necessary because they were managing and coordinating three contracts at the same time.[54]
Between 2004 and 2009, a separate Technical Assistance Team (TAT) of 5-10 people were hired to manage the DLH’s relations with the CM and the contractor. At the end of the first 56 months, the TAT was dissolved, since the agency felt that they had enough experience to handle the operations internally.
The contractor was responsible for their own QA/QC team, and additionally they appointed a Verification Engineer for every major work group like construction or electromechanics who made sure production was carried out in accordance with the design. The contractor also required a minimum of one HSE staff and one QC supervisor from large subcontractors, so in total, 30 HSE staff worked on the project.
Quality Standards, Contingency and Profit
There has been a paradigm shift in Turkey over time: cultural heritage and environment are valued highly and mitigation measures are taken more seriously. As a megaproject, Marmaray was a milestone in terms of raising standards and dealing with these issues during infrastructure construction. According to the contractor’s QA/QC manager, the contractor developed an internal quality-control method to catch and address any construction irregularities (Personal Interview M 2021). For example, both a tunneling and a TBM expert were on site weekly to provide oversight and open nonconformance reports (NCRs), that are normally filed by CMs to document deviation of work from design specifications. They were opened by the contractor’s own quality control staff to prevent the CM from opening them. This was preferred as it would take longer to close the NCRs opened by the CM, which meant the progress payments and consequently, the construction would be delayed. None of these are common practices in Istanbul’s metro construction processes.
Turkey still spends less time and money on environmental impact analysis and mitigation, occupational health and safety measures and community engagement than the United States and Europe. Putting aside Marmaray as an exception, local experts in the field agree that the agencies should do a better job enforcing protective regulations, CMs should put more pressure on contractors and contractors should make more of an effort on these fronts. On the other hand, avoiding unnecessary delays through easing bureaucracy seems to be a strength of Turkish agencies, which contractors we spoke to appreciate especially when comparing their experiences in Istanbul to those abroad.
According to our interviews, when bidding on contracts, contractors will often propose contingencies less than 10% so they can submit more competitive bids. In the case of an immersed tube project, contingency and risk should account for at least 10% of the contract value. As these items cannot be explicitly shown in the itemized costs, risk is added as 10% and profit as 3% onto each item. In the case of BC1 an additional 5-10% was added on top of claims, change orders and archeological spending for contingency and profit, as this work constituted a serious burden to the contractor. Experts estimate that a total of 15% profit was gained from Marmaray and this is considered a high percentage when compared with the profit margins of rail projects in Turkey today. In total, 13% profit is considered good, but this number can go down to 4-5% depending on contingencies.
Lessons Learned
The design, planning, management of the HSE conditions as well as the QA/QC processes were carried out to an exceptionally high standard in the construction of Marmaray; which enabled this immensely challenging project to be completed without major technical flaws. On the other hand, lack of experience and established mechanisms to manage archeological discoveries during rail construction projects proved to be costly and led to extensive delays. Ultimately, despite all the significant cost drivers, Marmaray BC1’s construction costs remain only 14% above the average PPP $210 million/kilometer among the projects in our urban rapid rail costs database.
Legislation regarding HSE impact mitigation changed in 2012, during Marmaray BC1’s construction, but since the project had adopted a higher standard from the outset, no changes needed to be made. The contractor required and made sure that subcontractors abided by their occupational health and safety standards. We understand from our interviews with the senior management staff of the contractor that these measures were costly but paid off as the BC1 phase was completed with no fatal occupational accidents and set an example for other projects in the city in terms of HSE and QA/QC management (Personal Interviews K and M 2020).
BC1’s construction involved managing several teams with large numbers of staff, which was carried out meticulously. Engineers who were hired to do constructability reviews of the design were graduates of top engineering programs in Turkey. Designer team’s representatives were required to go to the site once a week. QC and site engineers were not permitted to become close acquaintances. The contractor paid bonuses at milestones to lower turnover and increase efficiency, as there was a lot of construction work available at that time, not only in Turkey, but all over the world. The contractor also required the subcontractors to keep their staff turnovers below 5-10% to save training time. 30 occupational safety and health engineers worked on Marmaray unlike regular subway projects in Turkey, which employ 10 or fewer HSE staff.
The management of construction alongside extensive archeological excavations was one of the toughest challenges dealt with in Marmaray’s BC1 Phase. Clever coordination with the Museums Directorate proved to be key in saving time and money; however, legislative and administrations’ organizational shortcomings in managing archeological excavations alongside the construction of a mega-infrastructure project in Turkey led to an increase in the complexity of operations; thus, delays and cost overruns were inevitable.
The cost of professional services like surveying, design and engineering together with mitigation in Marmaray (See Figure 15) were very high compared to other infrastructure projects in Turkey; they made up 9% of the contractor’s costs. But according to a design director who worked with both contractors of Marmaray’s BC1 phase and who also has experience working in metro construction projects abroad, the level of risk taken versus the time and money spent on HSE mitigation measures as well as quality control in the Marmaray project was optimal (Personal Interview G 2020). Moreover, the engineers and experts having worked on this and other rapid rail projects in Istanbul whom we have interviewed agree that Marmaray is an example of best practices in terms of developing a good final design, planning for HSE mitigation, applying quality standards and adopting competent technical and managerial expertise.
4.3.4 M9 Ataköy-İkitelli as a Recent Project
Overview
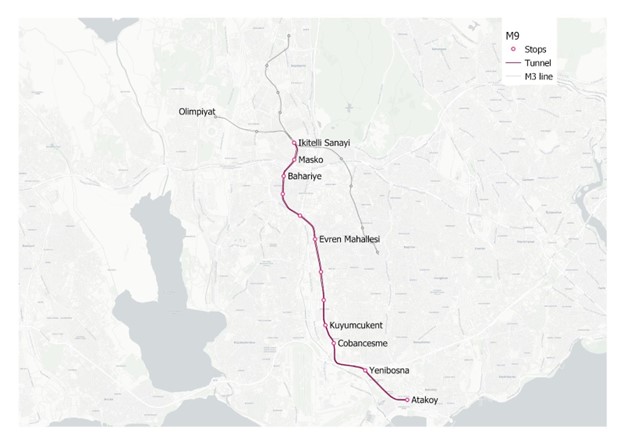
figure 18. M9 Ataköy – İkitelli Metro Line.
M9 Ataköy-İkitelli is an under construction 13.4-kilometer-long, 12-station line on the European side of Istanbul, connecting the city’s rapid rail network (Figure 18). Transfers are planned with Marmaray, M1A, M1B, M2, M3 and M7 metro lines. The right of way passes M3’s İkitelli station near the İkitelli Industrial Park, follows the Basın Ekspres Highway that connects the TEM and D100 highways, and ends at Ataköy Station. The route goes through both commercially and residentially dense neighborhoods, and aims to relieve congestion on the Basın Ekspres corridor, TEM and the D100 highways. The owner agency is IMM.
As our final case, M9 demonstrates how after years of agencies, contractors and consultants muddling through rail-construction projects, they now know what they need to do and have established mechanisms to efficiently build rail lines at a fraction of the cost of their international counterparts.
We selected M9 for a number of reasons, first, it is on track to cost $95 million PPP/kilometer.[55] Second, it is a contemporary project. Construction began in 2016 and as of May 2021, it was 70% complete. Additionally, all preliminary planning, procurement and supervision of the final project, management of the consultants and coordination with third parties have been carried out by the Rail System Projects Directorate; an experienced department with improved internal capacity.[56] Furthermore, it was one of the first rail projects in Turkey to integrate BIM into all stages of planning and construction.
This project exemplifies the benefits of cultivating a rail construction eco-system for a city and the effective use of technology in dealing with technical challenges during the planning and design stages of a rail project. Despite the contractor’s lack of experience building rail projects, a national economic crisis that started in 2018 and a change of municipal government resulting in a slowdown of construction for 11 months; the work on M9 rapidly resumed and the line partially opened to revenue service in mid 2021 without foreseeable cost overruns.[57] We believe that the expertise and know-how acquired by the municipality as well as the designers, consultants and subcontractors working in the field through the last 20+ years of urban rail construction made it possible for the Ataköy-İkitelli project to stay on track. Also, the full integration of BIM in all processes of the design and construction helped resolve technical problems, especially those related to integration with other lines avoiding cost overruns and further delays.
Timeline and Financing
The initial idea for M9 Ataköy-İkitelli, which was included in the 2011 Urban Transportation Master Plan, called for a 12.2-kilometer line between İkitelli to Yenibosna (İBB). In this plan, M9 was envisioned as a “Metro 2,” a 4-car operation serving stations with 90-meter platforms similar to most north-south lines in Istanbul’s urban rail network. The maximum planned capacity was 36,000 passengers per hour per direction.
In September 2014, 36 lots along the right of way were identified for acquisition (European Investment Bank [EIB] 2016) (Table 17). Two thirds of these were privately owned but none were developed; thus, no demolition or resettlements were required. However, the land acquisition process was not completed until November 2016, when an urgent expropriation decision was issued (DPA 2016). Construction was already underway at this time. This delay is most likely due to the revisions that had to be made by the contractor’s designer.
Table 16. Marmaray Contract Cost
| Contractor | Scope | Cost | Year | USD with PPP |
|---|---|---|---|---|
| Oriental Consultants (Japan), Yüksel Proje, Japan Railway Tech Service | • Control/supervision, engineering and consulting | ¥ 5,500,000,000.00 | 2002 | $66,000,000 (we estimate a 100% increase, thus a $130 million final price tag, due to the doubled timeline) |
| Taisei (Japan) - Gama (Turkey) - Nurol(Turkey) Joint Venture | BC1 - Bosphorus Crossing Engineering/design, procurement and construction of 13.6-kilometer railway and related structures: • 9.4-kilometer twin bore tunnels • 1.4 immersed tunnel • Underground and surface stations with cut-and-cover and NATM tunnels • Bridges | ¥ 102,372,748,108.00 | 2003 | $2,400,000,000.00 ($2,7 million after the claims, variation orders and price escalations) |
| Invensys Rail Dimetronic | Signaling and Automatic Train Protection systems. (Within the scope of the CR3 contract) | €195,000,000 | 2011 | $407,000,000 |
| Hyundai/Rotem (S.Korea) | CR2 - Rolling Stock Contract Engineering/design, manufacture and delivery of 440 rail cars: • Testing and commissioning of the new rolling stock, • Training of the Employer’s staff in train operation, • Provision of spare parts and maintenance of railcars for defined periods. | €543,000,000 | 2008 | $1,181,000,000 |
IMM procured the final project (“final project for application”) and feasibility studies for M9 from Istanbul Ulaşım, the public-benefit corporation owned by IMM which operated the rail lines of Istanbul as well as providing maintenance, engineering and consulting services locally and abroad. In January 2015, Istanbul Ulaşım issued an 86-page feasibility report, including travel projections, demand analyses and operation plans, economic and financial feasibility studies as well as financing schedule alternatives (Demircan 2015). This document put the first detailed cost estimate at $1.9 billion PPP including the rolling stock, based on the following breakdown (Table 18).[58]
Table 17. M9 Timeline (Cumhuriyet 2020b, EBRD 2021, EIB 2016)
| Date | Item |
|---|---|
| 2022-09-14 | Expropriation decision published for 36 lands |
| 2015-01-26 | Feasibility study issued |
| 2015-03-19 | “EIA not required” decision issued |
| 2016-02-02 | Construction contract awarded to AGA for $911 million PPP |
| 2016-04-08 | CM contract awarded to Emay Engineering for $29 million PPP |
| 2022-05-16 | Ground breaking at Çobançeşme Station site |
| 2022-12-16 | Environmental and Social Due Diligence prepared to apply to European Bank for Reconstruction and Development (EBRD) |
| 2016-12-22 | EIB approves $600 million PPP loan to the Istanbul Metropolitan Municipality for the project. |
| 2017-01-11 | EBRD approves $262 million PPP loan to the Istanbul Metropolitan Municipality for the project. |
| 2018-08-09 | Aga laid off 700 workers, the works slowed down or entirely stopped on some sites. |
| Mar-19 to Jul-19 | Construction stopped due to ground conditions at certain locations. The new municipality states that 36% had been completed by 2019. |
| 2020-05-20 | Rail installation starts |
| 2020-07-08 | TBM tunneling completed (61% of the overall construction) |
| 2022-05-21 | Masko and Bahariye Stations open, connecting to and extending M3’s Otogar-İkitelli branch to Bahariye. 70% of the construction is complete. |
| 2023 | Planned completion date |
The environmental impact screening process started soon after, and the Ministry of Environment and Urbanism issued an “EIS not required” certificate in March 2015.[60] The construction contract was awarded to Aga Enerji for $910 million PPP in February 2016 and the CM contract to Emay Engineering for $29 million PPP the following April. Construction was planned to take 38 months. Aga had submitted the lowest bid among 13 construction companies. Emay, on the other hand, won the tender as the fourth most expensive bidder among the 10 CM firms who submitted bids, as technical qualifications factor into the CM selection process.
As commonly seen in the decision processes involving transit infrastructure investments in Turkey, conflict arises as soon as the government and the opposition get involved. In the case of M9, the municipal parliament run by AKP at the time approved the decision to apply for international loans to fully finance the $911 million PPP construction in March 2016. The members from CHP voted against this plan, suggesting that at least a small percentage of the project should be self-funded by the municipality to minimize the debts that would be incurred from interest payments. AKP argued that there were five rail lines under construction, hence the municipality could not finance new projects relying on their own resources, and that investing in M9 would pay off in the long run. The decision passed, with the majority of votes coming from AKP members (Ocak 2016).
In May 2016, Aga Enerji broke ground at the site of the Çobançeşme Station, and within a few weeks, at the sites of Bahariye and Masko Stations. Çobançeşme was selected as the launch box location for all four TBMs, which proceeded in pairs digging north and south (Figures 19 and 20). In November, the cabinet of ministers issued a decision for the urgent expropriation of lands in the Bakırköy, Bahçelievler, Bağcılar, Küçükçekmece and Başakşehir districts (DPA 2016). By then, work was underway at Evren Mahallesi, Kuyumcukent and Yenibosna Stations as well. Mimar Sinan and Malazgirt, which are two main roads providing connection to the Basin Ekspres Highway were closed to traffic in December 2016, for two years. In January 2017, two of the four TBMs were delivered to the Çobançeşme site. By February, there was active construction at 8 separate locations (Wowturkey 2017). TBMs began tunneling in May. The TBMs maintained a 150-meter buffer between them to ensure they were operated safely and that vibrations from one TBM didn’t impact the progress of the other.[61]
No ground water was encountered at the Çobançeşme site, which enabled construction to start smoothly. However, at the time when the first TBM started mining towards İkitelli Station in the north, its conveyor-belt system was still being installed; therefore, it could only proceed six meters a day. Nevertheless, the contractors preferred starting the work, rather than waiting until the installation was complete. The second TBM began digging in the same direction in early June. In August 2017, Mayor Topbaş attended the welding ceremony as part of the installation of the 3rd and 4th TBMs. He reaffirmed that the line would be completed on schedule, by 2019.
The first two TBMs reached Kuyumcukent station in October, 2017. By mid-December, 2017, the TBMs mining towards İkitelli had completed 1312 and 999 meters, and the two digging towards Ataköy were at 1107 and 654 meters (Wowturkey 2017) with an average advance rate greater than 20 meters per day. While the TBMs worked in both directions from the Çobançeşme station, the NATM method was used to excavate the tunnels starting from İkitelli, the northernmost station, to Halkalı. By July 2018, 50% of excavations had been completed.
In September 2017, which was a few months after M9’s TBMs started tunneling, mayor Topbaş resigned and Mevlüt Uysal was appointed mayor. Both mayors were backed by the central government, yet media sources speculated that AKP forced Topbaş to resign to stop his spending on transportation projects, a large portion of which was allocated to metro constructions (Büyükşahin 2017; BBC Türkçe 2021). When Mevlüt Uysal became mayor, he suspended several metro lines, but M9 was spared. Nevertheless, the municipality failed to make progress payments to the line’s contractor Aga, which led to mass layoffs and the effective suspension of construction at most of the M9 sites.
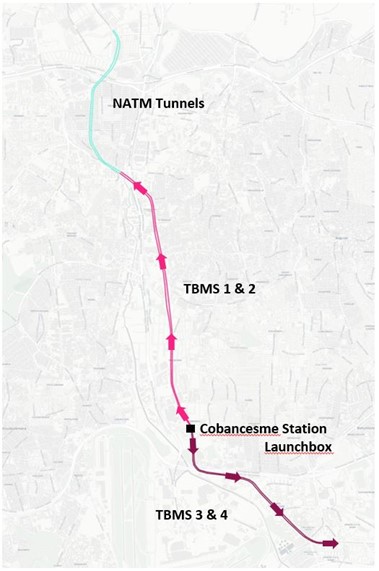
figure 19. M9’s tunnel excavation methods.
Rail tenders accepting bids in Dollars or Euros was common practice when M9’s construction tender was done. With the Turkish currency steadily losing value against the Euro, this meant that the initial ₺1.2 billion contract value had gone up to ₺2.2 billion in by August 2018 (Toker 2018). Even though a new law had been passed in November 2016 prohibiting the tenders and contracts for public works to be executed in any currency other than the Turkish Lira, it excluded contracts that were already in effect.
The works on M9 construction sites slowed down significantly on August 9, 2018, when Aga Enerji (Bayburt Group which owns Aga) laid off 700 workers without notice. No explanation was given to the workers, their insurance plans were terminated and they were asked to sign an agreement forgoing any additional compensation. The Construction and Building Workers Union (İYİ-SEN) provided them with legal advice. Aga claimed, and professionals we have interviewed in the field later confirmed that the reason behind the mass layoff was delayed payments from IMM. This was likely due to nationwide financial challenges and the contract having been denominated in Euros. Additionally, the IMM’s debt had grown at a rate that even the central government did not approve, even though the municipal government was still run by the AKP.
M9’s case presents an extreme example in terms of the scale and severity of the layoff conditions, yet the Turkish construction industry is known for its mixed labor standards. A very small percentage of construction workers are unionized in Turkey. This is partly due to the work being seasonal for most workers who move from construction site to construction site in different cities, and return to other jobs in their hometown once work is completed. The other reason is that unionization has never been supported by legislation and collective bargaining is not a well-established practice in the country. Only 10% of workers are unionized, and among construction workers, less than 3% are employed under collective contracts (Confederation of Progressive Trade Unions of Turkey [CPTUT] 2019).
As was the case in M9, the use of third-party trade labor is very common in rail construction, and in the Turkish construction sector generally. Stations or diaphragm walls can be built with turnkey subcontracts given that the construction documents are supplied to the subcontractors. If construction was not subcontracted out, one line would require 1100 on-site workers, and if excavated earth shipping is included, this number would go up to 1300. In the beginning, contractors of Istanbul metros tried building with minimal subcontracting, but they found that the most risk-averse way of managing projects this large, is to subcontract jobs and distribute some of the risk. However, oftentimes, construction work ends up being subcontracted several times. This lowers the wages significantly and offloads responsibility to smaller and smaller contractors that are harder to keep accountable (Personal Interview O 2021). Hence, it was easier for Aga, the main contractor of M9, to terminate contracts with a few subcontractors than dealing with hundreds of workers, when the payments stopped coming.
TBMs stopped working in September 2018 and remaining works slowed down to the extent that most of the sites were abandoned completely. IMM declared that 30% of construction was complete and updated the planned date of revenue service to 2020. In January 2019, the agency pushed the opening back to 2021, but denied the termination of any construction work (Wowturkey 2019). At the time of the election of the new mayor in June 2019, only 36% of works were complete, but later, construction sped up again.
While the M9 project was never officially suspended, the construction of M1BX, M3-P3, M5-P2 + M13, M7-P3, M10+M4-P4 and M12, stopped in early phases when the 2018 financial crisis hit. The municipal government had failed to secure funds for these rapid rail projects prior to their tender in March 2017 and within a few months after signing their construction contracts, the works came to a stop due to the inability of the municipal government to make timely payments. In August 2018, the Ministry of Finance passed an executive order that allowed contractors to extend their delivery schedules or transfer their contracts. IMM signed protocols with all of the contractors to extend their work schedules. This allowed the contractors to make price adjustments based on Turkey’s producer price index (ÜFE).[62] This only partially covered the losses of the contractors, as ÜFE had increased by 60% while the US dollar had almost doubled since 2017 (₺3.65 at the time of tender in March 2017 and ₺6.8 as of August 2018). The construction of these projects could only resume once the new mayor secured loan agreements with European funders.
In the case of M9, loan agreements had been signed with EIB and European Bank for Reconstruction and Development (EBRD) in 2016, early on in the project timeline, but the municipal government under mayor Topbaş failed to provide securities required to receive the payments from the loan-granting institutions, which delayed construction (Personal Interview Z 2021).[63]
In March 2019, İmamoğlu was elected mayor and promptly made financial plans and secured funds to restart all the suspended rail projects. He issued municipal bonds, a first in the history of Istanbul, to finance some of the projects that were suspended (Railly News 2021). In July, 2020, at M9’s TBM Excavation Completion Ceremony, the mayor announced that the first 2.1-kilometer, two-station section of the line from İkitelli to Bahariye would be commissioned in early 2021, and full length of the line, in 2022.[64] He also mentioned that construction had briefly stopped in March 2019 due to unanticipated ground conditions and in a later press conference, that much of the progress had been made in 2020. 61% of works had been completed by July 2020. On May 29, 2021, the İkitelli-Bahariye section started revenue service.
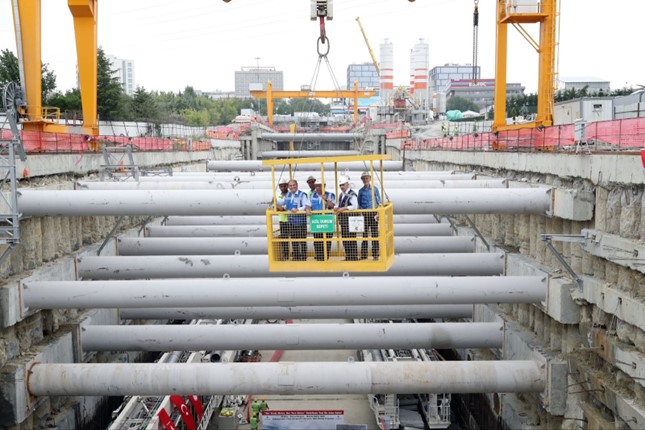
figure 20. Image by IMM, Mayor Topbaş attending the TBM welding ceremony at the Cobancesme launch box.
Scope and Contracts
M9 provides a cross-over connection with M3 at the İkitelli Station, so the trains will continue up north from İkitelli to Olimpiyat which was part of M3 but will now be operated as M9 (Figure 21). M9’s scope included integrating the existing M3 signaling systems with the newly built stations, Masko and Bahariye, that were commissioned on May 29, 2021, with the remaining stations to be completed in 2022[65] (See Tables 19 and 20 for scope and contract details). This integration also allowed for the existing M3 storage yard to be shared obviating the need to build a new facility.
figure 21. M3-M9 map by IMM. Olimpiyat, Ziya Gökalp and İkitelli Stations used to be operated under M3, but now belong to M9.
Table 18. M9 initial cost estimates
| Item | Unit | Quantity | Unit Cost (PPP, in milion) | Cost (PPP, in million) |
|
|---|---|---|---|---|---|
| Construction | Line (Including track work) | km | 13.4 | $28 | $376 |
| Stations | # | 12 | $58 | $700 | |
| Electrical and Mechanical Systems | Elevators and Escalators | # | 144 | $0.4 | $57 |
| Power Supply and Traction | km | 13.4 | $10 | $136 | |
| Signaling | km | 13.4 | $7.8 | $104 | |
| Communication Systems | - | 1 | $83 | $83 | |
| Environmental Control Systems | - | 1 | $104 | $104 | |
| Station Support Systems[59] | - | 1 | $49 | $49 | |
| Rolling Stock | # | 72 | $3.7 | $270 | |
| TOTAL | $1,880 |
Competition
Istanbul rail construction tenders are often subject to intense competition, with six, eight or even ten contractor teams vying for the lowest bid. Bidders are required to secure bid bonds with a value of 3% of their bids, to be submitted with their offers, and performance bonds with the value of 6% of their bids at time of signing the contract, if they are awarded the tender. Additionally, they use “construction all risk insurance” which covers liabilities re: emergency events like fire, flooding etc.[66] These extra costs, and the qualification requirements at the RFQ stage act as barriers against smaller contractors, however, smaller contractors can bid in tenders by forming joint ventures with larger firms. This increases the overall competition for these contracts and has resulted in fierce competition in the rail construction industry.
There are over 450,000 contractors in Turkey (Balbay 2020), and while the number of firms that have the capacity and know-how to undertake rapid rail projects is small, it is large enough to increase competition and lower the bids. Many sources mentioned that the level of competition is very high in Turkey, and in some instances becomes unfair. In one instance, 17 bidders qualified for a tramway construction tender.[67] When there are too many bidders, prices go too low and so the 20% cost increase cannot be avoided.
Since construction contracts are awarded based on the lowest-bid criterion, a comparison of the project cost estimates obtained by the agency and the contract values can provide a sense of how low construction firms are willing to bid, in order to win contracts. The estimated values are not revealed prior to the tender, but since an itemized list of quantities is provided to bidders as part of the tender documents, and a majority of the material, equipment and labor are priced based on standardized cost lists, the contractors have the information they need to attain similar estimates.
Looking at the differences between the estimates and contract costs of 16 lines, we see that save for five projects that were tendered in March 2017, the contract values go as low as 35% below the estimated costs (Table 21).[68] In fact, in the case of M9, the contract was awarded to Aga Enerji at a value that is 31% lower than the project’s estimated cost, which can be attributed to the increased number of firms that qualified to bid, due to the lowering of the qualification requirements in the tender call.
A comparison of the call for tenders of M5 (06-28-11) and M7-P1-2 (12-18-13) reveal the change in qualifications requirements in the tender calls. In the earlier M5’s call, work under either of the following three groups of work areas qualified: G-I) Railway, Rail Systems, A-III) Foundation-Tunnel, Closed Drainage, Gallery (and Shaft) Works D-IV) Electromechanical Works, Rail Systems Electrification Works; while in M7-P1-P2’s call, work under either of the following two groups qualified: A-VI) Railway Works (Infra+Superstructure) or D-VI) Electric Transit Vehicle Technology Works. The latter included Electromechanical works, Rail Systems Electrification, Rubber Tired Transit Electrification, Cable Transit Electrification and Electric Vehicle Charging Station Works. This meant that a contractor who had built an Electric Vehicle charging station could bid for a rail tender that involved several kilometers of tunneling.
This change in the qualification requirements applied to all rapid-rail tenders opened after M7, and allowed smaller firms with little to no experience in rail construction to enter and win tenders. For Aga Enerji, known to be “good friends” with the AKP government, it meant winning the bids for both M3-P3 and M9, without having to form joint ventures with larger, more established construction firms.
Senior managers who have worked for contractor firms in Turkey and abroad mentioned that the level of competition lowers costs to the extent that contingencies are not planned for and quality of construction is risked especially after the qualification conditions were lowered to allow for inexperienced contractors to bid on rail projects (Personal Interviews I and J). However, supporting evidence is hard to track down; many of these lines are new, if not still under construction. Maintenance and downtime costs over several years should be considered and possibly compared with other systems around the world for a conclusive verdict. On the other hand, based on our interview with industry experts, the agencies IMM and AYGM, the designers, the CMs and the subcontractors have gained a level of experience and know-how that can make up for the shortcomings of the contractor, guaranteeing an acceptable level of construction quality.
Table 19. M9’s Scope
| ELEMENT | SCOPE | FEATURES |
|---|---|---|
| Guideway | • 13,39 kilometers guideway | • Single line • Completely underground system |
| Track | • Twin tracks | |
| New Stations | 10 new stations + finishing and electromechanical • (İkitelli Guney Sanayi)works of Masko station. İkitelli station had previously been completed as part of M3 construction starting service in 2012. • Masko • Bahariye • Atatürk Mahallesi • Halkalı Cad (212) • Evren Mah • Mimar Sinan • Doğu Sanayi • Kuyumcukent • Çobançeşme • Yenibosna • Ataköy | • Masko: deep tunnel and C&C construction, 26 meters deep (Civil works had been completed previously) • Bahariye: deep tunnel and C&C construction, 18 meters deep • Atatürk Mahallesi: deep tunnel and C&C construction, 22 meters deep, transfers to M7. • Halkalı Cad: deep tunnel and C&C construction, 25 meters deep • Evren Mah (15 Temmuz): deep tunnel and C&C construction, 30 meters deep • Mimar Sinan: deep tunnel and C&C construction, transfers to M1 at concourse level • Doğu Sanayii: deep tunnel and C&C construction, 25 meters deep • Kuyumcukent: deep tunnel and C&C construction, 36 meters deep • Çobançeşme: C&C construction, 21 meters deep, planned transfer to Sefakoy Incirli • Yenibosna: deep tunnel and C&C construction, 22 meters deep, transfers to M1 at concourse level • Ataköy: C&C construction, 21 meters deep, transfer to Marmaray |
| Tunnels | • 13.39 kilometers twin bore tunnels | • 4 TBMs utilized for 11 kilometers of tunnels. All were launched from Çobançeşme • Tunnels between İkitelli and Halkalı were built with NATM.station, each pair mining in opposite directions (North - South). |
| Systems | • Traction power supply system • Overhead catenary system • Signaling systems • Telecommunication system • SCADA system • Operation control and administrative centers • Electrical distribution system • Elevators and escalators | • Signaling Grade of Automation: 2 • ThyssenKrupp: 25 elevators and 116 escalators. |
| Support Facilities | • The line will share M3’s yard at Olimpiyat Station for maintenance and storage. | • Control center and offices will be located in a structure to be constructed on top of the existing M3 maintenance yard. |
Challenges and Technological Approaches
Coordination, not only between multiple engineering and design teams but also with the ministries and the military during M9’s construction was critical in avoiding potential conflicts. The line was designed to integrate with six other metro lines and the right of way intersected with the Ayamama stream, a NATO oil pipeline, and an international telecommunications line. Several parts of the route went through weak soil and in some sections of the line through silt-clay (AASHTO classification A5)[69] that required extra support using umbrella arches and frequent braces which was costly (Personal Interview H 2020). Moreover, the line went through dense settlements with low quality building stock, necessitating extensive geotechnical planning and monitoring during construction. Like most north-south metro lines in Istanbul, the stations have 90-meter platforms and are smaller than their east-west counterparts, requiring meticulous coordination to integrate mechanical and electrical systems inside smaller spaces.
The designers hired by the contractor addressed some of these issues using Building Information Modeling (BIM) technology during different phases of the construction. BIM is a technological innovation on the software side of rapid-rail design, management, and construction that allows three-dimensional architectural and structural models of built assets to be linked with multidisciplinary information including labor, material, equipment, cost and scheduling data. In Istanbul, BIM has been used in rail projects’ design since 2013 and has been added to contracts as a requirement from the contractors since 2014, starting with M7’s construction tender. Having detailed BIM specifications in the construction contracts allows for seamless coordination across teams at every stage of a project, from planning to construction. This emphasis on BIM in Istanbul has been acknowledged globally; local firms have won multiple BIM design awards for the successful implementation of BIM solutions in rail projects.[70]
M9’s designers working with the contractor used BIM models to determine the shaft and station locations of the line, while avoiding existing buildings and infrastructure (Figures 22-24). While building the BIM model, they laser-scanned the sites and used point cloud technology. Construction progress was updated in real time on these models and shared with all teams, coordinated by the design team and approved by a BIM manager appointed by the CM or the agency. Tunnel excavation and final lining process work program verification was done through 4d models integrating time as a component in the 3d models which prevented the TBM schedules from conflicting with the construction schedules of station components, which is critical to keeping phased construction on schedule and from preventing mishaps. Integration of the line with the existing transfer stations also benefitted from laser scanned point cloud models. QR codes were utilized in technical rooms providing instant access to Room Data Sheets which helped staff monitor construction (Personal Interview Y 2021).
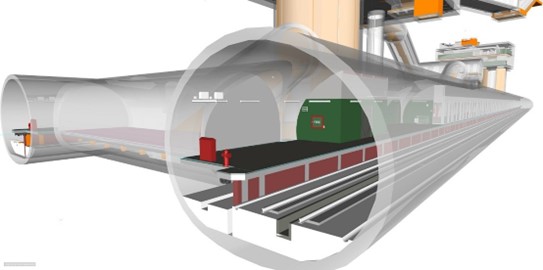
figure 22. BIM Model of M9 Platform tunnel. Courtesy of Prota Engineering.
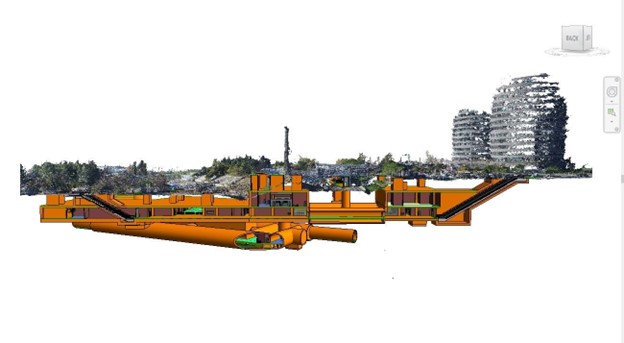
figure 23. Yenibosna Station BIM model and existing site conditions (laser scan) integration. Image courtesy of Prota Engineering and Aga Energy.
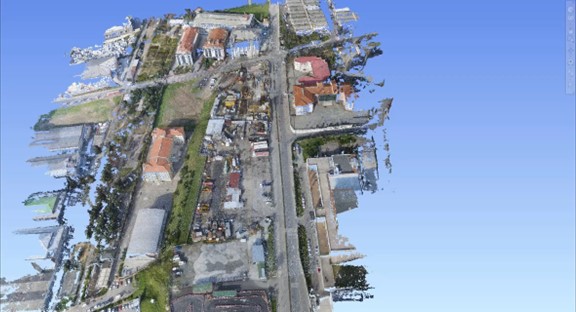
figure 24. Doğu Sanayi Station: Existing site conditions (laser scan) integration. Image courtesy of Prota Engineering and Aga Energy.
M9 is seen as a pioneer among Turkey’s rail infrastructure projects in terms of the level of integration of BIM technology in its construction processes along with M8 Dudullu-Bostancı. M9 was an infrastructure category finalist in both of Autodesk’s 2018 and 2020 AEC Excellence Awards that honor the innovative applications of “technology for collaboration, prefabrication, and design automation” in the building industry (Autodesk n.d.). Both the Rail Systems Department under IMM and the Ministry of Transit under the central government value investing in the integration of BIM technology in their infrastructure construction processes. Following her appointment as the head of Rail Systems Department of IMM by the new mayor İmamoğlu, Dr. Alpkökin initiated the establishment of a new BIM team within the directorate. Also, the Ministry of Transit issued new BIM specifications for infrastructure contracts in 2021.
Lessons Learned
We believe that M9’s relatively steady progress, following the 2018 economic crisis, can be attributed to a number of factors, most of which are consequences of the competitive construction market, as well as years of accumulated experience within IMM’s Rail Systems Department and the city’s rail infrastructure construction sector. Despite Aga Enerji’s own lack of experience, it had access to engineers, consultants and subcontractors in the market who had gained expertise through decades of building rail in the city. Moreover, by the time work started on M9, the IMM had overseen 100 kilometers of rapid-rail construction with another 135 kilometers in progress. During this period of intense rapid-rail construction, the agency reorganized itself, established working relationships with competent consultants and contractors, refined its procurement process, and improved standards to enhance working conditions and manage nuisances. Aside from the delays due to financing issues, M9’s construction proceeded without major setbacks and the line is expected to be completed by 2023 with minimal to no cost overruns.
By the time of M9’s construction, the Rail Systems Department had established mechanisms to manage the contractor more effectively. One example of this was the geotechnical planning specifications in the project’s contract. Rigorous geotechnical monitoring and relevant mitigation measures had been adopted by the agency after the establishment of the Rail System Projects Directorate under the department. Specifications for a ground settlement monitoring plan and monitoring-system equipment were provided in the contract. The geomonitoring implemented for the construction of M9 involved hourly readings from sensors at multiple locations, through which any surface deformation was reported to the NATM and TBM teams, the CM, and the agency. The scope of the monitoring was specified in the contract in detail, and involved the definition of an impact zone which would cover all locations where a ground settlement over 1 cm (0.4 inches) was expected.
Aga Enerji, which had only built highways and was known as an excavation subcontractor when it won M9’s construction tender, benefitted from its collaboration with Prota Engineering, whom it hired as its designer. Prota had designed several rapid-rail lines in Istanbul and other cities in Turkey, including Istanbul’s M4, the CR3 phase of Marmaray and a light rail line in Izmir as well as having experience in Europe, designing Warsaw’s line II. It had worked with both the IMM and the AYGM under the Ministry of Transit in Istanbul. Prota was also the driving force behind the adoption of BIM in the infrastructure sector, which the municipality adopted and mandated in 2015. So even though Aga Enerji lacked experience, it worked with experts in the field and invested in developing the expertise to build rail in the future.
Mismanagement of M9’s project financing was the major culprit behind the delays over the life of the project (Personal Interview V 2021). Even though agreements with European grantors had been signed early on, resources to be declared as securities to receive the payments had not been allocated, hence the agency missed payments to the contractor. Works on M9’s construction sites slowed down and wouldn’t pick up for a year. Istanbul’s newly elected governor İmamoğlu was well aware of the urgency of the city’s transit infrastructure needs, so soon after taking office in 2019, he secured new resources to fund M9 and all the metro projects that had stopped construction because of the 2018 financial crisis.
4.4 Conclusion
4.4.1 What is There to Learn from Istanbul?
Based on our study of Turkish rail construction, we found that there were four primary factors that kept construction costs low and the processes efficient. First, there was an ongoing political commitment spanning different administrations to build an extensive rail network. Second, through years of construction experience, initially learning from foreign experts brought in to consult and train the Turkish teams, and later collaborating with Turkish contractors and consultants who were now building rail all over the world, the agencies gained the capacity to streamline processes and manage projects efficiently. Third, market competition encouraged contractors and consultants to lower their costs, while developing their technical and technological capacities. Fourth, all parties involved quickly learned that speed saved money, and refined their processes to avoid unnecessary delays. Ultimately, these conditions cultivated a competitive, agile and competent rail sector.
Throughout the last 20 years, the IMM has developed know-how and optimized its procurement processes to better manage rail construction projects. On the other hand, the AYGM under the central government has recently hired former IMM personnel as AYGM has begun to manage more projects in Istanbul. Since 2014, the IMM has utilized “final design for application” projects that are at 60% design, which has helped it go to construction tenders with more detailed information and better control over projects. In the earlier projects where the agency was still figuring out how to build subways, they would go to tenders with an underdeveloped preliminary design, leading to higher costs due to overdesign overseen by the contractors, as was the case for M4 and earlier projects. By the time the agency started working on M5, it knew enough to specify better optimized station and tunnel designs. The contractors we interviewed agreed that this was one of the major changes that improved rail-construction processes; over the last 15 years, the agency has learned to spend more time on the design, working with experienced design consultants, prior to the construction tender.
Developing a good working relationship between public agencies and contractors has been critical to Istanbul’s success building more than 300 kilometers of heavy rail between 1989 and 2030. The agencies and contractors have struck this balance by tendering based on itemized costs and procuring the construction through as few contract packages as possible, which help the agency keep the process and costs under control. Additionally, agencies have expedited approvals and paperwork that allows for construction to start and advance quickly once the contract is signed. With the agency and contractor working together, the preliminary designs can be altered and innovative solutions can be developed quickly. While the costs are locked in through the contract, since the contracts are based on itemized costs, increases are allowed based on changes. However, the total increase is limited to 20% of the contract value. Increases beyond 20% need cabinet approval, which is almost always avoided to prevent delays. Nevertheless, through regular progress reports and payments, spending is kept under control by the agency. Additionally, multiple people whom we interviewed including one senior agency executive concluded that distributing risk among multiple contracts and contractors is unnecessary, and Istanbul saves money and time by avoiding breaking the work into multiple contracts (Personal Interviews G, J, L 2020 and P, V 2021).
It is not uncommon for a metro construction tender with a scope involving over 10 kilometers of tunnels to receive six or more bids, even when there are several lines under construction at the same time. The intense competition for metro construction encouraged contractors to innovate and bring their prices down. Contractors are motivated to win bids because there is a clear pipeline of new metro projects and many have invested in technology and expanded their equipment pools. Since 2014, Building Information Modeling (BIM) has been used in design, planning and management of construction, and it has been mandated through the agency’s contract specifications. Design consultants, construction managers and contractors rapidly adapted to the new requirements and all attribute their improved coordination and more efficient management of projects to BIM solutions. In addition to greater competition amongst general contractors, it is also now easier for contractors to buy or rent construction equipment, which reduces costs. Many contractors own TBMs, and keep costs low by utilizing the same machine on multiple projects. They also understand the specifications of the equipment better, and therefore can buy TBMs suitable for different soil conditions rather than changing cutter heads during construction, which slows down the pace of tunneling and adds costs.
The agencies, contractors and consultants understand that speed saves money. The Environmental Impact Statement (EIS) certification and preliminary approval processes are rapid, and the contractor starts excavating as soon as the project’s rough boundaries, such as station exits and entrances, are determined. The contractors obtain pre-approval to start excavating before the designs are 100% complete and break ground, even though this sometimes means needing to do revisions. A senior manager we spoke to attributed Istanbul’s speed and lower costs to the Turkish teams’ ability to think outside the box (Personal Interview I 2020). The contractor and the agency develop quick solutions for problems that come up and find ways to work within the plans, standards and regulations. So, the project ends up changing a great deal throughout the construction process, but is completed within the planned budget, or with the 20% allowable cost increase, and fast, relative to other countries in our database.
A steady stream of projects, competition between the IMM and the Central Government’s Ministry of Transportation, as well as a robust pool of contractors vying for work has cultivated a productive rail-construction ecosystem in Istanbul. This benefits the city, even in cases where a contractor lacks experience, the agency, consultants, subcontractors with years of experience in the field along with the now established procurement mechanisms can make up for these shortcomings by helping the contractor learn on the job and deliver projects with minimal delays and cost overruns.
4.4.2 Is There Room for Improvement
While Istanbul has managed to expand its rail network rapidly and at a fraction of the cost compared to cities in Europe and North America, a number of issues remain unresolved in the rail-construction industry. The agencies and the contractors building rail in Istanbul know that speed saves money, yet rushing through certain stages, especially the preliminary planning processes can bring on challenges later, during construction. Health, safety and environment (HSE) mitigation budgets are small and without a prevailing culture of community engagement related to infrastructure projects, environmental disruptions can be overlooked. Low labor and white-collar wages bring down labor and professional service costs, but at the cost of unionization and precarious labor conditions, which are susceptible to the will of the contractors. Local and national politics help boost rail projects, but political conflicts also delay schedules and lead to cost overruns. Archeology remains a challenge for tunnel excavation in Istanbul, and the city lacks a guiding framework defining the principles of managing an infrastructure project in the presence of archeological discoveries.
Even though many practices and conditions have improved over the years, especially after the establishment of the Rail System Projects Directorate under the IMM; experts who have long been involved in rapid rail construction in Turkey agree that there is still room for improvement on the following issues:
- Speed can sometimes come at the cost of quality. Supervision is not always strict and intervention is minimal to keep construction going, so the end product may not last as long. The British say their new lines will last 120 years. In Istanbul, many new lines will likely need to be replaced/repaired in less than 100, according to a few sources who expect this to reflect on the maintenance costs in the future (Personal Interviews G, I 2020 and T 2021). However, maintenance costs are a problem for rail infrastructure in many countries we have studied, and it is also difficult to make comparative projections for which system will require costly maintenance earlier in their useful life.
- Mitigation and preliminary planning budgets are low, so, even though there has been greater emphasis on HSE mitigation measures, they are not as well planned and prepared for as in European and North American countries. One senior quality engineer explained that the agencies could save 5-10% by spending 2-3% more on the preliminary design as well as HSE mitigation measures; by which he implied that Turkish teams were generally not good at this, and lost money in the later phases of construction having to do repairs related to environmental damage and design revisions that could be avoided with more rigorous planning early on in the project (Personal Interview M 2021).
- Labor is cheap and teams work around the clock. TBMs operate 24 hours a day, and teams take one Friday off every two weeks. The agency and the general contractor lack sufficient control over the work conditions of subcontractors. In terms of the quality of production, this has less influence on the tasks that require expertise, such as TBM tunneling, because local teams need to compete with international teams and so are required to provide high quality services (Personal Interview AB 2022).
- Professional staff are paid too little. Engineers, designers and CMs receive a fraction of the contractor’s fees or what their counterparts would be paid in Europe and North America. This impacts the time and effort spent on design, planning, quality assurance/quality control (QA/QC) and mitigation. Turnover rates at consultant firms are also high, meaning, experienced teams do not remain together for long.
- The RFQ standards have been lowered, which is one reason for increased competition. The other reason is that Turkey has over 450,000 contractors. This also means less experienced contractors can be awarded large subway projects.
- Politics are very much a part of how rail systems are planned and constructed in Turkey. The central government and the local municipalities run projects separately and the central administration does not pay for municipally run projects. Political pressure can speed up construction but may also hinder QA/QC processes by rushing the commissioning dates. Conflicts between the local and central governments can delay permits and increase third-party costs. Also, changes in political administration can result in mass firings and hirings, which means the agency may be unable to retain experienced personnel, as was the case when the İmamoğlu administration beat AKP in municipal elections. However, several of these experienced staff members were hired by the central government which currently oversees more than 80 kilometers of rapid-rail construction projects in the city.
- Archaeology has and will continue to be an issue in rapid-rail construction. Therefore, it is important to develop guidelines on how to manage rail-construction projects in archaeologically-rich environments, similar to those we saw in Rome.
Istanbul, having started building its rapid-rail infrastructure in the late 1980s, has come a long way within three decades, owing to sustained political will, a steady pipeline of new projects, evolution of the owner agencies, streamlined procurement processes, and the cultivation of expertise in its rail industry leading to competition between contractors and the lowering of costs. On the other hand, rail construction in the city suffers from the impact of political squabbles between the central and local governments, inadequacies in the implementation of HSE mitigation measures, substandard labor conditions and corruption. Produced as part of a series of case studies from around the world within the scope of the Transit Costs Project, this report argues that based on Istanbul’s positive and negative experiences other agencies can bring down construction costs through efficient management while maintaining standards for labor, mitigation and the quality of construction.
[1] The transit agency “Istanbul Ulaşım [Istanbul Transit]” under the Municipality was established in 1988 and was responsible for the rapid rail system of the city. It was renamed “Metro İstanbul” in 2016.
[2] The 6.5 kilometers section was commissioned in September and an additional 2 kilometers, in December of 1989.
[3] Consisting of mini buses and dolmuş which are 8 passenger mini buses.
[4] See Appendix A for ridership numbers.
[5] According to a recent study based on interviews with officials from the Istanbul Metropolitan Municipality (IMM) officials and surveyed 21 reports and plans, 10 of which were approved by the IMM Council, expanding the railway network is stated as a main priority for IMM in “IMM’s Strategic Plan for 2020-2024”, “Istanbul Climate Action Plan, 2018”, “Istanbul Metropolitan Municipality Transportation Master Plan, 2011” and “Istanbul Development of Public Transport Strategies Master Plan Report, 2019” (Beyazit-Ince et al. 2020).
[6] The initial target of 388 kilometers for the year 2023 in the 2011 Master Plan was revised.
[7] We use Purchasing Power Parity adjustments based on data from the World Bank (World Bank n.d.)
[8] AKP is the right wing, conservative and populist political party that has been in power in Turkey since 2003. CHP is left wing and the main opposition in the parliament.
[9] Muck yard refers to the land that the city designates for the unloading of excavated earth.
[10] Public consensus is that this was facilitated through each bidder submitting the lowest bid for a different line, bringing to mind a possible pre-arrangement among bidders, possibly in coordination with the agency. In Istanbul, construction tenders are awarded based on the lowest bid criterion at the end of a two-staged tender process involving a Request for Qualifications and a Request for Proposals.
[11] 7 metro lines, 4 trams, 3 funiculars and the Marmaray commuter line.
[12] Some senior managers of contractor firms pointed out that restricted timelines demanded by the agencies in Turkey compromise HSE mitigation standards; Turkey has a higher rate of occupational fatal accidents than Europe and the US. According to the International Labor Organization’s statistics, Turkey had 7.4 occupational fatalities per 100,000 workers (in 2016) while the US had 5.3 (in 2018), Italy, 2.4 (in 2015), Sweden, 1 (2016) and the U.K, 0.8 (in 2015) (International Labor Organization [ILO] n.d.). However, it is hard to draw a direct link between the speed of construction and the quality of HSE.
[13] The direct translation of the title of this document would be “final design for application project”.
[14] To learn more about what the EIA process entails for projects subject to EIA, see Appendix D.
[15] EURIBOR (Euro Interbank Offered Rate), LIBOR (London Interbank Offered Rate) are average interest rates which leading Eurozone and London banks estimate that they would be charged when borrowing from other banks. These rates are updated daily.
[16] For the line M5+M13, Deutsche Bank provided a loan covering 15% of the costs and did not have such a requirement, however an executive level engineer of a contractor stated that if the financing was to be extended, it would very likely require the procurement of the catenary system, electrification and telecommunication systems from Siemens (Personal Interview J 2020). This credit agreement was arranged by the IMM.
[17] ₺5 billion and ₺7 billion was spent on projects in Istanbul and Ankara but only ₺30,000 on projects in Izmir (Savaşkan 2020).
[18] FIDIC (the International Federation of Consulting Engineers) is a standards institution best known for their contract templates. FIDIC Red Book Design-Bid-Build contract template recommends a balanced division of risk between the contractor and the agency.
[19] Issued in Turkish and recently also in English and Russian (Turkish Ministry of Environment and Urbanization [TMEU] n.d.)
[20] 80%-20% ratio have been utilized in the tenders of: M5 Üsküdar-Ümraniye-Çekmeköy, M4 P2 Kartal Kaynarca, M7 Mecidiyeköy-Mahmutbey, M8 Dudullu-Bostancı, M5-P2-M13 Çekmeköy-Sancaktepe-Sultanbeyli and Sarıgazi (Hastane)-Taşdelen-Yenidoğan lines.
[21] Electromechanical systems include: power supply & traction power system, signaling, communication and control system, environmental control systems and supplementary station facilities.
[22] See Appendix C for more detail on utility replacement work in Istanbul projects.
[23] Most metro lines in Istanbul are 100% underground, with the exception of short sections and the at grade commuter line CR3, thus they don’t require a lot of superstructures.
[24] The average timeline specified in the contracts of seven recent rapid rail lines with an average of 14.85 kilometers in length is 1063 days, which means that one kilometer of rail is expected to be completed in 2.5 months. The actual duration of completion for one kilometer of rail line in Istanbul is 7 months on average.
[25] See Appendix B for a detailed list of wages for the TBM staff in Istanbul and New York.
[26] The 20% limit started to be applied in 2008 and excludes price adjustments based on inflation and the costs of CM consultants who charge based on man hours even after their initial contract value is overrun.
[27] There are examples of the ministers’ granting approval for change orders exceeding 20%. For M2’s 4. Levent – Darüşşafaka section, a 31% increase was approved in 2012.
[28] Most of the recently built Istanbul metros are system-integration level 4, fully unattended (driverless) systems which are procured from foreign firms like Alstom (formerly Bombardier), Thales and Siemens. This means the increases in Dollar or Euro exchange rates have a great impact on the contractor’s costs. Price adjustments allowed by the contracts used to pay for currency exchange rate increases before, but were unable to since 2018 as the Turkish Lira lost over 50% of its value against the dollar.
[29] FIDIC (the International Federation of Consulting Engineers) Silver Book used for the Marmaray project is a template for a lump sum, turnkey, Engineering, Procurement and Construction contract which transfers the majority of the responsibility and risk onto the contractor.
[30] See Ocak’s 2006 paper for public and private motor vehicle passenger counts performed on the route in 2005.
[31] The contractor also orders TBMs soon after they sign the contract. A TBM is ready to be shipped in a minimum of 10 months, it is delivered in a month and tested on site for another, hence the contractor has at least 12 months to start TBM tunneling after they are awarded the construction contract. This is enough time to complete a station box that can double as a launch box for the TBM(s), and to start drilling the tunnels.
[32] Istanbul Technical University’s Department of Transport Engineering was commissioned to carry out an analysis with results supporting the decision in April 2005 and later the Transportation Coordination Center (UKOME) was notified and issued their approval in June. UKOME is a municipal agency responsible for the coordination between the metropolitan municipality, national and local public institution’s transportation departments and the district administrations under the city.
[33] Even though we were not able to uncover any details regarding the approval process of the new contract’s budget that was more than 9 times that of the original one, Istanbul’s mayor being a member of AKP, the ruling party of the central government, was likely an easing factor.
[34] The EURIBOR value that was used in the financing fee estimates of more recent lines are 0.6, allowing for a 3.2% yearly interest rate. At the time of Kadıköy-Kartal’s contract, EURIBOR values averaged around 4.4, taking up the interest rates to 6.6, more than double of what we calculate for more recent loans. This may be the reason for the more recent loans having longer payback periods such as 30 years; the lower interest rates make it feasible to extend the repayment schedules.
[35] İETT is responsible for managing Istanbul’s bus and BRT network today.
[36] A national law passed in 2003 already required the procurement of a final design document before launching construction tenders for infrastructure projects, however, these documents were prepared by the public enterprise İstanbul Ulaşım A.Ş. (later renamed Metro İstanbul) until 2014 and used to be underdeveloped.
[37] A tunnel ventilation expert we interviewed explained that Copenhagen’s City Ringen (M3) had minimalist, simplified stations in terms of aerodynamics, with fewer articulations and openings so that ventilation loads could be minimized. Openings of the station such as escalators and entrances would act as shortcuts for the air, weakening the suction required for ventilation, which would reduce the aerodynamic efficiency and require fan capacities to be increased (Personal Interview R 2021).
[38] Marmaray’s platforms are 225 meters; M11’s, 180 and M5’s, 140. Metro 2 lines linking these higher capacity Metro 1 lines operate half the number of trains in traction and so have smaller platforms: M8 and M12 stations are 100m long; and M9, 90m.
[39] In Turkish projects, NATM tunneling speeds vary between 1-2 meters/day depending on the quality of team management. With TBMs, the speed goes up to 24 meters or 16 segment rings/day.
[40] These TBMs are called “rebuilt”, not “refurbished”, as some parts are new and some are second hand.
[41] M4’s Phase 2 cost $79 million PPP/kilometer. Phases 3 and 4, the construction of which are still ongoing, were contracted for $68 million and 81 million PPP/kilometer respectively. M5’s Phase 1 cost $101 million PPP/kilometer and M6, $76 million PPP/kilometer. M9 and M11, the airport connector’s Phases 1 and 2 were awarded at $95 million, $90 million and $95 million PPP/kilometer respectively.
[42] However, the signaling is outside of the contract because the system had to be integrated with the remaining 63 kilometers of the commuter line and was contracted separately.
[43] DLH was restructured as AYGM (General Directorate of Infrastructure Investments) in 2011.
[44] See (Ministry of Foreign Affairs of Japan n.d.) for countries.
[45] We do not have access to the specific conditions of this contract, but assume that the costs approximately doubled by the time of closing (Figure 15).
[46] For example, they lost four months just for bureaucratic procedures waiting for a permit on a section of the tunnels around Sirkeci. They lost another five months due to miscommunication regarding discovered archeological structures; the Museums Directorate didn’t want to remove them, but they eventually had to be removed for the guideway. The findings were documented in 3d, the contractor also did a structural analysis, which the board didn’t initially require but requested later, nevertheless, the structural analysis had to be re-done.
[47] In 2018, a sinkhole that opened up during the excavations of the M8 line caused the death of two security personnel working at a nearby residence. The following lawsuit charged 9 staff members of the contractor and the subcontractor including project directors, deputy directors, and chiefs of the geotechnical, tunneling and depot construction crews, with 6 years and 8 months of imprisonment (Çekmeköy Haber 2018).
[48] Similarly, the archeological excavations at the adjacent site of M2 were outsourced to the project’s contractor by the IMM. This was necessary because the responsible entity Istanbul Archaeology Museum only had 30 archeologists on staff, no budget and no authority to hire temporary staff. The contractors hired subcontractors, who hired freelance archeologists, conservators, unskilled workmen and specialists (between 260 to 380 people) as well as setting up labs and hiring equipment for the sites (Bonini Baraldi et al. 2019).
[49] The Union of Chambers of Turkish Engineers and Architects declared that early opening compromised safety of operations due to the phased opening of the line and incomplete certification process (Sendika.org 2013).
[50] Media sources speculated that the command center cost $22 million PPP.
[51] Marmaray’s ventilation scheme is very different from what is commonly implemented in Istanbul. In regular lines, even the Metro 1 type, 180 meter-platform stations, there are 4 tunnel ventilation fans (TVF) in addition to 4 station exhaust and inlet fans. 2 shafts connect the fan rooms to the surface, one at each end of the station, and each circular shaft is divided into two with the larger portion dedicated to the TVFs and the smaller, to the platform ventilation. The tunnel and station ventilation fans are horizontally configured and the grates of the shafts open to public land or road sides, flush with the ground. No at-grade structures are necessary, these shafts are built as part of the station structures and are 100% underground, which satisfies the NFPA regulations. Some “shaft” type stations designed by the Italian designer Geodata have their fan rooms in the large, central shafts.
[52] An agency planner expressed his concern on the issue: “We should prioritize better route design and acquire land where necessary. Construction of a line planned to take 4 years takes 6-8 years in any case, so why not utilize this time better?” (Personal interview C 2020).
[53] According to senior managers at contractor firms that build rail in Turkey and abroad, at every stage of the life of a rail project, Turkish teams are smaller compared to those in other countries including US, Canada, Poland and Qatar.
[54] In addition to Gama-Nurol and Taisei’s contracts, a contract was made with BEM, Taisei’s Electrical and Mechanical department operating as a separate entity.
[55] We use PPP based on 2020 as the mid-year of construction.
[56] As also mentioned earlier on in this document, this directorate was established under the Rail Systems Department and the General Secretariat of the Metropolitan Municipality of Istanbul in 2014, and started procuring final design documents at 60% design to facilitate accurate cost estimates and tendering the construction of rail lines with itemized costs.
[57] Note that this line’s contract value was agreed upon in € currency which became an advantage for the contractor as the Turkish Lira lost up to 70% of its value against the € since the contract date (as of September 2021). Contracting with foreign currencies was prohibited by legislation later in 2016.
[58] The earliest cost estimate for this line from the 2011 Transportation Master Plan is $ 1.5 billion PPP for a 12.2 km right of way.
[59] Includes drainage, fire control and protection, AG power distribution, lighting, clean and wastewater systems.
[60] See Appendix D for information on the EIS process in Turkey.
[61] TBMs digging in parallel in the same direction require at least 150m distance between them due to the ground vibration they create, so before the second one starts tunneling, the first needs to have advanced at least 150m.
[62] ÜFE is an index based on products in farming, fishing, mining, energy and production sectors.
[63] Securities that the municipalities present to receive loans can be in the form of deposits on hold, receivable assets or mortgages.
[64] Upon request for information in September 2021, the Rail Systems Department declared the planned date of completion as 2023.
[65] Currently slated to open in 2023.
[66] This is very different from the US where insurance is required to cover 100% of the costs.
[67] 17 firms were shortlisted, 6 of them submitted bids (Rayhaber 2020).
[68] These five lines’s tendering processes were heavily criticized for interfering with competition and for political corruption. The contracts were awarded to five different consortia on the same day, and each of them had bid for all 5 projects, strategically winning only one.
[69] Meaning 35% or more of the material would pass through a 0.075mm sieve (Jamal 2019).
[70] Designer firm Yüksel Proje won Autodesk’s AEC excellence awards in 2019, in both the large and medium scale project categories, for the BIM project of M12 line and their “Istanbul Rail Systems Design Services” for other Istanbul metro projects they have utilized BIM. Prota Engineering was shortlisted for the same awards in 2020 with their BIM projects for the Istanbul M9 and Mersin Metro lines.
The Italian Case: Turin, Milan, Rome and Naples
5.1 Introduction
In this in-depth case study of Italian rail rapid transit projects, we investigate how Italian construction costs have changed over time and distill lessons learned to understand how design, procurement, and policy drive costs. We begin with an analysis of a systematic country-level database encompassing 93% of transit projects, as measured by total kilometers built and expected to be completed in Italy between the postwar years through the end of the 2020s. The first section illustrates the overall institutional framework, the various planning and delivery practices of transit projects and their evolution over time, as well as the tools that have been put in place to curb construction costs and improve procurement practices, notably since the 1990s. The second section of the report focuses on four city-level cases: Turin, Milan, Rome, and Naples. Thanks to the analytic study of the history, politics, context, delivery, and design choices, the cases highlight important factors that contribute to the variation of construction costs among the different cases. Finally, the different takeaways derived from this multi-level in-depth analysis of the Italian cases has been summarized in ten main lessons identifying the fundamentals of a cost-sensitive approach to building urban rail infrastructure.
The data collected in the general Transit Costs database situate Italy as a medium-to-low cost country for metro rail construction, with an average cost of $159 million per kilometer compared to an overall average of $280 million per kilometer globally.[1] The Italy-specific database encompasses 50 metro rail projects accounting for 307 km or 93% of metro rail mileage built in Italy since the 1940s, currently under construction, or entirely funded and to be completed by the end of the 2020s. The analysis of this expanded country-focused database highlights a generally lower average value ($120 million/km) and a high variability between projects and cities, as well as over time: from as little as $22 million/km for Milan’s M2 at-grade suburban extension built in the early 2000s, a cost on par with mainline double track rail, up to the $645 million/km for Naples’s line 1 central segment, the most expensive section of metro ever built in Italy. This variability, which will be analysed in greater detail in section 2, is the result of both historic trends, differences in local capacity, and Italy’s unique urban morphology.
Section 3 examines the institutional planning framework, funding, procuring and delivering of transit projects that contribute to an average construction cost generally lower than our global averages, especially in North America, albeit with some notable exceptions. The evolution of the Italian project-delivery framework offers a few fascinating lessons, both positive and negative ones, for countries that wants to tackle the upward spiral of transit capital costs. A growing concern for cost control since the 1990s facilitated the implementation of mechanisms, tools and institutions designed to curb waste, and avoid mismanagement and corruption-prone practices in public-works delivery. In the aftermath of these reforms, three main innovations revamped transit project delivery in Italy. First, a new anti-corruption authority (ANAC) was established to clean up public procurement practices. Second, Italy adopted official reference unit-price lists (Prezziari delle Opere Pubbliche) to determine the benchmark cost of procurement and the bid ceiling. Third, the bidding process was overhauled to incorporate technical scores when assessing a bid rather than focusing exclusively on costs. On the other hand, it is worth noting that, despite a planning and approval process managed by the civil service and less prone to external lawsuits and NYMBY-induced design, the Italian institutional framework suffers from important veto points and political meddling than can increase the cost of delivering infrastructure in particular contexts, notably historic city centers subject to strict heritage protection.
The four in-depth cases presented in the second part of this report examine metro projects built in Turin, Milan, Rome, and Naples over the last twenty years. We rely on interviews with public officials, engineers and experts; [2] the analysis of official documents and data provided by transit agencies, as well as reports from national supervising authorities and articles from the specialized transportation press to reconstruct the key factors that drove costs in specific projects. Each city offers insight into the benefits and challenges of different delivery methods, differences in local capacity, urban contexts, and diverse financing structures. What is clear across all of these cases, however, is the importance of building and maintaining in-house technical capacity to procure and manage projects effectively. Furthermore, the cases illustrate how environmental constraints, such as the unique urban and geological conditions of old and dense city centers, and contextual factors, such as political fickleness, bureaucratic veto points, and uncertainties over funding and schedules, can result in overdesign, trigger costly design choices and scope changes, and promote poorly conceived delivery schemes, that hinder public oversight capacity.
5.2 Urban rail construction in Italy: a general overview
5.2.1 A latecomer to urban rail construction
Unlike other European countries that began building urban rail in the 19th and early 20th Centuries, Italy opened its first line after World War II. Despite several attempts in the interwar period to develop metro rail networks in Rome, Milan, Genoa and Naples, the first proper metro line opened only in the mid 1950s. Metro construction finally gained momentum during the postwar years, characterized by fast urbanization and dramatic economic growth, but was hindered by the lack of a national transit policy, which finally emerged in the late 1980s, and by an essentially car-oriented transport policy. Below we identify three critical periods in the history of rail-based urban transit in Italy:
- 1950s – 1970s. For at least three decades after the war, Rome and Milan were the only cities building heavy urban rail infrastructure. Rome, after the opening of the first section of line B in 1955, initiated the construction of line A in the 1960s. Those were the only urban transit projects financially supported by central government funds, as a 1920s law identified transit infrastructure in the Capital as a matter of national relevance, while considering it a local government responsibility elsewhere. In the 1930s, the city of Milan had already developed a plan for a three-line radial network, but the implementation was delayed by the onset of WWII, and the city only started construction on the first two lines in the mid 1950s. Unlike Rome, the metros were built with local funds, in the form of municipally granted bonds, and were delivered through “Metropolitana Milanese” (MM), a municipally-owned special-purpose concessionaire. In the mid-1970s, Naples was the third Italian city to develop a modern metro system, initially with municipal funds only.
- 1980s – early 1990s. The period starting in the 1980s saw growing central government involvement in the planning and financing of mass transit infrastructure in large cities. This was a response to growing congestion and the untenable challenges created by rapid urbanization and a dramatic increase in motorization during the previous three decades. Legislative and governmental efforts tried to address growing congestion in major urban areas, while planners popularized the idea of “Iron Therapy” (cura del ferro) to highlight the need to develop frequent and reliable rail-based transit in the largest urban areas to “heal” cities from chronic automobile congestion and pollution. This resulted in a boost for transit projects in Rome, Naples and Milan, and in the tentative development of light metros in Genoa and Catania. Overall, these efforts weren’t part of a coherent national policy, and the projects initiated during this period are characterized by the use of non-competitive procurement formulas, such as the privately negotiated “concession of sole construction” scheme used in Naples, Genoa and Rome, where metro development was awarded to private consortia without a competitive tender. These opaque delivery schemes were at the epicenter of the vast web of systemic corruption around public procurement that emerged in the far-reaching scandals of the late 1980s known collectively as Tangentopoli (Bribe-burg). The sweeping investigation and the following trial, dubbed Mani Pulite (Clean Hands), prompted a period of political turmoil during the early 1990s and, ultimately, the collapse of the major parties that dominated the government during most of the postwar period.
- Late 1990s -2020s. The 1990s and the early 2000s are characterized by a slowdown in metro openings as a consequence of fewer project starts in the years following Tangentopoli, and because of austerity measures prompted by the 1992 public debt crisis and efforts to curb the deficit within the Maastricht’s treaty limits.[3] Later, Italy experienced a dramatic surge in the new urban rail starts, especially in the 2010s and 2020s. New dedicated national grants for transit construction in 1992, 2001, 2016 help explain this recent resurgence in transit projects. At the same time, the adoption of cheaper automated light metro technologies and unattended automated operations, that has become the de facto standard for the newer lines opened since the early 2000s, made metro technology viable in smaller metro areas and lower demand corridors. Today, the seven metro systems operating across the country total 222.7 km and support an estimated 2.74 million unlinked daily trips.[4]
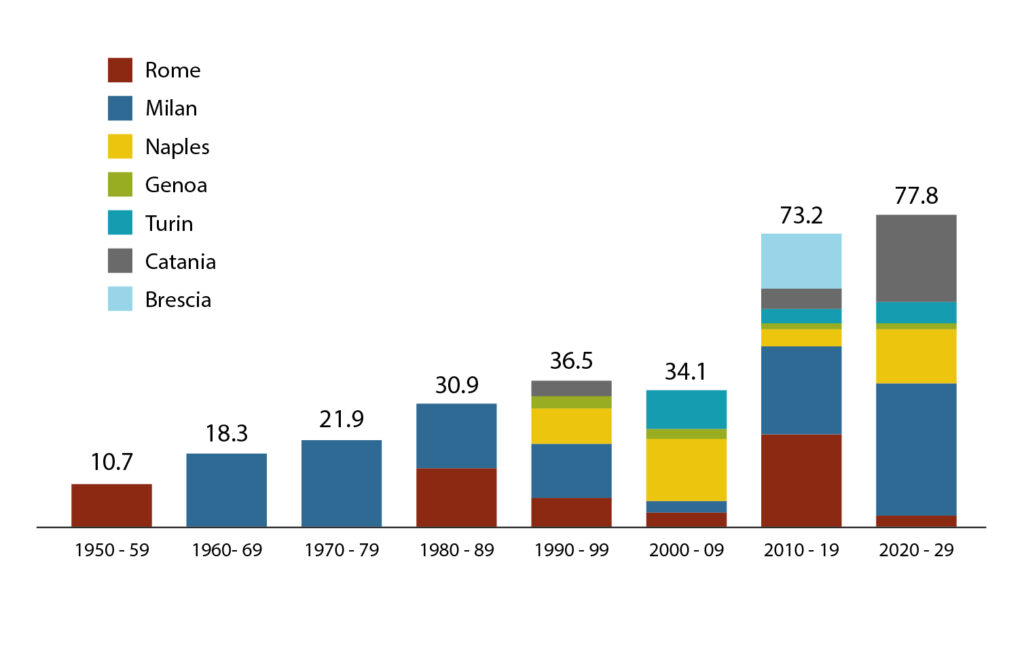
figure 1. New kilometers of metro rail opened in Italy by decade and city. For the decade 2020 – 2029 only the projects currently under construction, or fully funded and having a completion date set before 2029 are included.
5.2.2 Average costs and patterns in the historic variation of constructions costs
figure 2 shows the actualized cost per km of almost all urban rail projects built in Italy since the 1950s, except for a few metro extensions of lines M1 and M2 built in Milan from the late 1970s to the 1980s and the initial section of Catania’s metro, as it was impossible to retrieve trustworthy figures on these projects. Data have been collected from several official sources and, in three cases where official data were not available, from press releases or other sources.[5] Nominal Cost figures derived from official documents and agency’s data have been actualized to €2020 (henceforth referred to as “nominal value” or “nominal cost”) using the mid-year of construction as the base year and then converted to US dollar PPP values using a 1.3 coefficient. All numbers in the report expressed in “dollar’ or simplified as “$” are in 2020 PPP USD dollar real terms. However, it is important to point out that for projects built during the inflationary 1970-80s, characterized by double digit year-over-year inflation, even a minor shift in the identification of the mid-year of construction might lead to a notable difference in the actualization coefficient. With those caveats in mind, we identified a revealing pattern in the variation of construction cost over time.
The cost of most metro projects falls within the $ 50-200 million per kilometer range, with a few outliers, mostly located in Naples, Milan and Rome. Out of the 332 route-km collected in the database, 243 km (72 %) are tunneled while the remainder are at grade or elevated. The average nominal cost per kilometer of projects with more than 50% of the alignment tunneled is €115 million ($149 million), while projects with less than 50% tunneled the average cost is €29 million ($38 million, see figure 3). Interestingly, there is not a direct correlation between the length of platforms and the average costs: the 201.3km of route (66% tunneled) that are classified as heavy metros (platforms of 110 or 150m) have an average cost of $122 million per kilometer, while the 72.3km of new generation automated light metros (platforms of 40-55m) have an average cost of $118 million per kilometer. It is worth noting that this might be related to the fact that the light-metro trackage has a much higher percentage of route-km tunneled compared to heavy metro. The less expensive typology on a per kilometer basis, at $88 million, is the first generation of light metros with 80m-long platform, modelled after LRT and Stadtbahn systems and initiated in the 1980s in Naples (line 6), Genoa, and Catania. Catania’s very low figures ($ 61 million/km), due to particularly favorable local soil conditions, contributes to driving the overall average down.
Historically, we see a spike in construction costs from the late 1970s through the mid-1990s and a reduction in costs after, albeit with two notable exceptions. Almost all the high-cost projects of the 1970s-1990s era, such as Milan’s M3 initial segment, Rome’s MB extension to Rebibbia and the initial section of Naples’s line 1, were connected to the corruption scandals of Tangentopoli.[6] The reduction in costs observed from the late 1990s is most likely due to a combination of factors:
- A major reform of the Public Works Code in 1994, the Merloni law (109/94), the first of a series of measures gradually implemented and refined over the following decades to contain costs, improve the transparency of the procurement process through measures like reference-unit costs, unit-price contracts and the technical scoring of bids, and greater competition with European-wide procurement (see section 4).
- The widespread adoption of new automation technologies allowed for high-capacity rail transit with narrower and shorter trains running more frequently, which resulted in a new generation of automated light metros with lower upfront capital in fixed infrastructure, built in Turin, Brescia, and Milan starting in the early 2000s (see figure 4).
- Actualized construction costs in Euros and USD PPP by year of construction (middle year of the construction period) and city.
- Construction costs by year of construction (middle year of the construction period) and percentage of tunneled alignment.
- Construction costs by year of construction (middle year of the construction period) and size of platforms.
- Metro systems currently in operation in Italy and their technical characteristics.
5.2.3 General considerations about the construction sector in Italy and input costs
In order to better understand the analysis of transit projects within the general framework of the construction sector in Italy, this section provides some information about labor-related issues, general capacity of the construction sector and a few references about input costs comparing Italy and the US.
A sample of recent Requests for Proposal (RFP)[7] for construction projects shows that the proportion of costs allocated to labor comprised of between 19-31%. This percentage appears to be lower than what is generally considered as conventional in the United States, which is believed to be around 50% (cf. New York case 2022). This might be both the result of lower labor costs in Italy, but also lower productivity in the American construction sector, especially considering that infrastructure contractors are less likely to use light and heavy prefabrication as compared to Italy. However, those observations are derived from anecdotal evidence and need a more thorough investigation to better understand the impact of wages and productivity on the cost divide between Italy and other countries, notably the US.
Labor costs in Italy are regulated by National Bargains, that are normally negotiated between the most important national sectoral labor organizations (FILLEA CGIL, FILCA, FeNEAL, etc.) and the national association of construction entrepreneurs (ANCE – Associazione Nazionale dei Costruttori Edili). Beginning in the 1990s, the National Government began facilitating these negotiations following a praxis called Concertazione (literally, Orchestration) to ease a historically combative relationship between unions and employers. Once terms are agreed to, terms that include salary, working hours, benefits, they are made public and apply to all workers regardless of whether or not they are part of a union.[8]
Finally, it is worth noting that Italy has a well-developed local industrial expertise in tunneling, that dates back to the construction of the national railway network starting from the mid-19th century. This expertise has been improved over time, stimulated by the growth of the road and motorway network, the modernization of the rail network, the more recent development of a High-Speed Rail system, and the construction of urban rail systems. The Italian Tunneling Association (ITA – SIG, Società Italiana Gallerie) claims that Italy ranks second in the world after China for the combined length of road and rail tunnels, at around 2,100 km[9], ahead of Japan, Norway, and Switzerland. As a result, there are several contractors and consultants who specialize in underground structures and who have pioneered new tunneling techniques, such as ADECO-RS.
The following table highlights a few typical input costs for labor, materials, and energy as of 2021 as derived from official sources and compared to New York City. Labor cost tend to be lower in Italy than in most US jurisdictions, common materials used in large infrastructure, such as Portland cement and steel for rebar have a comparable price, while energy cost are significantly higher in Italy than in the US.
Table 1. Typical input cost for the construction sector in Italy (2020-21)
| € - Euros | $ PPP (1.3 conversion rate) | NYC (avg.) | ||
|---|---|---|---|---|
| Labor1 FOR ITALY. Labor cost includes: gross salary and other salary-related costs, contractor-side taxes (payroll, IRAP), severance pay, retirement contributions, insurance, etc. as par the National Bargain Contract. It does not include: 12-13 % general contractor’s expenses for labor management. FOR USA. Labor costs for construction as reported by the MTA (2022) and professional services costs as reported by our New York Case (2023). The amount includes wages and supplemental benefits. |
||||
| Skilled construction worker | 31.4 €/hour | 40.9 $/hour | 115 $/hour | |
| Unskilled construction worker | 25.1 €/hour | 32.6 $/hour | 70.5 $/hour | |
| Professional services (senior) | 50.0 €/hour | 65.0 $/hour | 260 $/hour | |
| Professional services (junior) | 34.8 €/hour | 45.3 $/hour | 115 $/hour | |
| Professional services (draughtsman) | 26.8 €/hour | 34.8 $/hour | ||
| Materials1 | ||||
| Portland cement (32.5 R - 42.5 R) | bulk (silos) | 105-112 €/tonne2 | 135-145 $/tonne 125- 132 $/ton | 128 $/ton |
| packed | 122-129 €/tonne | 158-167 $/tonne | ||
| 143- 151 $/ton | ||||
| Steel rebar (B450C) | 420-445 €/tonne | 545-580 $/tonne 495- 527 $/ton | 720-740 $/ton | |
| Plywood for falseworks (27mm) | 14.5 €/m3 | 18.8 $/m3 1.7 $/sq ft | n.d. | |
| Energy | ||||
| Electricity (2019 average) | 0.27 €/kW3 | 0.35 $/KW | 0.06 $/KW4 | |
| Fuel (2020 average) | 1.43 €/liter5 | 1.86 $/liter 7.02 $/gallon | 2.17 $/gallon6 | |
| Notes | ||||
| 1. for Italy: data derived from the “Prezziari Regionali delle Opere Pubbliche” of Lombardy and Campania. For the U.S. : https://www.bls.gov/regions/mid-atlantic/data/producerpriceindexengineering_us_table.htm | ||||
| 2. metric tonne = 1,000 kg. 1 metric tonne = 1.10 short tons (US) | ||||
| 3. data from ARERA, referred to industrial prices for consumers using less than 20 MWh/a: https://www.arera.it/it/dati/eepcfr2.htm# | ||||
| 4. data from EIA: https://www.eia.gov/electricity/monthly/epm_table_grapher.php?t=epmt_5_6_a | ||||
| 5. data from the Ministry of energy database: https://dgsaie.mise.gov.it/prezzi-annuali-carburanti | ||||
| 6. data from EIA: https://www.eia.gov/todayinenergy/detail.php?id=46356 | ||||
5.3 The planning and legal framework of urban transit projects
To better understand the four in-depth cases presented in this report, it is important to appreciate them within the evolving context of the planning and legal framework of urban transit projects and of public works in general. Notably, we will present the implementation of tools introduced through a number of legislative reforms that have played a role in the reduction of construction costs that we observe starting in the second half of the 1990s. Those reforms happened in the context of the strong emotional public response to Tangentopoli (Bribe-town) scandals and a growing awareness among policymakers of the necessity to curb costs and improve public spending effectiveness in the context of continuous fiscal consolidation that characterizes Italian public finances since the early 1990s.
As a general remark, it is worth noting that the Italian administrative system is regulated by a juridic rationality that is in part different from the one observed in the US or Canada. It is less adversarial and more similar to the so-called Bureaucratic Legalism, based on the Napoleonic tradition of Administrative Law and on the principle that the State and its operational machine, the Public Administration, are responsible for pursuing the Public Interest. Hence, appeals against decisions of public agencies and authorities, like environmental approval, public contract awarding, expropriation decrees, etc., are dealt with by separate Administrative Tribunals.
5.3.1 The institutional framework of transit projects
Italy is a Parliamentary Republic and a Unitary State, with forms of devolution of legislative power to Regional Governments[10] and local authorities[11], especially in the urban and transit planning domain. Taxation powers are mostly concentrated in the hands of the National Government, and local authorities mainly rely upon a mix of property taxes, fees and transfers of funds from the Treasury, with a limited leverage on local fiscal resources and constrained borrowing powers.
Over time, the framework for the planning and delivery of transit projects has shifted from one of local financing and planning to one of shared responsibility between the National Government and the lower levels of government. Today, the National Government bears the largest share of capital funds for new projects, sets very general policy directives, and provides baseline funds for operations through the National Transit Fund. The lower levels of government (Regions, Metropolitan Cities and Municipalities) are in charge of the regional and local level of transit planning and co-funds transit capital projects and operations. In particular:
National Government. Infrastructure spending, including transit, is mainly managed by an Inter-Ministerial Committee for Economic Development (CIPESS – Comitato Interministeriale per la Programmazione Economica e lo Sviluppo Sostenibile) under the responsibility of the President of the Council of Ministries (i.e. the head of government). CIPES includes, among others, the Ministry of Infrastructure and Sustainable Mobility (MIMS) and the Ministry of Finance and Treasury (MEF). The CIPES is responsible for the final approval of local transit capital projects that applies for national grants, in agreement with the State-Region Conference, a mostly consultative body that gained importance after the 2001 devolution reform, and now works as a de facto negotiation chamber between the Central Government and the Regions. The ministry of Energy and Environment is charged with the evaluation and approval of the Environmental Impact Reviews (VIA – Valutazione di Impatto Ambientale), a techno-bureaucratic process mostly focused narrowly on ecological impacts (noise, pollution, etc.) rather than community impacts at large. Moreover, most transit projects are not automatically subject to the full national VIA procedure as other large infrastructure projects. Instead, a pre-screening procedure at the regional level determines if a transit project has a potentially relevant environment impact and whether it should undergo a lighter regional VIA procedure managed by the Regional Environmental Agency (ARPA – Agenzia Regionale per la Protezione dell’Ambiente) or no environmental evaluation at all, replaced with just a list of recommendations to be addressed in the final design phase.
Regional Governments. Since the 2001 devolution reform, Regions have gained greater control over transit. They are responsible for transit planning and funding at the regional scale–notably for regional rail–and for setting the overall framework for transit operations (fares, levels of service and subsidies) within the region or between regions through ad hoc agreements. Regions can contribute to transit capital programs with their own funds, especially because they manage the European Regional Development Fund (ERDF/FESR in Italian) and the European Social Fund (ESF/FSE in Italian).[12] ERDF and ESF are an important source of funding for transit projects since the late 1980s, especially in the southern, less-developed regions that receive a higher per-capita contribution.[13] Regions are also involved in the approval process of transit projects in the preliminary evaluation of the environmental relevance of infrastructure projects, that determines whether a project must undergo national or regional EIR/VIA or is exempted.
Municipal Governments and Metropolitan Cities. Municipal governments and, more recently, Metropolitan Cities are the main actors of urban transit policies. They are responsible for local transit planning. They devise and approve the local Sustainable Urban Mobility Plans (PUMS), select and propose projects for national grants, and act as the delivery authority of most urban transit projects, either directly or by delegating the project management to transit agencies or, more commonly, to ad hoc capital project delivery agencies. Municipalities and Metropolitan Cities normally contribute matching funds to capital projects, mostly through borrowing from banks or from the public lending authority, Cassa Depositi e Prestiti (CDP).
5.3.2 Planning, design, approval, oversight, and management
The way in which large infrastructure projects have been planned, funded, approved, designed, and delivered has changed considerably over time. Successive reforms have refined the definition and scope of planning and design phases, set clearer criteria to identify viable projects, and established increasingly tighter regulations to foster transparency and competition. We will go into greater detail about the evolution of public procurement practices in the following section (3.3). Here, we will illustrate the general framework as it has developed in the last twenty years, even though this matter remains subject to continuous reforms and legislative adjustments. In particular, we will present the main planning and design steps, and the main actors charged with oversight and delivery management functions.
Planning and Design steps
Large transit projects go through four main iterations of planning and design, with the first one being a relatively recent innovation (early 2010s): i) Sustainable Urban Mobility Plans (PUMS); ii) Technical and Economical Feasibility Project (PFTE); iii) Final Design (PD); iv) Executive Design (PE).
Sustainable Urban Mobility Plan (SUMP/PUMS – Piano Urbano della Mobilità Sostenibile). This is the initial and fundamental planning document for transit projects. PUMSs are 15-year horizon plans, ideally elaborated at the Metropolitan City level, that encompass all aspects of urban mobility, including both people and goods, and set sustainability goals linked to European and national goals of GHG emission, modal shifts, etc. PUMS, as the mandatory cornerstone of local mobility planning, are a relatively recent requirement for cities (since the early 2010s). Many cities, though, already had comprehensive masterplans or strategic plans for transit development linked to the general “Urban Planning and Land Use” Plan (PRG – Piano Regolatore Generale) since the 1970s. Moreover “Traffic Management Plans” (PGTU- Piano Generale del Traffico Urbano), that were introduced in the early 1990s, normally had a transit component mostly framed as a congestion reduction measure, but they had a weak connection to the capital funding process. During the PUMS’s elaboration process, that normally takes two or three years, transit capital projects are evaluated within comprehensive short and mid-term scenarios, in terms of overall efficacy and congruence with the main sustainability goals and are rated through cost/benefit ratios and parametric cost evaluations. General alignment and mode are normally decided at this level of regional network-wide planning. Public participation is mostly done at the SUMP/PUMS phase in a variety of forms[14], even though public outreach can continue in the following phases.
Technical and Economical Feasability Project (PFTE – Progetto di Fattibilità Tecnica ed Economica). Formerly called Preliminary Project (PP – Progetto Preliminary), the PFTE represents a level of design that encompasses some elements of preliminary planning (evaluation of local alignment alternatives and selection of the preferred alternative), early design (up to a level of detail corresponding to 30-50% design in the US system[15]) a complete business case and service plan, including a more detailed Cost/Benefit analysis, and preliminary cost estimates based on a more refined but still parametric evaluation of construction costs. National grants and approval from the CIPE committee are granted based on the PFTE level of design. Delivery schemes corresponding to the Design-Build definition (such as the General Contractor for MC in Rome and the PPP scheme used for M4 and M5 in Milan) normally base their Requests for Proposals (RFP) on a PFTE/PP, even though this is not possible anymore since the 2016 reform of the public works code, that privileges RFP based on Final Design. The environmental pre-screening at the regional level, that determines whether the project will undergo a full EIR/VIA procedure, is also based on the PFTE.
Final Design (PD – Progetto Definitivo). This stage corresponds to a level of design where all the technical aspects of the project have been solved in detail. It corresponds approximately to the 90% design or a Construction Document Phase in the US context. All the necessary approvals and recommendations from concerned authorities (for example, monument and landscape protection, fire departments, structural and earthquake compliance, etc.) are secured during the approval process of the PD. Since the late 1990s Public Service reform, those approvals and recommendations are acquired through a joint authorization committee composed by representatives from all the concerned authorities, called Conferenza dei Servizi[16][16]. The PD level of design has sufficient detail to be used for a thorough estimation of costs based on the official regional reference unit price lists (see section 3.6). For example, it involves extensive geological sampling, advanced engineering, and the elaboration of the Design Specifications (Capitolato Speciale d’Appalto). PDs include all the elements necessary for devising an RFP in case of a delivery scheme called “Integrated Delivery Contract” (Appalto Integrato), that is a procedure used for the joint procurement of Detailed Engineering Design services and construction.
Detailed Engineering Design (PE – Progetto Esecutivo). The PE is the most advanced level of design, where all the construction documents and detailed technical drawing are prepared based on the PD. It’s the most expensive and labor-intensive phase of design, even though it implies no major design choices compared to the previous phases. RFPs based on a PE are less common in large transit projects procurements, even though there are cases of “traditional” procurement where the agency procure separately the PE and the construction. Unlike the PD, the labor-intensive nature of PE makes it unlikely to be done in-house by public agencies, but there are exceptions, as we will see in the detailed cases.
Management and overview responsibilities.
Italian public project delivery practices involve three important complementary supervising functions that are different from what is normally encountered in the North American context: i) Chief Project Manager (RUP); ii) High Supervision (AS); and iii) Work Supervision (DL).
Chief Project Manager (RUP – Responsabile Unico del Procedimento). The 1994 and 1999 reforms of the Public Administration Code requires that project delivery authorities identify a general manager for each project, normally an executive official within the local administration or the delivery agency. That figure is the person solely responsible for the project, both legally and bureaucratically. The introduction of the RUP role, technically an in-house project manager appointed by the contracting authority (i.e. the municipality), might seem trivial, but has proven to be a major positive innovation. The RUP concentrates decision-making powers in the hands of a career civil servant. This arrangement protects the design team from excessive interference from elected officials, such as councilmembers, and from political micro-management of the planning, design and delivery activities of the project.
High Supervision (AS – Alta Sorveglianza). The AS function is exclusively encountered in public works. The AS is responsible for supervising the correct execution of the contract. It has a final say about all major changes in the project that involves cost or scope variations and has the ultimate power to accept or refuse the payment to the contractors based on progress, quality of work and contract adherence. The AS function can be assumed directly by the Contracting Authority in-house or by another public agency, but cannot be contracted out to a private firm.
Work Supervision (DL – Direzione Lavori). This function encompasses the control and supervision tasks that are typical of Construction Management, such as frequent worksite inspections, validation of minor change orders and quick fixes requested by the contractor that don’t require significant cost or design changes, as major ones must be agreed upon by the AS. This labor-intensive activity is directly related to ensuring the execution of the Detailed Engineering Design, can be outsourced to a private firm. In case of projects delivered through a General Contractor formula, this task is entrusted to an independent firm contracted directly by the GC itself.[17] Moreover, the limit and the respective responsibilities between the role of High Supervision and Work Supervisor is blurred, and it depends on the interpretation that the contracting authority gives of its role, as we will see in the detailed study cases, as those functions have been performed differently, and with different outcomes.
5.3.3 The planning and funding process and its evolution over time
The planning and funding process for mass transit projects has changed multiple times since the first metro line opened in the 1950s. Nevertheless, it is possible to identify four major periods regarding how urban rail transit in Italy was conceived, financed, and delivered, defining a trend characterized by a growing financial involvement by the National Government and an increasingly structured planning and legal framework. In particular, major changes occurred after the approval of the 1994 reform of public works, devised as a response to the late 1980s-early 1990s Tangentopoli corruption scandals that involved, among others, the metro projects in Milan, Rome and Naples. As we will see in the four detailed cases, financing metro rail projects has come from a variety of sources and most of the time has been a major influence on delivery methods, project organization, phasing and, ultimately, engineering choices with a non-negligible impact on projects costs.
Early development: municipal and state ad hoc funding
Since 1925 transit has been considered a local matter.[18] Rome, as the capital city, has received funding from the national government to develop a transit network because it is considered to be of national importance, and is tied up with a wider urban renewal program to transform Rome into the “grandiose imperial capital” of Fascist Italy. Financing new transit lines outside of Rome remained the exclusive domain of local jurisdictions until after World War Two.[19] Thus, the first two lines of Milan’s metro network were financed via municipal bonds and other local sources,[20] while Rome’s lines MA and MB were funded by ad hoc appropriations from the national budget via recurrent dedicated laws.[21] This principle continued into the 1980s, even if lobbying from local governments resulted in occasional funding for selected projects tied to the budget law or other specific legislation, as it happened for example with the post-1980s Irpinia earthquake relief grants being used for Naples’s line 1.[22]
Local authorities were also expected to develop network-wide plans within the wider urban planning process. In Milan, where the first three lines were part of a 1942 network plan, the last of several tentative plans proposed during the previous decades,[23] and, for Rome, where the overall network design was developed over time, notably with a 1942 masterplan and, later, within the 1964 urban masterplan (P.R.G. 1964). Nevertheless, those plans were rudimentary, mostly no more than a generic network scheme with no delivery horizon nor thorough economic analysis.
The 1992 Mass Transit Funding law
The 211/92 mass transit law was the first attempt to organize funding for mass transit projects on the national level within a coherent long-term framework. The 211/92 law and the connected financing decrees appropriated the equivalent of €8.5 billion over a multi-year period (1992 to 2006 circa) to fund mass transit projects proposed by local authorities.[24] Funded projects were to have “mass transit characteristics”, in terms of capacity, frequency, reliability, commercial speed and dedicated rights-of-way. through their own funds or long-term bonds mostly granted by the public lending authority (Cassa Depositi e Prestiti – CdP) and guaranteed by the central government. Over 15 years, the 211/92 law funded 76 tramways, metro, and BRT projects including some of the detailed case studies covered in this report. The law has proven to have several shortcomings in the financing methods, from the excessive slowness of implementation to its weak connection with planning tools.
The 2001 “Legge Obiettivo” funding law: a megaproject approach.
In 2001, Silvio Berlusconi’s center-right coalition overhauled the financing process for infrastructure projects. The law 443/01, commonly known as “Legge Obiettivo” (Target Law) was designed to boost infrastructure building at the national level after the de facto freeze on projects during the 1990s. The law 433/01 mandated the government, notably the CIPESS inter-ministerial committee, to designate a list of large infrastructure projects of national importance (emphatically called Great Works, Grandi Opere) to be financed by the Treasury. The National Government’s share could cover up to 100% of capital cost for national projects (such as mainline rail, energy and water management) or up to 60% of the capital cost for urban transit, with the remainder being provided by local governments (Regions, Provinces and Municipalities) or, eventually, the private sector, as the law actively sought greater involvement from private operators in both the funding and delivery, notably through Public-Private Partnerships.
The list of “strategic megaprojects” (Grandi Opere Strategiche) to be financed under the “Legge Obiettivo” was essentially politically motivated. The list was compiled by cherrypicking projects developed at the local and regional level rather than assessing their merits, value, and benefits. Over time, the list has expanded to include the planning priorities of regional governments, as well as politically motivated pet-projects independent of any planning tool but sponsored by members of the parliament or the cabinet and supported by local interest groups. As a result, the list of strategic projects ballooned while funding remained constant. The list-based mechanism proved ineffective because it failed to provide a methodology for evaluating projects.[25] Furthermore, during a period of austerity, local authorities were unable to provide matching funds needed to get projects built, as their borrowing capacity was capped by the “internal stability pact.” This approach was progressively abandoned in the early 2010s, through adjustments made by several governments of different political orientations. In 2016, it was finally replaced with a mechanism to allocate national funds better tied to local and national planning and accompanied by another major reform of the public works procurement process.
The 2016 Mass Rapid Transit fund and the Sustainable Urban Mobility Plans
During the 2010s a consensus among policymakers emerged that the strategic planning of transit infrastructure and the approval and funding for individual transit projects had to be better integrated. Within the context of the European Agenda for Sustainable Mobility, novel, more integrated planning and financing tools have been developed. Since the mid-2010s, Metropolitan Cities and larger municipalities have been required to develop and approve a Sustainable Urban Mobility Plan (SUMP, or PUMS in Italian – see section 3.2).
Since 2017, mass transit projects have been mostly financed through a dedicated Mass Rapid Transit Fund (Fondo per il Trasporto Rapido di Massa, or Fondo TRM) of approximately €2.5 to 3 billion per year for ten years. Transit capital projects can access national grants only if they comply with an approved local SUMP, have a positive Cost/Benefit (C/B) ratio, help achieve the SUMP’s sustainability goals, and follow evaluation standards established by the Ministry of Infrastructure and Sustainable Mobility (MIMS). The C/B ratio, the quality of SUMPs and a set of sustainability and efficacy criteria, such as modal shift or increased coverage, that are rated by a ministerial commission, are taken into account to determine the ranking of financeable projects and the amount of national grants for each project. The National Fund can cover up to 100% of the capital costs, including most hard and soft costs, as well as the rolling stock. So far, three rounds of grants have been awarded using that method, in 2018, 2019 and 2021. Even though the TRM fund is poised to become the dominant source of capital funding from the central government, individual projects can also be funded through different ad hoc appropriations in the general budget, through EU regional cohesion funds as well as other local or national sources.
Good Practice focus: grants supporting design.
The 2017 reform also instituted a dedicated grant system, called Fondo Progettazione Enti Locali intended to cover up to 80% of the costs sustained by the local governments of large cities and major metro areas to plan and design mass transit projects. The fund was deemed necessary because, as the then minister lamented several times, many local administrations had struggled to submit good quality projects because of a lack of in-house expertise and constrained budgets. The fund has since been replenished twice: €90 million for the 2019-2021 and €116 million for 2021-2023 periods. Money is allocated based on a fixed formula with a light non-competitive application. Unused funds are redistributed to the other recipients. Cassa Depositi e Prestiti, the public bank that has among its mandates to support local governments, is charged with administering the fund, and also providing technical support and staffing for municipalities to manage projects and to streamline the process, such as cashflow and financial management. The fund has been generally considered a success by experts and practitioners, as it has sparked a new wave of good-quality transit projects.
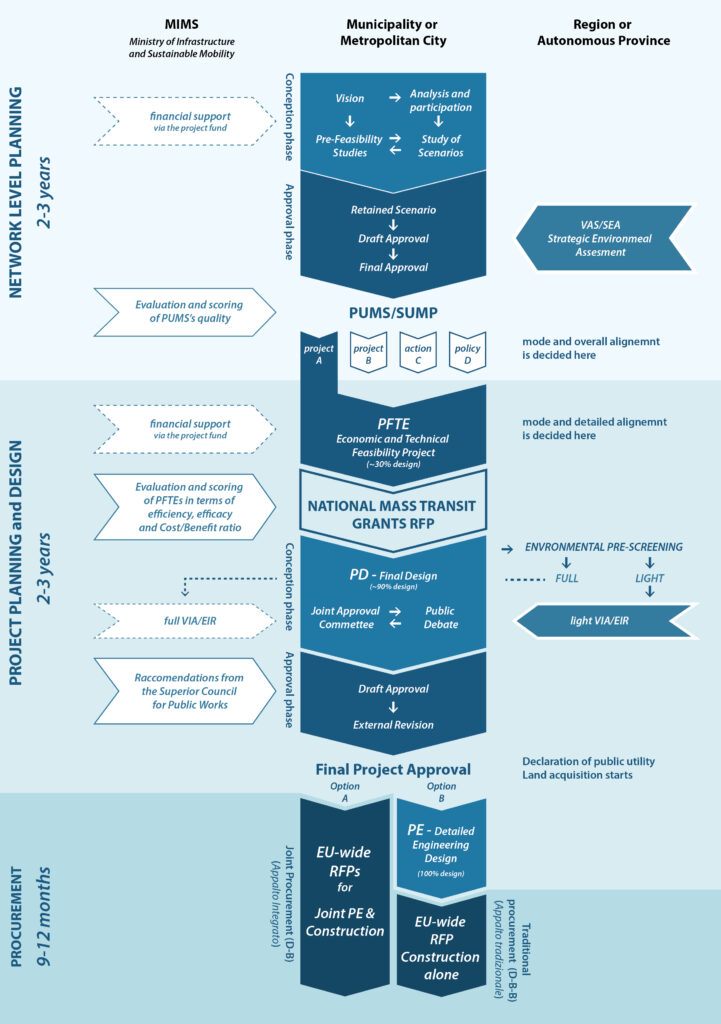
figure 6. A simplified summary of the planning and funding process of transit capital projects after the 2016 reform.
5.3.4 A great variety of delivery methods: the evolution of bidding and contracting practices.
The Italian case showcases a variety of delivery methods for urban rail construction. The framework for public works has evolved dramatically over time. These changes are partially tied to the overall trajectory of the economic policies at the national and EU levels and to the political history of the country. Until the 1990s, most public works were carried out in a loose regulatory framework first established in the 1890s[26] and only minimally adjusted over time with partial reforms to address specific issues or sectors. Traditionally, low-bid procurement was used with the concession schemes, to delegate to the private sector the construction and maintenance of key national infrastructures, similar to the rapid development of the national motorway network in the 1950s. However, this happened in a context where the public sector was greatly involved in economic life via large publicly-owned corporations operating in several industrial and financial sectors and reassembled under the Istituto per la Ricostruzione Industriale (I.R.I.) conglomerate.[27] In this context, the construction of the first metro lines until at least the 1970s was mostly delivered through publicly-owned special-purpose companies, with the involvement of the private sector only in the construction phase, mainly through traditional bidding procedures awarded to the lowest bidder. In 1955, Metroroma spa was established in Rome by the I.R.I. to build metro line A. The same year, the city of Milan established a municipally-owned concessionaire, Metropolitana Milanese spa (MM), that issued municipally-backed bonds to build the first two lines and managed all aspects of project delivery, from planning to design, while actual construction was contracted out to private-sector firms.
During the second half of the 1970s and through the early 1980s, the delivery of new metro projects grew more reliant on various Design-Build (D-B) concession schemes, in theory modeled after what was considered the successful attempt of MM in Milan to build and consolidate in-house expertise in metro construction. But unlike Milan, those later D-B concessions were directly awarded without public competitive bidding to consortia of public and private firms or even only private ones, based on the claim that local authorities lacked proper in-house expertise in metro construction.[28] Those schemes were called “Concessions of sole construction,” that is a non-competitive, loosely defined D-B scheme awarded on the basis of a preliminary transit expansion masterplan. These schemes were used in Naples, with the creation of Metropolitana di Napoli spa (MN) and for the E-W LRT (today’s line 6), and in Genoa for the construction of its first line in the late 1980s. These opaque concession schemes, often based on a simple general development masterplan for a future metro network supported by a general concept, preliminary cost estimates lacking clearly defined quantities and methods and without a defined schedule, proved to be a fertile ground for corruption and cost-escalation that characterized public works during the last fifteen years of the First Republic, and eventually led to the collapse of the political system swept away by Tangentopoli in the early 1990s.
The 1994 public works reform.
The 1994 public works reform, also known as the Merloni law (109/94) was the first major comprehensive legislative reform about public works since the original Royal Decree 350/1895 approved almost a century before. It came in the wake of the early 1990s scandals, and it was inspired by the principles of transparency, quality of public works, and open and fair competition between contractors. It represented the translation into the Italian legislation of several EU directives targeted at creating a pan-European open market. The implementation of several aspects of the law were postponed for political reasons or even openly reverted for a short period in the early 2000s. Nevertheless, many key innovative procurement practices were refined and implemented in the years following the Merloni law and are now an integral part of the 2016 Public Procurement Code. A few elements stand out as significant improvements to contracting practices brought by the 1994 reform:
- It established oversight authorities to ensure the appropriate application of procurement practices by contracting agencies, notably the National Authority for the Oversight of Public Procurement, more recently renamed the Anti-Corruption Authority (ANAC).
- It strictly prohibits Design-Build concession schemes used in the previous decade for metro construction in Naples, Rome and Genoa. Public infrastructure can either be delivered through separate public contracts (Appalti) for design and construction (similar to Design-Bid-Build) or with joint-procurement contracts (appalto Integrato). Contractors must be selected through fully open RFPs (gara pubblica), shortlisting (gara a inviti), or public two-step design competitions (consorso-appalto).
- It established that, in principle, planning and design of Public Works is the responsibility of the Public Administration and must be carried out in-house by the contracting authorities. Part of the design work can be contracted out to private firms in case of insufficient expertise. This principle has been only partially applied because local authorities have been unable to expand their payrolls since the late 1990s because of austerity measures. Furthermore, since 2002, there has been a greater emphasis on including the private sector in the design phase as a strategy to reduce public spending.
- It defined a low threshold for non-competitive bidding (it has varied over time between €75,000 and €150,000) and a further threshold (between approximately €2 to €5 million depending on the domain and type of procurement) above which pan-European open RFPs are mandatory.
- It required that all bids’ estimates be based on official reference lists of benchmark unit prices (see section 6) updated annually.
- It capped the size of claims a contractor can make for input cost variations based on a threshold linked to the inflation rate and prohibits changes to the unit costs agreed to in the contract. It established a framework to resolve conflicts between contractors and the state through arbitration rather than lengthier judicial proceedings.
- It introduced the Best-Value-for-Money criteria (offerta economicamente più vantaggiosa) to evaluate bids. Proposals are scored according to technical quality, costs, and schedule. The relative percentages assigned to each category can vary, but technical quality typically represents 50% or more of the overall score. This approach is de facto mandatory for larger procurements, which includes all transit projects. Lowest bidder procurement is still used for smaller, more straightforward procurements based on the Detailed Engineering Design (PE).
Even though many innovative aspects of the 1994 reform were watered down in the following 2002 partial reform (law 166/2002) that pushed for greater involvement of the private sector and introduced project delivery mechanisms, like the General Contractor, that limits the oversight capacity of the contracting authority and outsources important design tasks, the 1994 law and the following amendments established a number of practices and principles that have proven effective in containing costs and improving project delivery.
5.3.5 Constraints and veto points: the issue of historic buildings and archeology
Italian cities boast historically layered, dense and relatively large urban cores that continue to have a central role in the urban economy, thanks in part to longstanding dedicated policies and a robust urban tradition. Thus, most metro rail projects have cut their way through narrow winding streets to serve the dense historic cores.
Italy has a particularly strict and complex set of national and regional laws enforcing the protection of archeology, historic buildings and ensembles, and landscape. The 1948 Republican Constitution specifies the importance of safeguarding heritage in one of its twelve fundamental principles.[29] But heritage protection laws date back to the construction of the post-unitary State. Since 1907, historic buildings and landscape protection falls mostly under the authority of the so-called Soprintendenze (Superintendencies). These are territorial authorities that are under the auspices of the Ministry of Culture and Heritage (MIBACT) and are staffed by career civil servants, mostly having backgrounds in archeology, architecture, history of arts or Beni Culturali (heritage studies). Moreover, the city of Rome has a locally controlled Superintendency (Sovrintendenza Capitolina), a special body within the Municipal administration, first established in 1872 to protect and manage the Archaeological Park of the Imperial Fora, the Aurelian walls, and in general the archeological heritage of ancient Rome. Despite being part of the city’s administration, it enjoys greater autonomy than other agencies and departments.
Thanks to laws that have expanded their powers continuously since the 1930s[30], the Heritage Superintendencies have de facto veto power over any project that may affect an area or a building that is under their jurisdiction, that is most historic city centers and several landscape protection areas. As we will see in the detailed case studies, the severe constraints imposed by the Heritage protection bodies play a significant role in project design and costs, especially in the central areas of Rome, Naples and Milan.
5.3.6 The use of benchmark unit costs: the Prezziari Regionali delle Opere Pubbliche
The use of official unit costs in public works has proven to be a fundamental tool to improve public procurement and stabilize costs. Known as “Prezziari”, these official price lists have been implemented over time[31] and are modeled on what was already a common tool in the private construction sector, where the provincial Chambers of Commerce already published yearly updated reference itemized costs largely used in the private sector since the late 1960s.
In the late 1970s, detailed benchmark unit costs were introduced as the principal tool for determining the base cost of public contracts, but only for specific forms of procurement.[32] Benchmark unit costs became mandatory after the 1994 reform of the general public procurement law,[33] refined following the 2006 public procurement code,[34] notably with the introduction of a homogeneous mechanism for the mid-year revision of the benchmark cost of materials. Furthermore, in the following years, the task to maintain and update the official lists of benchmark unit cost was transferred from single agencies to Regional Governments, in an effort to rationalize the process, facilitate the task and avoid inconsistencies between multiple agencies. Since the late 2000s, Regional Governments publish an annual unit cost list called Prezziario Regionale delle Opere Pubbliche (Prezziari OOPP).
The Prezziari OOPP are detailed lists of itemized benchmark prices for units of finished work, that is, prices that include all the foreseeable input costs to achieve a given quantity of finished work. For example: the cost of one square meter of road paving, one cubic meter of poured concrete with given mechanical characteristics, one linear meter of a sidewalk curb, one linear meter of embedded rail tracks, one converter for an electrical substation at a given voltage, one standard pole of a certain height for an Overhead Line Equipment (OHLE), etc. These prices, called Prezzi Unitari (see figure 7), are expressed in consistent units (square meters, cubic meters, linear meters, piece, etc.) for a given quantity of finished work, and are calculated by factoring in all the relative input cost of materials, labor, theoretical rent costs of tools and machines, as well as transportation costs for the delivery of materials to the construction site and the disposal of waste from demolitions. A fixed percentage is added to account for the general expenses of the contractor (normally around 12-13%) and for the contractor’s anticipated “fair” profit (10%).
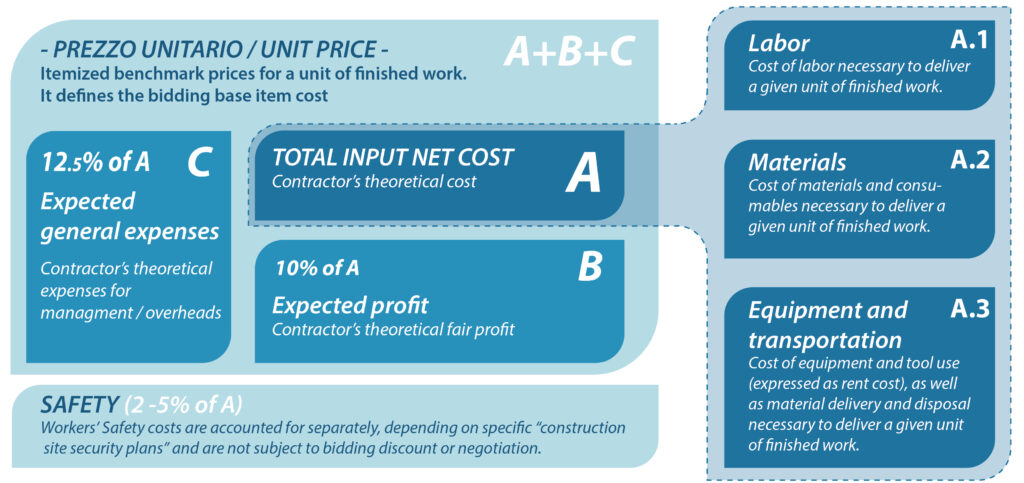
figure 7. A simplified scheme illustrating how benchmark unit prices (Prezzo unitario) are defined.
Reference prices also include disaggregated input costs that can be used by contracting authorities to calculate specific non-standard works and work conditions, such as night work, constrained working space, reduced working hours for noise mitigation, etc. The official list of unit prices is public and freely accessible. They are officially approved and updated yearly by the Regional Governments through a technical commission that includes civil servants and technical experts.[35] Moreover, the Ministry of Infrastructures (MIMS) carries out a mid-year revision of the input cost of raw materials. If during the first six months of the current year the cost of a given raw material has increased or decreased more than 10%[36] over the previous year’s average, contractors can claim direct compensation from the contracting agency for up to half of the increase exceeding the 10% threshold. That compensation can be covered by contingencies.
Reference prices are not price controls. Instead, they are used to set reasonable parameters for bids. By injecting greater transparency into the process, reference prices help weed out anomalously low/ high bids and are used to avoid bidders who submit very low lump sum bids and then seek large change orders to compensate for the low bid after the contract is secured[37]. In fact, bidders must submit their offers by single itemized costs and not by a lump sum in most cases.[38] Eventual change orders will thus be based on the unit price submitted by the contractor for the specific item and cannot be renegotiated except for major changes to the project scope and design or changes that are considered unfair or disruptive for the contractor’s workflow.
Reference Prices and the rule of exclusion for “anomalous bids” have worked well because they have been combined with the “rule of the best value-for-money” (regola dell’offerta economicamente più vantaggiosa) scoring criteria. Best value-for-money contracting scores bids according to a combination of cost (~20-40% of scores), technical quality (~50-80%) and time savings (~0-10%). All contracts greater than €2 million must be assessed via best value-for-money,[39] while low-bid contracting is still used for smaller works. Lump sum contracts are now illegal except for very small contracts or in case of very specific procurements of proprietary technology (that is the case, for example, of the VAL system, as we will see in Turin’s case, but also of proprietary CBTC installed in M1 in Milan).
Finally, reference unit prices work as a tool to set a minimum threshold for labor productivity, as they implicitly define the “reasonable” level of manpower needed to achieve a certain amount of finished work. Better performing contractors that make more efficient use of their resources can achieve a lower bid or larger profit through economies of scale, better construction techniques (that are also accounted for in the technical score of the bidding), etc. On the other hand, it is important to note that reference prices can indirectly incentivize an abuse of sub-contracting, if the contractor tries to reduce labor costs by sub-contracting to small companies or individual free-lancers who are not subject to the or even black market labor through long chains of sub-contracting. For that reason, the use of subcontracting has been more tightly scrutinized after each iteration of the 1994 Code of Public Works.
5.3.7 The “riserve” mechanism: the unsolved problem of extra cost claims
Unlike in the US, allocations for contingencies within the project budget tend to be minimal, on the order of a few percentage points (normally less than 5%) and they can be only used to cover change orders validated by the DL or minor input cost variations accounted for by the official “prezziari’ regular updates and thus granted by the contract (see sections 3.4 and 3.7). Over time, legislation and court decisions have discouraged the use of large contingencies intended to cover any extra-cost claims coming from the contractors during construction, as it can create incentives for post-bid cost increase as funds are already allocated in the budget. Hence, additional claims made by contractors during construction are normally accounted for in the project’s bookkeeping through a mechanism called “riserve.” This system, rooted in the original RD 350/1895 public works Royal Decree and modified several times since,[40] allows a contractor to accept payments from a contracting authority con riserva (literally: conditionally, hence the name) in the project’s official accounts, while advancing claims for unforeseen costs that have not been approved by the DL through an official change order or are not part of the contract provision.
Those extra claims are normally linked to an increase in input costs for the contractors caused by circumstances beyond their control, such as archaeological findings or unexpected geological conditions, cascading delays from other contractors’ work, postponements caused by delayed bureaucratic decisions, etc. The reasons must be detailed by the claimant and quantified in terms of loss caused by a suboptimal use of the contractor’s own resources (for example, the TBM equipment sitting idle or misallocation of labor force). Based on the juridically enshrined principle of “fair compensation” of public suppliers, the contractor can ask for additional compensation of those costs incurred independently, subject to arbitration or, eventually, to a legal decision.
This mechanism has proven to be an unresolved bug in the current procurement process as it can cause lengthy legal proceedings between the contracting agency and the contractors that stall projects for months, and that often continue for several years after the end of construction. The riserve has been used as a tool for contractors to increase their margins and recover ex-post part of the discount offered to win the bid. As this mechanism is used to put pressure on the contracting agency, it is also common for contractors to exaggerate claims accounted for as riserve during the construction phase, even though normally final negotiations result in additional compensation being as low as 10-20% of the claim or around 1-3% of the initial contract for simpler works (like surface rail transit), up to 5-8 %, or even 10% in a few cases, for riskier projects like tunneled metro construction in complex urban contexts.[41] As we will see in Rome’s case, the riserve mechanism remains an unsolved problem that can cause uncontrolled cost escalation, especially when procurement is based on poorly defined project scopes and the contracting authority lacks sufficient supervision capacity.
5.4 Four in-depth cases: Turin, Milan, Rome and Naples
5.4.1 The selected projects
In the second part of the report, we investigate in greater detail five metro projects built during the last two decades, under construction or in advanced stages of planning. The selected projects, located in Turin, Milan, Rome and Naples, total approximately 66 km of new service and 90 stations, accounting for an investment of €9.5 billion in nominal terms or $13.5 billion in 2020 PPP real terms. The selected projects have different technical characteristics, delivery schemes and varying construction costs. Thus, they provide multiple insights into the drivers of construction costs. In particular:
Turin. In In the late 1990s, the capital of Piedmont started to plan its first metro line, the first automated light metro in Italy, based on the VAL 208 rubber-tired technology already deployed in numerous projects in France during the 1980s and 1990s. Turin’s case helps us understand the benefits and drawbacks of traditional Design-Bid-Build project delivery, how it is possible to develop in-house expertise quickly, the importance of standardized station design, and the design and cost implications of adopting light-automated metros, at the time a new technology for Italy, while still delivering high-capacity transit.
Milan. The capital of Lombardy boasts by far the largest metro network in Italy and is undergoing a major expansion with several new lines and extensions recently opened, under construction and planned. Our analysis focuses mainly on line M5, a fully automated light metro line opened between 2013-15 and delivered through a Public-Private Partnership Design-Build Finance-Operate-Maintain (PPP DBFOM) scheme. The construction costs were low, the project experienced limited cost escalation and it was delivered on-time. Line M4, another fully automated light metro currently under construction and poised to open in stages between 2022-23, and a short suburban extension of M1, a heavy metro currently in the early procurement phase, will be briefly discussed too. Milan’s case will mainly highlight the importance of longstanding in-house expertise, emphasizing the role of the municipally owned engineering firm Metropolitana Milanese Spa and how it has retained and leveraged critical in-house technical capacity regardless of the delivery formula.
Rome. The capital of Italy is currently developing its third metro line, MC, that will eventually cross the city from West to North via the heart of the old city core. That project has been selected because of a relevant difference in cost between the outer section (T4-T5) and the city center one (T3) and also because of the use of the “General Contractor” delivery formula, a form of Design-Build. The in-depth analysis of those elements highlights the interplay of external constraints, such as archeology and heritage, with political uncertainties and management issues as mutually reinforcing drivers of cost escalation. Line MB1 has been selected for a direct in-case comparison: built during the same period of MC’s T4-T5, it was instead delivered through Design-Bid-Build at a lower cost.
Naples. The central section of Naples’s line 1 (linea 1 – tratta bassa) has been selected as a relevant case because it represents the most expensive metro project ever built in Italy. The dense urban context and poor geology, the unique delivery scheme inherited from the 1970s, and the customized design choices, particularly for stations, make it an instructive contrast to the other cases.
5.4.2 Cost variation among projects: a quick comparison
Construction costs vary widely among the selected projects, from as low as $116.8 million per km for the Northern Section (Lotto 1) of M5 in Milan to as much as $635 million per km of the city center section of Naples’s line 1, an almost sixfold difference. The in-depth analysis of these projects will illustrate how local circumstances, design choices, delivery formula, and political decisions contributed to these differences despite a common national institutional framework.
Yet, the preliminary analysis of the main cost categories across these projects, which local agencies shared with us, allows us to draw some general conclusions about a few main cost drivers. For the purpose of this analysis, the data have been reorganized into two macro categories and several sub-categories:[42]
- Hard costs
- It includes all civil works; finishings; Mechanical, Electrical Plumbing (MEP) – mechanical (lifts, escalators, and ventilation), non-system electrical, plumbing (fire-extinguishers, sprinklers); eventual costs for the monitoring and reinforcement of the adjacent structures during construction. In three projects (M4, M5 and M1 in Milan) it also includes the cost of civil structures, finishings and MEPs for the Operation & Maintenance (O&M) facilities, that were included in the projects’ scope.
- It includes civil works and outfitting (e.g., bottom filling, catwalks, emergency lights) for tunnels and shafts built for emergency exits, ventilation, and TBM launching; eventual costs for monitoring and reinforcement of the adjacent structures during construction.
- It includes tracks, traction, OHLE/third rail, signaling and/or automation, Supervisory Control And Data Acquistion (SCADA), telecommunications, faregates, platform screen doors.
- It includes all items not directly linked to the construction of the line, such as archeological excavations, park & ride facilities, on-site utilities relocation executed by the contractor, monument conservation, and, in some cases, surface remediation.
- It includes expenses for safety equipment. Italian procurement law mandates a separate costed out project-tailored “work safety plan,” as they are not subject to bidding.
- Soft cost
- General Soft Cost. It includes planning, design and management cost, land acquisition, contingencies, utilities relocation executed by third parties, such as private or municipal utilities companies. It also includes transactions for the settlement of contractor’s compensable claims for projects that have been concluded.
- A.T. It includes the Value-Added Tax (VAT or IVA in Italian) on construction (10%) and professional services (20-22%). A few transit projects done as PPP, such as M5 in Milan, have been exempted from paying V.A.T. for a short period of time.
The proportion of the different categories varies widely between projects, as shown in figure 8, as does the absolute cost per km of the different categories, shown in figure 9.
Relative incidence of hard and soft costs. Hard costs vary between 58.2% and 88.9% of overall project costs. This wide variation depends in part on the delivery formula used in the different projects but also the way soft cost are accounted for within individual projects, as a uniform way of reporting costs didn’t emerge until the mid-2000s. As we will see in greater detail in the related chapters, most of Naples’s line 1 soft cost’s are “hidden” as part of the hard cost, due to the outdated concession formula used to deliver that project, while the very high incidence of soft cost on the Bologna – Conca d’Oro section of line B is the result of particularly high compensable claims due to a change in the environmental classification of TBM excavated ground intervened during construction. If we exclude the aforementioned outliers, the range of soft costs is between 18-32% of total project costs, with most of the projects being in the mid-20s%. The Value-Added Tax accounts for 10-12% of projects’ total costs. It is worth noting that, unlike in many , such as Montréal’s blue line, Seattle’s Sound Transit 3 and New York’s Second Avenue Subway, land acquisition accounts for a very minor fraction, 0.9 % of the total cost on average and never more than 2.9 %. This is both the result of expropriation laws less favorable to private owners and, mostly, to the minimization of land acquisition.
Hard costs. Fully automated light metros have a higher incidence of system-related costs on the overall cost, at between 15.4% for M4 in Milan and 32.4% in Turin’s M1 phases 1 & 2. System’s cost on a per km basis (figure 9) is also notably higher in automated metros, accounting for between $21.5 million/km and $49.6 million/km, while it can be as low as $9.4 million/km in heavy metros with traditional signaling, like MB1 in Rome. The rubber-tired VAL 208 system used in Turin explains the M1 premium over the already costlier Hitachi Rail steel-on-steel system used in the other automated metros (M4, M5, MC). The very high costs ($ 45.8 million/km) of Naples’s line 1 is due to the implementation of a new signaling and communication system on the whole line being applied to.
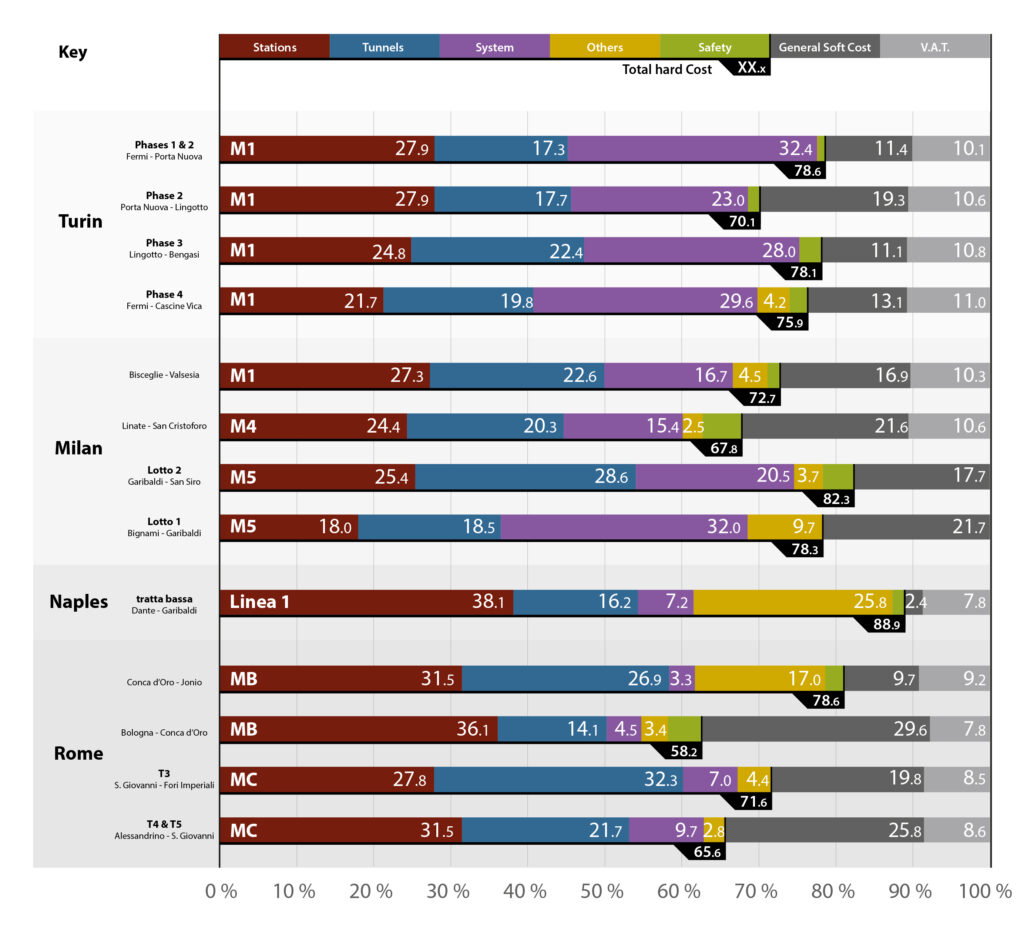
figure 8. Incidence of the different categories on the overall capital cost of the selected projects.
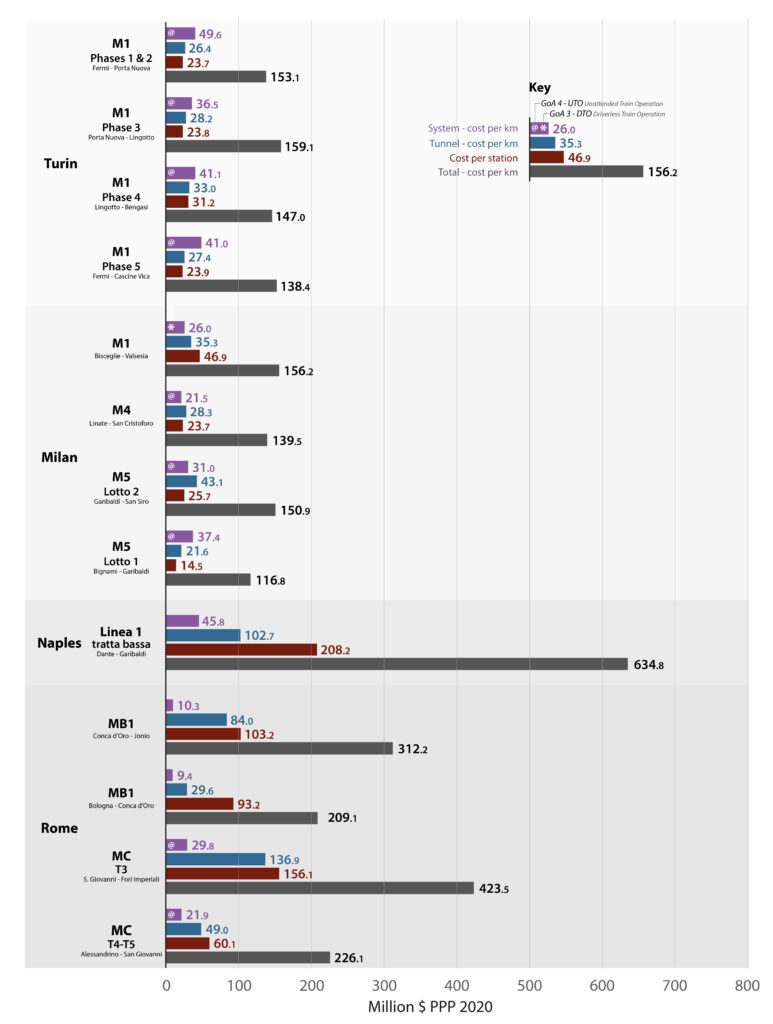
figure 9. Actualized cost per km in $ PPP 2020 for the selected projects and related cost/km or cost/station of the most relevant categories of hard cost.
Focus on stations. Among the seven projects we have obtained detailed cost breakdowns for, the civil works, finishing and MEPs of stations and O&M centers represent between 23 to 62% of the hard costs. The wide variation across the cases studied depends on a combination of lower costs for civil structures due to smaller station footprints for light automated metros, partially compensated by the fact that the analyzed light metros tend to have more closely spaced stations (740 m on average) than heavy metros (1,050 meters). Light automated metros show a consistent average cost per station between $14.5 million (M5 – Lotto 1) and $31.2 million (M1 – Phase 4), while heavy metros have a wider range.
The analysis of the individual construction cost of 82 underground stations across six of the selected projects [43] (figure 10, figure 11, figure 12) highlights a remarkable range in cost and a clear divide between metro typologies. The median station cost in $PPP 2020 is $36.9 million, with the lowest being $7.8 million (Isola on Milan’s M5) and the highest being $283.5 million (Municipio on Naples’s line 1) (figure 10). Considering platform length, light metro systems (50-55 m) have a much lower median cost per station, at $17.2 million, while heavy metros (110-150 m platforms) have a median of $62.9 million (figure 11). Moreover, 11 out of the 15 costliest stations in the database are situated within historic cores[44] and were built as part of heavy metro lines 1 (Naples) and MC (Rome), with a median cost of $147.1 million (figure 12). Finally, station cost are positively correlated with depth when controlling for platform length.[45] Station costs per cubic meter based on the station’s “gross volume”[46] is also positively correlated with depth, suggesting that relative costs do not increase linearly as they are built deeper.
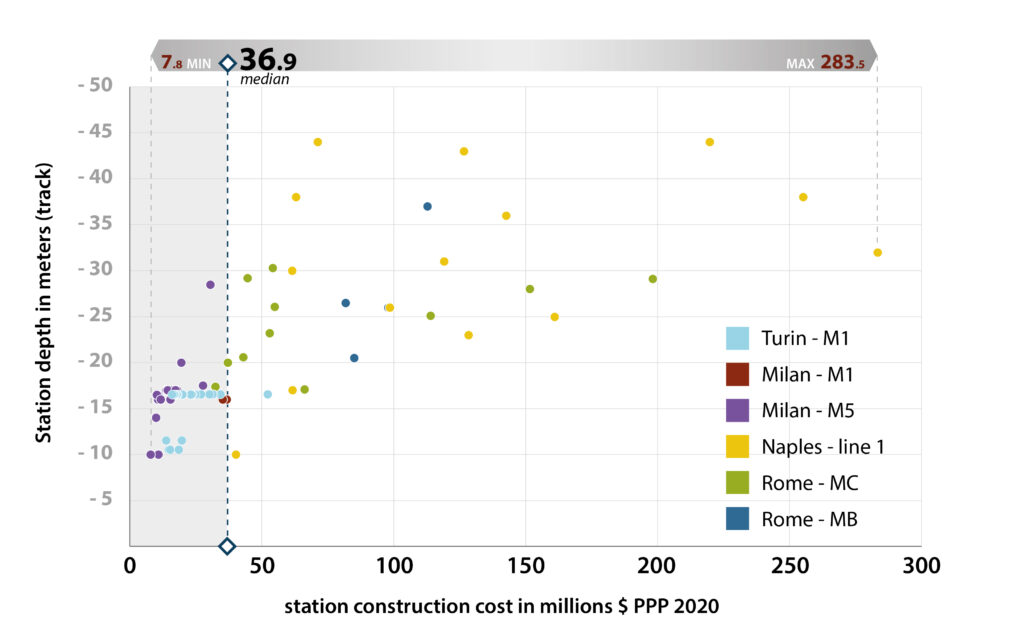
figure 10. Metro station costs by project. Total hard construction costs of each station by project in relation to the station’s depth, as measured at track level. Costs are actualized to $ PPP 2020 (n=82).
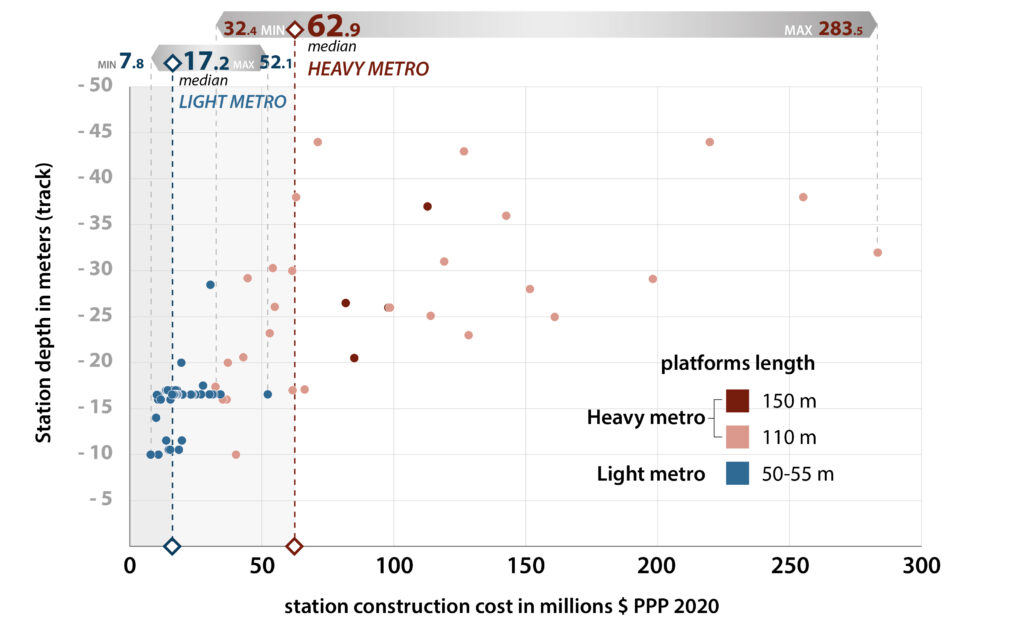
figure 10. Metro station costs by project. Total hard construction costs of each station by project in relation to the station’s depth, as measured at track level. Costs are actualized to $ PPP 2020 (n=82).
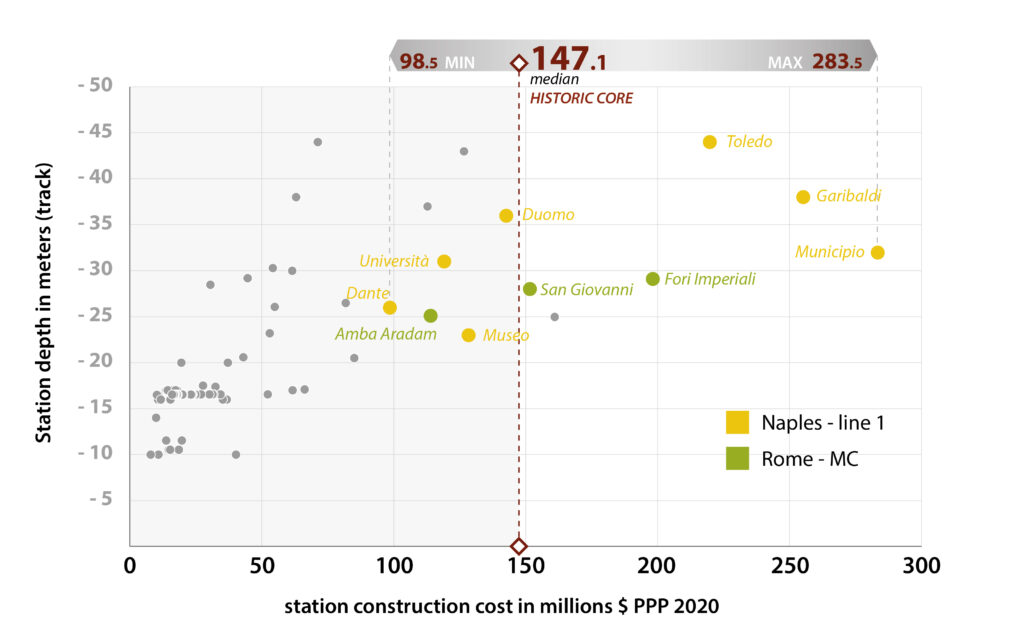
figure 12. Metro station cost by location. Distribution of hard costs for station construction based on the station’s depth, as measured at track level. Costs are actualized to $ PPP 2020
5.5 Turin
5.5.1 Introduction
Turin (850,000 inhabitants in the city proper, 1.8 million in the metro area) is the capital city of Piedmont, in Northwestern Italy. The city has had plans to build underground urban rail since the beginning of the 20th century. During the 1930s, a short city-center tunnel was built as part of an urban renewal program, but it was never used for regular service. Further plans were made during the 1960s, when the city was booming as the Italian automotive capital, but they never materialized into anything concrete.
During the early 1990s the city secured an initial grant from the central government, thanks to law 211/92, and a second one was granted as part of the financial support for hosting the 2006 Winter Olympics, allowing for the construction of phases 1 and 2 to take place simultaneously. Ground was finally broken at the end of 2000 for phase 1 and the following year for phase 2, both of which were completed respectively in 2006 and 2007. Funds for phase 3 were secured in anticipation of the celebration of 150 years of National Unification,[47] and phase 3 opened in March 2011. A further extension (phase 4) toward the South went into revenue service in April 2021 and an extension toward the West (phase 5) is under construction, with opening expected in early 2024. Funds for an initial section of line M2 were secured in 2019 with ground-breaking planned in 2023-24. In 2019, the metro carried approximately 150,000 daily riders, running at two-minute intervals during the peak period. In addition to the metro, the city has a 91.7-km tramway network that serves 180,000 daily riders and a suburban rail network (SFM) using the North-South rail link completed in the early 2010s as its central spine.
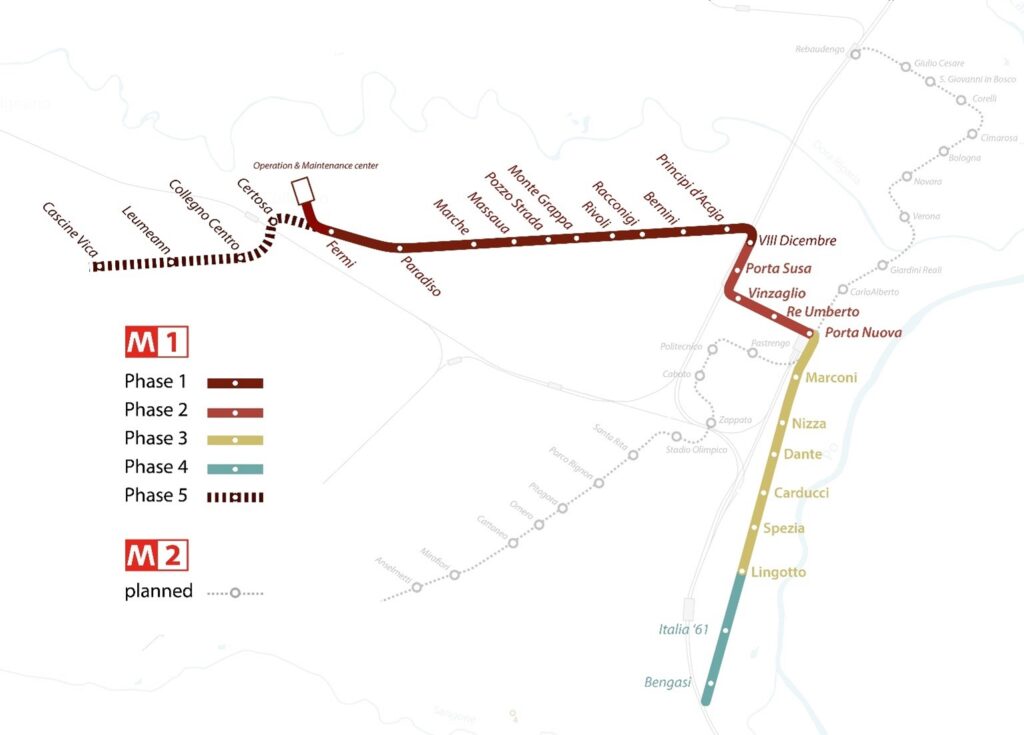
figure 13. Map of line M1 highlighting the different construction phases.
5.5.2 Line M1: project overview
As of 2021, Turin’s first metro line, which is fully underground, extends for 15.1 kms and has 21 stations, running from West to South via the two main railway stations where it connects with long distance trains and suburban service. M1 uses the same VAL 208 automated rubber-tired light metro technology first experimented with in Lille, France in the late 1980s and then deployed in Toulouse and Rennes. Unlike those cities, Turin opted for longer 52-m trainsets comprised of two 26-m trains instead of only one, to accommodate higher than expected demand. Another characteristic of VAL 208 is its narrowness, as trains are , much less than the 2.85 m standard of postwar heavy metros. chose VAL because it was the only proven light metro automated technology available in the early 1990s.[48] At the same time, Matra, the developer of the VAL system, was also briefly owned by FIAT during the 1990s before being sold to Siemens, and that factor is said to have possibly influenced Turin’s choice to select a domestic supplier.
The project was initially managed by the city’s transit agency, GTT (formerly SATTI), that was mandated by the municipality to plan, design, and deliver the project. In 2010, the city transferred the ownership of the line and the task of supervising and delivering the new extensions and other mass transit projects from GTT to a newly established municipally-owned company, named InfraTo,[49] in order to separate the infrastructure ownership from operations, as required by the EU rules to open up the transit operations market.
Table 2. M1 - Main Characteristics
| Phase 1-2 | Phase 3 | Phase 4 | Phase 5 | TOTAL | |
|---|---|---|---|---|---|
| Years (Construction start-end) | 2000 - 2006 | 2001 - 07 | 2006 - 11 | 2012- 21 | - |
| Length (km) | 9.6 | 3.6 | 1.9 | 3.2 | 18.3 |
| Stations | 15 | 6 | 2 | 4 | 27 |
| Station depth | 16.5 m | 16.5 m | 16.5 m | 11.5 - 16.5 m | - |
| Cost Nominal in million € | €788 | €351 | €189 | €340 | €1,669 |
| $PPP 2020 in million | $1,275 | $513 | $252 | $443 | $2,483 |
| Cost/km (In million PPP/km) | $133.1 | $143.7 | $133.8 | $138.4 | $136.2 |
| Alignment | underground TBM single bore tunnel Ø 6.7m | underground TBM single bore tunnel Ø 6.7m | underground TBM single bore tunnel Ø 6.7m | underground NATM single bore tunnel Ø 6.7m | - |
| Projected maximum capacity | 23,000 pphpd at 67 seconds minimum interval. | ||||
| Vehicles | VAL 208, rubber-tired automated GoA 4 (2.08m wide x 52m long), 440 places | ||||
| Platform length | 55 m | ||||
| Delivery method | Design-Bid-Build | ||||
| Financing | 100% public | ||||
5.5.3 Cost and design choices
Phases 1 through 5 of Turin’s metro have a cumulative capital cost in nominal terms of €1.669 million. Considering that the project was been implemented over a two-decade period, the actualized cost of all the phases in $PPP 2020 terms is around $2.48 billion for 18.3 km and 27 stations, resulting in an overall cost of $136 million per km. Hard costs account for €1.27 billion or 76.2 % of the overall cost. As in most projects, a significant portion of the soft costs are represented by the V.A.T., while the remaining 12% comprise professional services, planning and management costs, land acquisition, commissioning and testing, etc. (See figure 15).
The nominal cost in euros has grown over time for the subsequent phases: €82 million/km for phase 1-2, €98 million/km for phase 3, €101 million/km for phase 4, €106 million/km for phase 5. Nevertheless, when inflation is accounted for, the per km cost is consistent among the different phases and it doesn’t show an upward trend: $133 million/km for phase 1-2, $143 million/km for phase 3, $134 million/km for phase 5. Moreover, it is worth noting that the first three phases have a shorter interstation spacing, every 620 meters on average, than phases 4 and 5, which, respectively, have a station every 940 meters and 800 meters.
Phases 1 through 3 were all completed on time and on budget, taking on average 4.5 – 5 years to build. Phase 4, on the contrary, was mired in delays and incurred a minor cost overrun. Coming on the heels of the 2008 recession and the 2010-2012 European debt crisis, the initial Phase 4 contractor found itself in difficulties. InfraTo suspended works in 2014 and retendered the contract while solving disputes with unpaid subcontractors. All of these additional hurdles added costs and delays. Work finally resumed in 2018 and the extension opened in 2021. Phase 5, which is approximately 30% completed, is planned to be commissioned by early 2024 and appears to be on track and on budget.
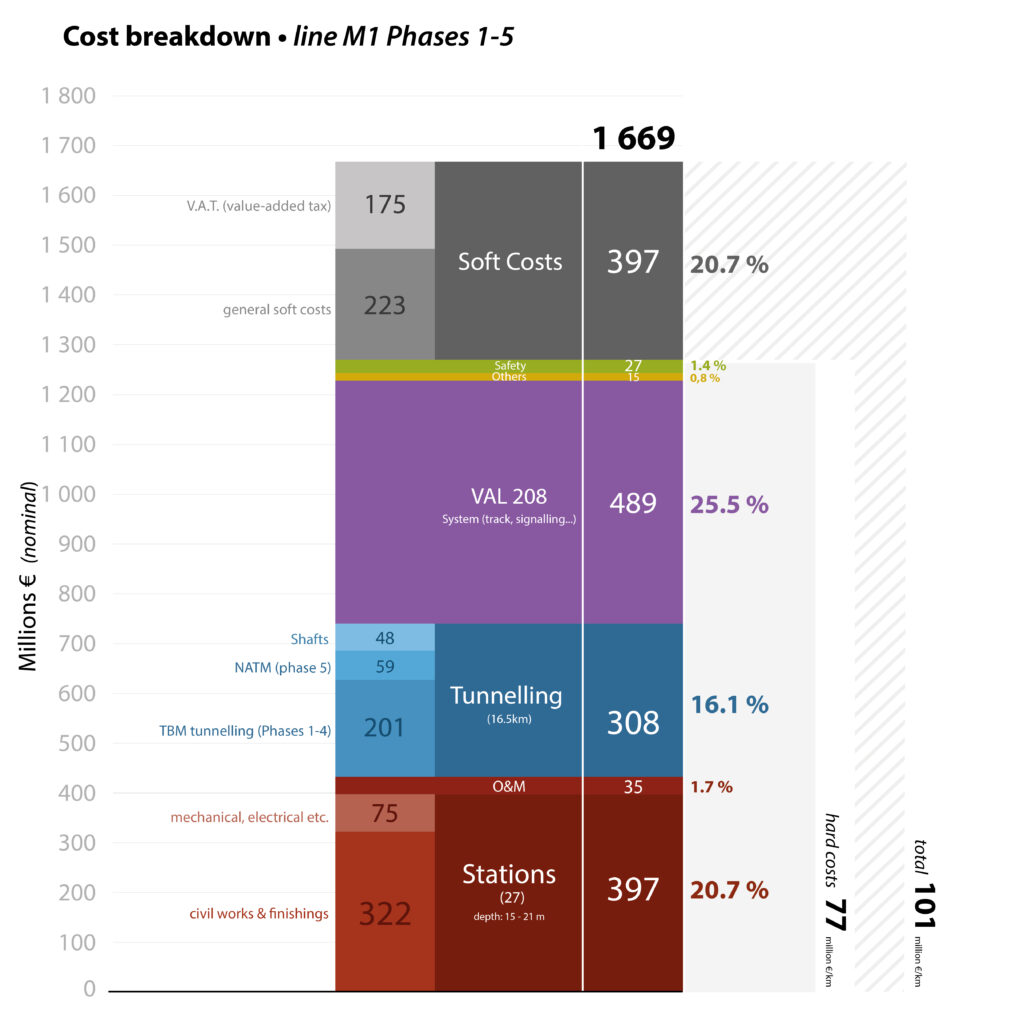
figure 14. Detailed cost breakdown for the five phases of M1 metro line in Turin
VAL: a costly technology. A remarkable feature of Turin’s metro is the very high cost of the system’s components – such as tracks and the guideway for the rubber tires, automation, platform screen doors, SCADA, ticketing and faregates, etc. – as a proportion of the overall cost. The €489 million in systems costs, or 25.5% of the overall cost or 38.5% of the hard costs, is the highest percentage among the studied cases. As mentioned in the previous chapter, that means an outstanding €27.1 million per km in real terms or $40.2 million per km in $PPP 2020 terms for the 5 phases. The bulk of this cost is represented by the automation technology and by the aforementioned guideway.
Tunneling: exploiting the potential of VAL to its maximum. Despite being a relatively costly technology, VAL allows for a very flexible deployment and can reduce costs associated with civil works. VAL allows for a flexible horizontal and vertical geometry of tunnels, being able to navigate a horizontal radius as tight as 90m in normal operations and down to 40m in particular circumstances and climb continuous gradients as steep as 7%. Moreover, thanks to its narrow dimensions VAL 208 can fit into smaller diameter tunnels. Thus, a 6.7m-wide bore can accommodate both tracks in a single tunnel whose diameter is only slightly larger than what is normally used for one track in standard metros. As a result, the per kilometer cost of tunnel excavation is very consistent across all phases, at between $22.9 and $23.9 million per kilometer. Interestingly, this cost is similar for both TBM excavations (phases 1-4) and for the NATM-like “traditional” one used in the under construction phase 5. It is worth pointing out that Turin lays upon an old alluvial soil with geotechnical characteristics more favorable to excavation compared to the other three cities studied in this report, notably because of a much deeper water table in many parts of the city where line M1 was built.
Stations: a very standardized design. Station costs vary between €8.7 and €32.2 million in nominal terms, but most of them cluster around between €13 and €18 million each in real 2020 terms (figure 15), with the shallow stations currently under construction for phase 5 being the least expensive in actualized terms. In terms of parametric cost relative to volume, most stations cost between €425 and €630 per cubic meter in real terms. The main exceptions are Italia ’61 and Bengasi, the stations built as part of the unfortunate phase 4 plagued by the contractor’s financial difficulties and considerably delayed.
The reason behind consistent costs across stations is an extremely standardized design. In the first four phases, all the stations but four have the same exact design. The bulk of the typical 30,000 cubic meter volume of each standard station is made of a 65m x 22m box, 21m deep with track located at approximately 16.5m below the surface. A mezzanine for faregates and technical rooms is located on . All the stations have side platforms and a generally open volume without full intermediate slabs. A central flight of fixed stairs and two escalators connect the mezzanine to an open landing over the tracks where a stair and an escalator reach the platform level. A separate longer up-only escalator per platform provides a more direct exit route to facilitate outflow and platform level clearance. Stations are fully accessible: each station also has one or two lifts from the street level to the mezzanine and one lift connecting each platform. In addition to reducing upfront capital cost, GTT claims that by standardizing station design and the selecting durable finishing materials (nonporous stone and glass) reduces maintenance cost (see figure 16).
Another unique characteristic of Turin’s metro is the complete separation of the tunnel and the platforms. The track area is isolated from the passenger areas of the station via full-length platform screen doors and a glass vault. As a consequence, the requirements for smoke removal in the case of a fire are reduced, the overall air quality within the station is improved because the particulate pollution produced by braking and rubber tires is filtered out, and it’s easier to keep stations cool because the heat given off by the train doesn’t affect platform temperatures (see figure 16).
All stations are located directly under the street surface or in Turin’s larger squares, as the line mostly follows the 19th century wide multi-way boulevards typical of the city’s urban morphology. The station’s volumes were all excavated using the cut-and-cover bottom-up technique. In order to maximize labor productivity during construction, which lasted between three and four years, traffic was diverted to the lateral access lanes of the boulevards or re-routed along parallel streets, and, occasionally, there were full street closures. The access from street level to the mezzanine are also located within the street, either on the boulevard medians, sidewalks or in public squares. In the longer section under Corso Francia, shafts for ventilation and for natural lighting of the mezzanine are integrated with the landscaped median along the boulevard, that was reconfigured into a more pedestrian friendly “complete street” after construction[50] (see figure 16).
The most notable exceptions, both in terms of cost and design, are a few non-standard stations and those located in areas with a high underground water table. XVIII Dicembre, Porta Susa and Porta Nuova serve the two main train stations and provide connections to the tramway network and are larger stations with additional escalators and lifts to cater to larger crowds. Porta Susa stands out as the most expensive station along the line. It cost €32.2 million in nominal terms and more than €40 ($52 million) in real 2020 terms. As the main transit hub of the city and future interchange between lines M1 and M2, the station has a much larger volume, has more entrances, a wider mezzanine, and includes direct access form the rail station’s main hall. Moreover, the phase 3 stations, despite having the same standard design, are all located below the water table; thus, requiring jet grouting to waterproof the bottom of the station’s box prior to full excavation, a necessity that increased costs relative to standard stations built in the previous two phases.[51]
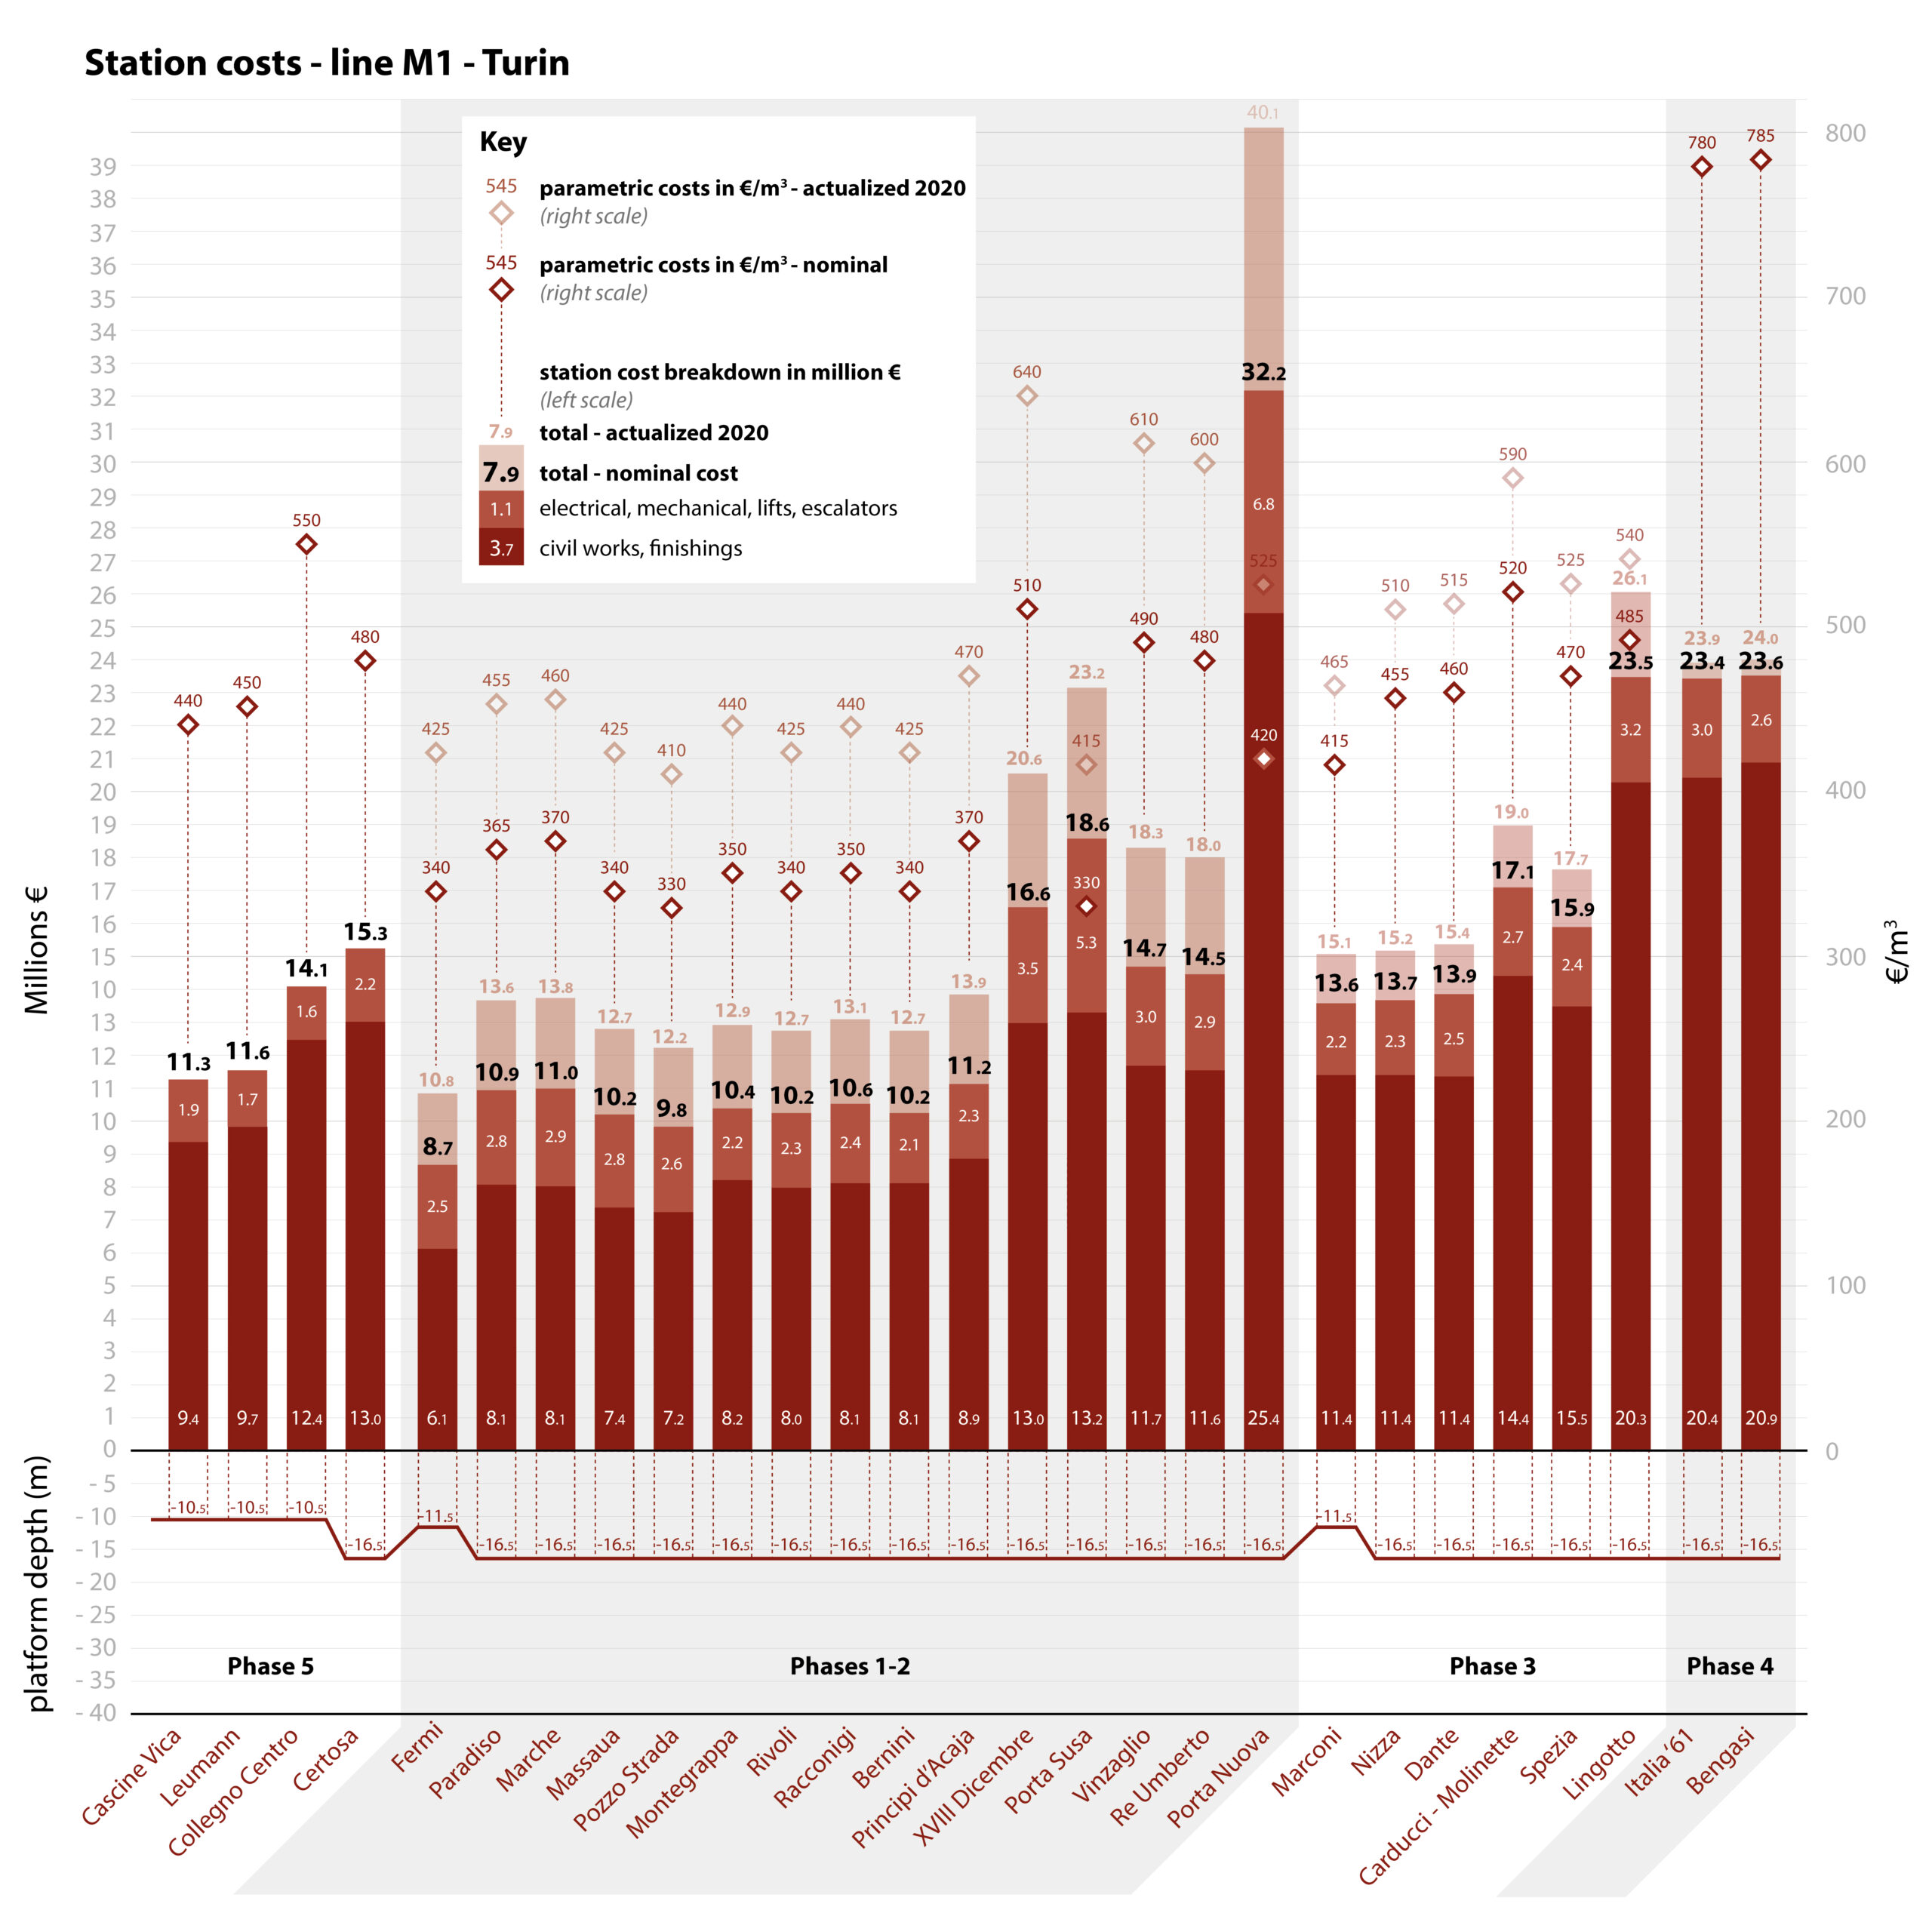
figure 15. Detailed cost breakdown of Turin’s M1 stations.
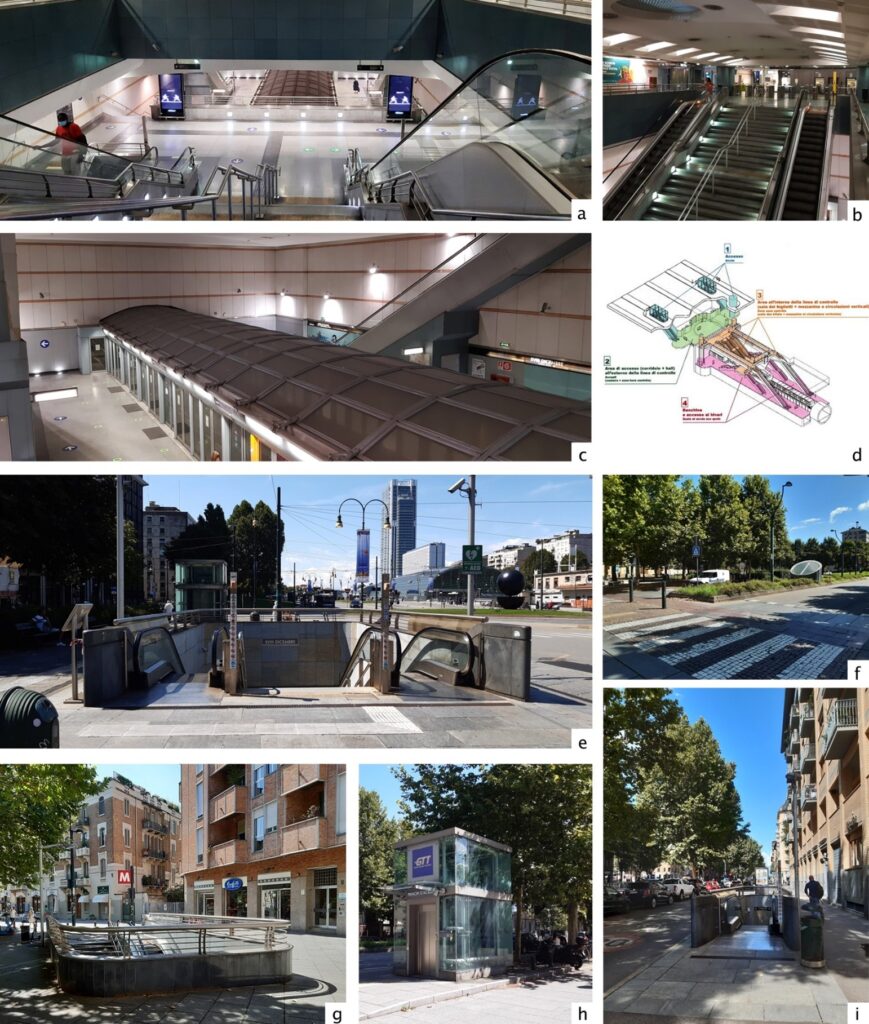
figure 16. Pictures of typical M1 stations. (a-b) Stairs from the mezzanine to the intermediate level. (c) Platform level with the tunnel vault. (d) axonometric diagram of the typical station. (e,g,h,i) Typical main and secondary entrances. (f) Landscaped boulevard median integrating natural light and ventilation shafts.
5.5.4 Building in-house expertise from scratch for an effective Design-Bid-Build
When the project started in the late 1990s, GTT and the city of Turin had extensive experience with tramway operations and construction but little with underground urban rail. The city appointed one of its own chief engineers as the head of the M1 design unit established within GTT and hired a small group of professionals, around fifteen to twenty people, to staff the R.U.P.[52] project delivery office. They were mainly recruited from either the private sector, notably companies with a “general contractor” profile, or other public agencies, with engineering (civil, rail, electronics) being the prevailing domain of expertise on the team.
The first three phases of the project were entirely delivered through a traditional Design-Bid-Build formula, with planning and design carried out partly in-house by GTT (later InfraTo), and partly by external consultants. The early planning, the preliminary and the final design were all done in-house with the support of a “strategic knowledge transfer” consultancy contract with the French team of experts that worked on Rennes’s VAL metro within the French city’s transit agency. Later, GTT itself helped Brescia’s transit agency develop its own light automated metro, leveraging the knowledge acquired from the French and its own field experience gained while building M1.
A second external support consultancy contract was awarded to a French architecture firm[53]
who had previous experience in metro station design, to help devise the project’s “chart of architecture,” defining the main elements of the standard design for stations described above. The architect’s concept was then refined in-house, notably by further simplifying the design (from two ovals to a simpler parallelepiped). Other smaller external contracts were awarded for ad hoc sectoral studies, such as geological and archeological preliminary investigations. The Detailed Engineering Design (PE) and the work supervision (Direzione Lavori – DL), a labor-intensive activity that couldn’t be carried out by the limited in-house project team, were awarded to an external engineering firm, with the R.U.P. office holding the function of High Supervision (Alta Sorveglianza – AS).[54]
For the first three phases, around twenty construction and design packages were awarded, organized around three main items: i) civil works, with different contracts for tunneling and stations; ii) finishings and MEPs; iii) the development and installation of the whole VAL system (tracks, automation, trains), was awarded without an open tendering process to Matra/Transima who owned the patent. For phases 1-3, Requests for Proposal (RFP) were based on the PE, the most advanced level of design, while for phases 4 and 5 the RFP was an “integrated procurement” that allows the contractors to finalize the Detailed Engineering Design (PE) based on the final one (PD – 90% design) provided by contracting agency.
5.5.5 Maximizing technological benefits, standardized station design and strong in-house supervision
Turin’s M1 case, with its remarkably stable construction costs over time, the mostly on-time delivery performances, and the overall design choices provides three main positive lessons and two cautionary warnings.
First, Turin’s M1 maximized the advantages of the light automated metro technology by tailoring the project’s design around the specific characteristics of the VAL 208 technology: a very flexible geometry for the alignment, but most of all the narrow and relatively short trainsets compensated by the very high frequency that the VAL automated rubber-tired technology permits, delivering a current hourly capacity of 15,000 passengers per direction (pphpd) that can be increased to 23,000 pphpd with a larger fleet. That means a capacity higher than many North American LRTs, that have longer and wider trainsets but much less frequent service due to limits imposed by level-running and manual operation. Privileging electronics over concrete, Turin built a line that caters to 150,000 daily riders. This translates to a 10,000 riders per km, and a per rider capital cost of around $16,000.[55]
Secondly, the agency took advantage of specific out-of-agency knowledge by hiring architects with previous experience in metro station design, but without indulging the temptation to commission spectacular architecture and overly customized designs we see in many contemporary metro projects, and we will see in Naples’s case. Instead of landmark architecture, the project’s team at GTT/InfraTo mandated the architecture firm to devise a straightforward design, favoring legibility, durability of materials and ease of flow inside of the station as the main design principles. Nevertheless, the overall user experience is extremely pleasant as stations are plain but functional, bright, clean, and easy to navigate.
Thirdly, Turin was able to do so with limited initial in-house expertise by “learning from others.” Leveraging the experience of Rennes, a city that had deployed the same VAL 208 system only a few years before, Turin’s GTT quickly built up the necessary in-house skills to deliver a complex project on time and budget. As the first city to import light metro technology to Italy, Turin has supported the diffusion of the necessary knowledge to other domestic agencies. Even with a relatively small team, the R.U.P. project management office did a good job supervising this novel project, thanks to a staff encompassing all the necessary technical skills in addition to managerial capacity. Even if the retention of this capacity has proven challenging because of the slowdown of metro construction after the conclusion of phase 3, InfraTo has been able to deliver the subsequent extensions and is currently staffing-up again as it prepares to build a second line and more extensions.
It is worth pointing that some contextual positive and negative elements that had an effect on the project are beyond the control of the project management and policymakers: on the positive side, the relatively good soil under the city and an urban morphology dominated by wide multi-way boulevards facilitated the project’s construction within a developed urban context. On the other hand, the deep liquidity crisis that hit the Italian construction sector in the 2012-14 cannot be blamed on the local construction industry.
Finally, Turin’s case offers some cautionary tales for policy-makers. The VAL 208 system is both more expensive than other comparable light automated metro solutions in terms of upfront costs and bears a much higher risk of early obsolescence and technological lock-in with subsequent expansions and modernizations. The choice of a patented, proprietary technology that was discontinued by Siemens[56] makes it difficult for InfraTo to expand the fleet. The recent RFP for the procurement of new rolling stock, that will have to be specially designed by the contractor, comes with one of the highest per meter costs of any metro trainset built in Europe in recent years. The same ongoing procurement for the automation system from analog to digital has proven equally challenging and costly.
5.6 Milan: lines M5 and M4
5.6.1 Introduction
The city of Milan is the economic capital of Italy and the center of the largest metropolitan area in the country (1.4 million inhabitants in the city proper and 4.9 million in the metropolitan area). As of 2021, the Milan Metro, the largest in Italy, is 96.8 route kilometers (60.1 mi) with 113 stations and four lines that carry 1.35 million unlinked trips per day. A fifth line, M4, is currently in an advanced stage of construction and poised to open between 2022-2023, bringing the network to 110 route kilometers. Several other expansions of existing lines are also under construction or in advanced design and will open throughout the 2020s, notably a 12.6 km northern extension of M5 to Monza. Beside its metro, Milan’s extensive legacy tramway network spans 180 km and carries 290,000 daily passengers. Milan is also the center of a 12-line suburban rail network (linee S), which includes a 6-km cross-city tunnel (passante ferroviario). Services stretch 450 km into the suburbs and caters to 350,000 users on an average weekday. Finally, several Regional and Regional Express rail lines connect the city’s core with the wider region.[57]
The history of Milan’s urban rail network has a number of interesting features. After several projects, early planning and failed attempts through the first half of the 20th century, in 1955, the city of Milan established a municipally-owned company, called Metropolitana Milanese spa (MM), tasked with the design and management of metro construction. It is still the engineering arm of the municipality, and plays the important role of providing effective in-house expertise. Metro Milan’s first line, line M1 – Red Line, opened in 1964 as the initial section of a planned three-line network. The system continued expanding through the seventies and eighties, but construction halted during the 1990s and early 2000s, mostly linked to the already-mentioned generalized slowdown in public works during that period.
Even though data for historic construction costs before the 1990s are less reliable,[58] and cost numbers for the M1 and M2 extensions built in the late 1970s and 1980s couldn’t be retrieved, construction costs since the 1950s cluster below the $200 million/km threshold, after adjusting for inflation, with the two above ground extensions in the database costing between $8.7-$18.7 million/km. M3’s initial 11.8-km section between San Donato and Zara, opened in the early 1990s, is the notable exception to these generally low cost projects. It is reported[59] to have cost 2.3 trillion Lira or $275 million/km in today’s real term. M3 was central in the Tangentopoli scandal that emerged in the late 1980s and resulted in the already-mentioned 1990s Mani Pulite sweeping investigation and trial.
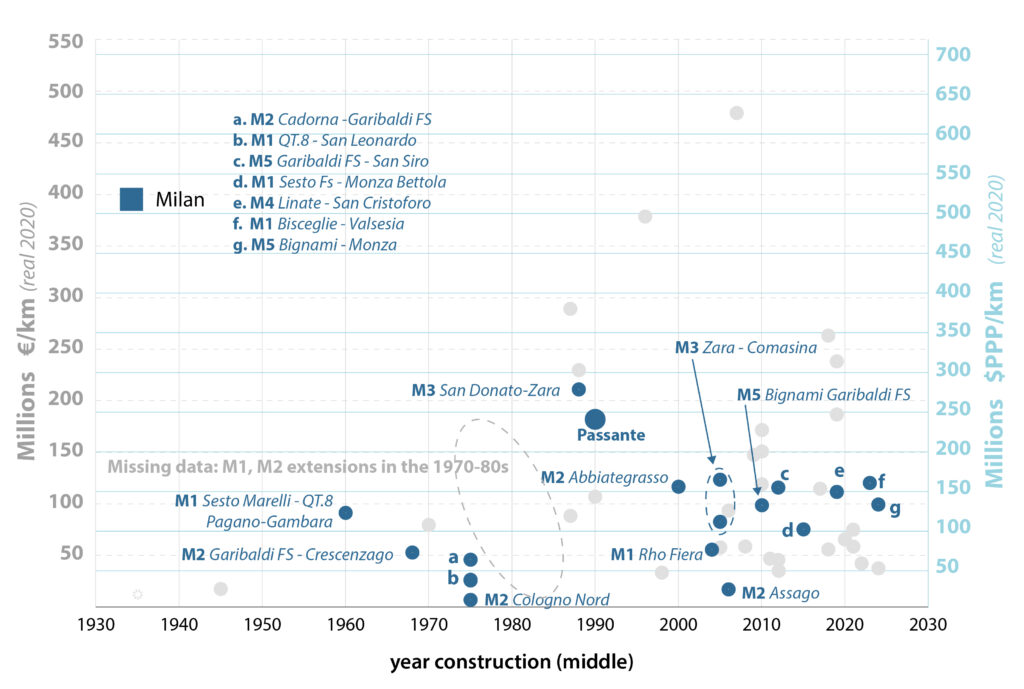
figure 17. Historic costs of metro projects in Milan since the 1960s
In our in-depth case, we will focus on M5, one of the latest additions to the network and the soon-to-open M4. M5 is part of the new generation of “light” automated metros which offers high peak capacity (above 20,000 pphpd) using short trainsets (50-55m) running at very high frequencies (< 90 seconds) as a way to reduce construction and operating costs while increasing operations flexibility. Both lines use Hitachi Rail (formerly AnsaldoBreda) automated rolling stock and signalling, similar to the systems operating in Copenhagen, Brescia and Taipei. Both lines have been delivered through Public-Private Partnerships (PPP), albeit with different DBFOM concession arrangements. Our detailed analysis will mostly focus on M5, as M4 costs are not entirely settled. Yet, we will refer briefly to M4 and an upcoming heavy metro extension of line M1 to Baggio,[60] to show that relative low costs are a common feature of Milan’s metro projects regardless of the delivery scheme and technology.
5.6.2 The role of Metropolitana Milanese (MM)
Metropolitana Milanese S.p.a. (MM) is a municipally-owned engineering company originally established in 1955 by the city of Milan to design, build and operate the city’s urban rail network under a concession regime. In 1964, after the city decided to consolidate the subway and surface transit operations in the hands of Azienda Trasporti Milanesi (ATM), the municipal transit agency, MM became the in-house engineering arm of the city. Since its founding, MM has been responsible for planning and designing the metro network, the tramway network’s modern expansion, and the cross-city suburban rail tunnel Passante. As the pioneer of metro construction, MM developed new excavation techniques, namely the “Milan method,” which uses slurry walls and top-down techniques to build shallow cut-and-cover. This technique set the standard for tunnel construction in all subsequent metro projects in Italy for decades. Since MM is technically an engineering firm, it has also worked as an external consultant to the design and development of several metro rail projects in Italy since the 1970s (notably Naples and Rome) and, more recently, abroad, for example for Riyadh’s and Thessaloniki’s metros as part of broader consortia of Italian Design-Build contractors. More recently, MM has expanded into a municipal engineering and utility agency taking on a broader mandate managing the city’s water network, social housing stock and the general maintenance of the city’s urban infrastructure.[61] As of 2020, MM has almost 1,300 employees across four divisions, and while only 16% of its revenues come directly from engineering services,[62] by consolidating all municipal infrastructure and engineering services within a single entity has allowed MM maintain and develop its engineering expertise and provide a more stable stream of work and revenues.
The MM case is notable because it represents the oldest and most durable example of how in-house engineering for public works has been retained over time at the municipal level. Milan, that owns 100% of the shares of the company, is regulated with a long-term framework consultancy contract that allows the municipality to directly award engineering contracts to MM without public tendering at a fixed discount of -28% compared to the reference professional rates established by the Ministry of Justice. This arrangement allows MM to seek more profitable external consultancy contracts while retaining its role as the city’s in-house engineering division.
5.6.3 Line M5: project overview
M5 is Milan’s fourth metro line. It crosses the city form North to East and runs underground for 12.9 km and serves 19 stations. Unlike the other lines, it doesn’t connect to the city’s historic core. Rather, it runs through the modern CBD situated in the Porta Garibaldi station area, a major regional transit hub. M5 connects with M3, M1, and M2 and the Passante cross-city rail link, and carried 171,000 daily passengers on an average weekday in 2019.[63] It is fully automated and runs peak headways of 180 seconds, while minimum design headways can be as low as 75 seconds.
The line was opened in sections between 2013 and 2015, with works starting in 2007 for the Northern section (Lotto 1) and in 2010 for the Western section (Lotto 2). M5 was delivered through a Design-Build-Finance-Operate-Maintain PPP formula and was funded with a mix of private and public sources from the local and national governments. The concessionaire will operate the line until December 2040 and will recover its investment through a yearly fee paid by the city that covers operation costs and buy-back of the infrastructure.
M5 is the culmination of combining two planned lines into one during the planning stage and early construction phase. The northern section of the line was initially envisioned in the 1990s as the conversion to pre-metro of a tramway line. It was eventually be extended further out to serve the vast crown of sprawling towns between Milan and Monza, once served by an extensive interurban tramway network. The 2001 mobility plan opted instead for a light metro technology, modelled after what was being planned and built at the time in Turin, Brescia and other cities in Europe. In 2006, also the plans for the Western section of the line, initially envisioned as a pre-metro, were converted to light metro (called M6). Both lines were intended to terminate in Porta Garibaldi on two sides of the M2 metro station. It was only after the DBFOM contract for the northern section of the line (Lotto 1) was awarded to the consortium Metro 5 spa in 2006 that the city decided to merge the two lines into a single project, necessitating a complete redesign of the Garibaldi FS node to allow for through running between the two sections. Rather than issuing a new tender, the city of Milan awarded the construction of the Western Section directly to Metro 5 spa in order to complete it in time for the 2015 Expo.
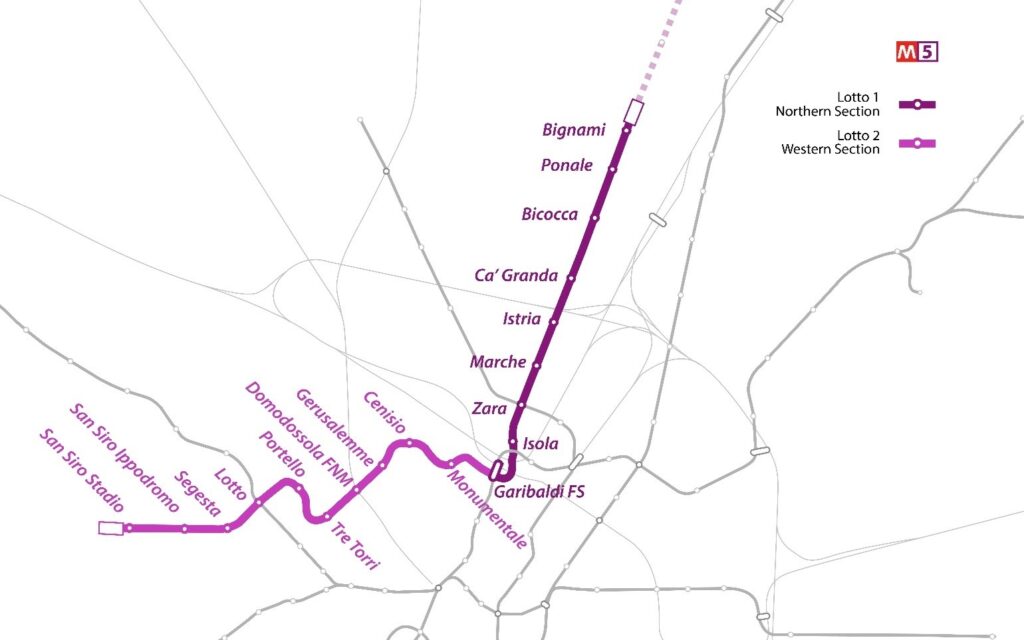
figure 18. The two construction phases of line M5.
Table 3. M5 - Main Characteristics
| Northern section Lotto 1 | Western section Lotto 2 |
||
|---|---|---|---|
| Years | 6 | 5 | |
| Construction start-end | 2007-13 | 2010-15 | |
| Length (km) | 5.6 | 6.7 | |
| Stations | 9 | 10 | |
| Station depth | 10 - 20 m | 17 - 28 m | |
| Cost | €508 | €751 | |
| In million (nominal) and PPP 2020 | $724 | $1,010 | |
| Cost/km In million PPP 2020 per km | $129.3 | $150.9 | |
| Alignment | underground single bore and twin bore tunnel, C&C Ø 9.4 m | underground twin bore tunnel Ø 6.2 m |
|
| Projected maximum capacity | 25,000 pphpd at 75’’ headway | ||
| Vehicles | AnsaldoBreda driverless GoA4 (50.9 m long, 2.65m wide). 1,200 places. | ||
| Platform lengths | 50 m | ||
| Delivery method | PPP – DBFOM (Design- Build-Finance- Operate-Maintain) | ||
| Financing | 56% public (Central Government, Milan’s municipality) 44% private |
||
5.6.4 Costs and design choices
The construction of M5 required an overall capital investment of €1.259 million (€1.373 million, if rolling stock is included), divided between €508 million for the Northern section (Lotto 1, Bignami – Garibaldi) and €751 million for the Eastern section (Lotto 2, Garibaldi – San Siro). In 2020 PPP USD terms that corresponds to $129 million per km for Lotto 1 and $ 151 million per km for Lotto 2. That makes the Northern section (lotto 1) the cheapest metro on a per km basis among our in-depth cases. Hard costs account for approximately € 1,016 million or 90.7% of the overall cost. Systems represent the largest component of hard costs at €317 million, with integral automation, SCADA and telecommunications representing more than half of that. This finding is consistent with other project data and interviews with experts indicating that light-automated metros’ “electronics” have a higher relative cost than “concrete.” As we saw in Turin, light-metro technology allows for smaller tunnels and stations, which reduces the cost of civil works; however, that savings in civil works is partially used to pay for greater systems outlays. Tunnels and shafts represent the second largest expense, at €309 million, while the 19 stations and the two underground storage and light maintenance facilities located at both ends of the line account for €282 million.
Another unique element of Line 5 is that it doesn’t have a full Operations and Maintenance facility yet. As we saw in our Green Line Extension case, these facilities can be large cost drivers depending on their capacity and footprint. For the time being, there are two smaller underground facilities for at both ends of the line. For major repairs, trains are transferred to the M2 maintenance center via a connection between the two lines. A proper M5 O&M facility will be built when the 12.3 km northern extension to the suburban Monza, where land is cheaper, is completed.
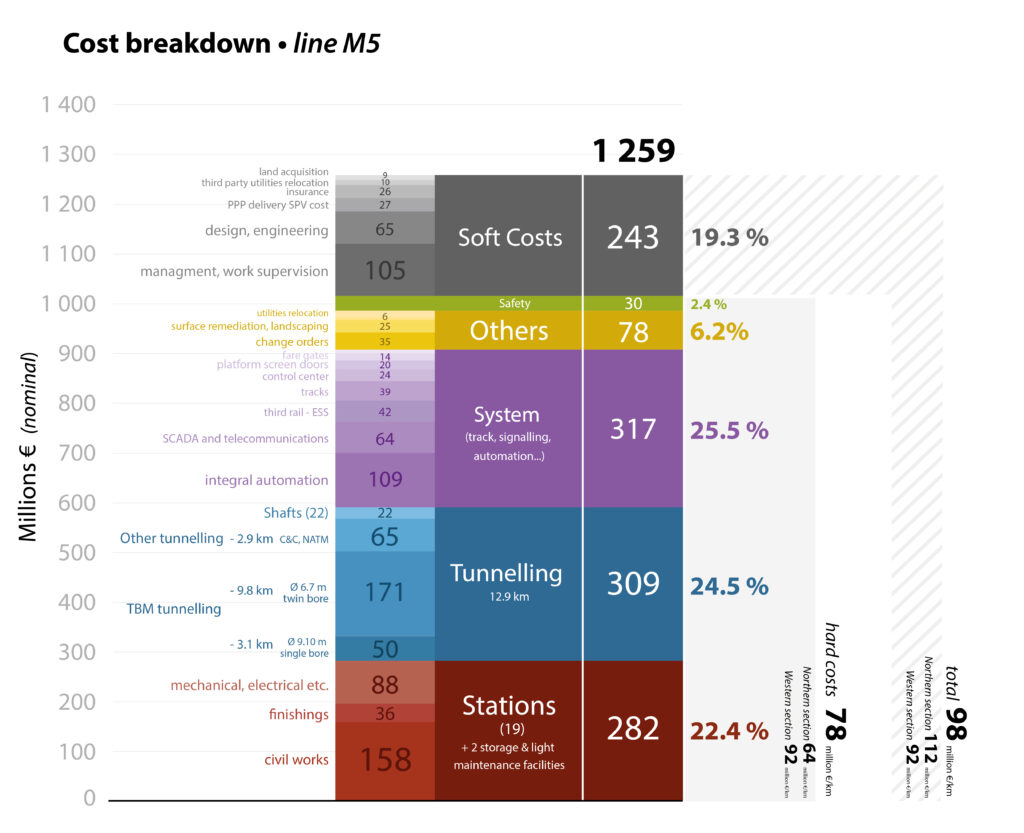
figure 19. Detailed cost breakdown for line M5
Simple and standardized station design. Stations’ construction costs vary between €5.4 and €20.5 million, including civil structures, finishings, mechanical (lifts, escalators), and electrical/ventilation (see figure 20). All of the stations except for Zara[64] were built using the C&C bottom-up technique and are located under streets, public spaces or on land made available by the developer as part of a redevelopment scheme.[65] Tracks are normally 16-17 m below the surface level with a few stations being shallower or deeper, usually because of conflicts with pre-existing or planned underground structures.
Overall, station design is quite simple: a rectangular station box of roughly 60 by 23/26m contains three levels: a subsurface mezzanine hosting faregates, an intermediate level for technical rooms that is inaccessible to the public (absent in shallower stations) and the platform level with either side or island platforms. There are normally two or three entrances from the street level to the mezzanine that are mainly a flight of stairs with a shelter located on the sidewalks or in boulevard medians to provide better connections with tramways. Stations tend to have six escalators: two from the surface to the mezzanine and four from the mezzanine to the platform level (two up and two down) as well as fixed stairs. Each station has four lifts: two from the street level to the mezzanine and two after the faregates to the platforms.
There are two notable exceptions to this base design. First, there are stations that need additional space to accommodate connections to other metro or rail lines, , greater passenger volumes at stations that serve large venues like San Siro Stadium. Second, for lines dug by a TBM, the TBM launch box is repurposed into a station after the tunneling is completed; thus, the dimensions reflect the needs of getting the TBM into the ground rather than ridership projections. Lotto, the most expensive station in the line, is unique because it needed more space for connections, and it had to be constructed much deeper than other M5 stations because the tracks pass under M1 at 28m below the surface. It incurred an extra €3.9 million in civil works and equipment for two additional entrances for the combined M1-M5 station complex.
The average cost of the typical stations differs between the two segments: between €7 and €7.6 million for the Northern section, and €10.2 – €13.3 million for the Western section. This is mainly due to different platform designs along the two sections. On the Northern sections, stations have side platforms and measure 23-meters wide. Western section’s stations have island platforms and are 26-meters wide. Moreover, as an MM planner pointed out in an interview, the Northern section was built to a “low-cost” standard (such as cheaper finishes, and minimal surface remediation) while the ones on the Western section were built to a more expensive standard as more funding became available in advance of Expo 2015 (Personal Interview, February 2021). The same official pointed out that the “right approach” was in-between the two extremes, as the Northern section’s stations are too spartan and the Western’s are slightly overbuilt. Finally, it is worth noting that the average parametric cost is around €300 per cubic meter, with 16 out of 19 stations costing between €235-€325 per cubic meter, a cost that places them below the €460 average of our Italian sample.

figure 20. Detailed breakdown of station costs for Milan’s M5
Tunneling typologies and costs. M5’s tunnel structures, including shafts, cost €23.9 million per km in nominal terms. The costs by segment, however, vary significantly, as M5 used a wide variety of tunneling solutions tailored to the specific conditions (see figure 21). Most of the northern section (Lotto 1), which runs for approximately 3.1 km under Viale Fulvio Testi, a rectilinear 55 m-wide multiway boulevard, was built using a double-track 9.1-m wide tunnel bore with a single Earth Pressure Balance (EPB) TBM. The alignment is on average 16.5-m deep and doesn’t cross any major underground or aboveground structures. This relatively straightforward section of the alignment cost approximately €14.1 million per km.
Most of the western section (lotto 2), between Monumentale and San Siro Stadio, was tunneled using 6.7-m wide EPB TBMs to build twin-bore tunnels. MM decided it would be easier to use twin bores rather than a single bore based on the alignment’s curves, which brought the tunnels underneath several buildings and other underground structures, including a four-track subsurface rail tunnel, M1 metro line and a road tunnel. Moreover, four TBMs were used to dig the two sections simultaneously, east and west of the Tre Torri station, so that it would be ready for the 2015 Expo. All these elements, including a shallower water table on the western side of the city required extensive jet grouting which increased the segment’s costs to around €40 million per km.
Metro line M5 also used NATM/ADECO,[66] a non-fully-mechanized tunneling technique, and cut & cover structures of various depths built with the so-called “Milan method.” On average, the 2,090 meters of single and twin-bore route length built using that technique have an average cost of around €20 million per km. Notably, the complex node between Isola and Garibaldi stations, where the line weaves above and below seven underground structures in less than 500 m, combining various technical solutions, notably ADECO with extensive consolidation and a very short C&C section under an ongoing development.[67], cost roughly €25 million per km.
Finally, the 1.5-km tunnel built using cut & cover cost an average of €49 million per km. When we looked deeper at these numbers, we saw a correlation between the alignment’s depth and costs: The shallow cut & cover section near Isola station, where tracks are between 8- and 12-m belowground, cost approximately €13.1 million per km. As the alignment went deeper, such as in the section of C&C (17-m deep) that also necessitated more complex structures because of the conflicts with the ongoing City Life redevelopment project around Tre Torri station, the tunnel was built at the relatively higher cost of €29 million per km. Finally, the two C&C structures located at both ends of the line provide tail tracks/turnback sidings as well as the storage and light maintenance facilities cost €69 million per km, as they are wider (three and four tracks) and quite deep (between 15 and 18 meters), with excavation volumes comparable to those of stations rather than tunnels.
M5 highlights the relative impact of local conditions, external constraints, and geometry on the cost of tunneling, showing that the choice between the various excavation techniques is to be understood as a balance of trade-offs between cost and risk tied to local context. Nevertheless, it is possible to say that shallow cut & cover and linear single bore under a wide boulevard (similar to Turin’s M1) are the least expensive excavation techniques in our study.
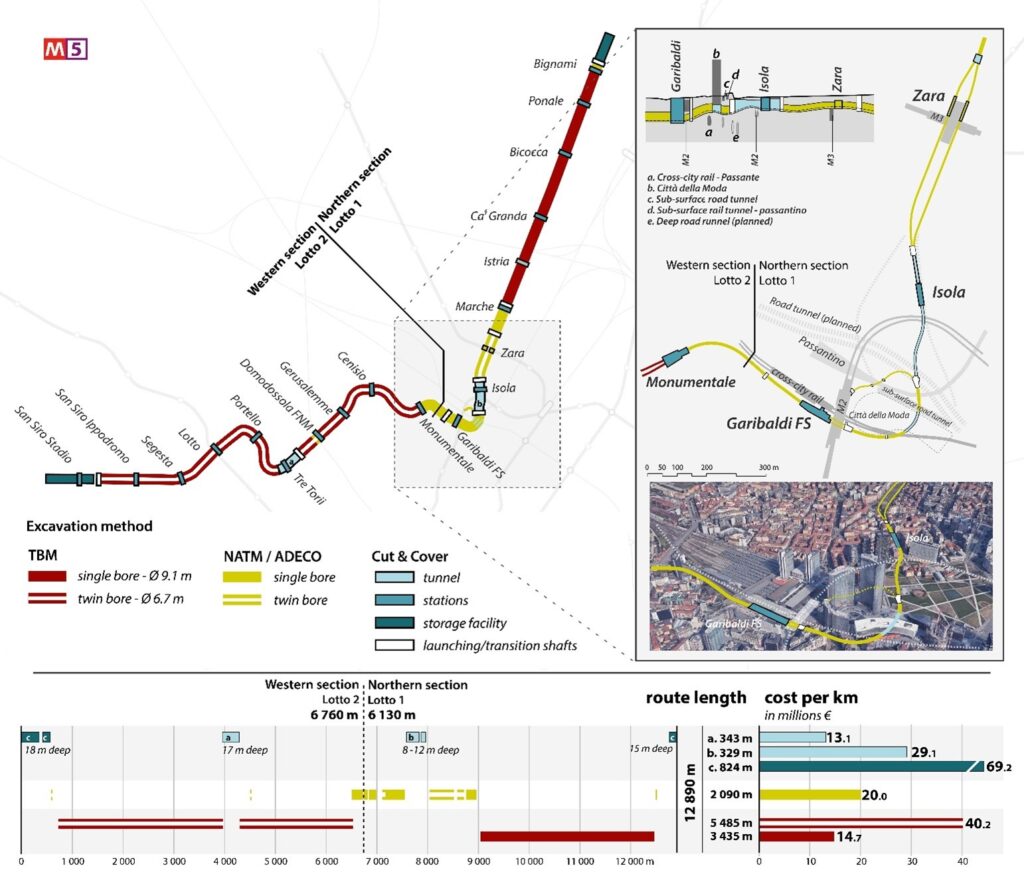
figure 21. Tunnel typology and relative length and cost for both M5 segments.
5.6.5 Public-Private Partnership, but with strong public oversight
Line M5 was delivered via a Public-Private Partnership (PPP). The 2001 infrastructure law that provided most of the funds for M5 had the distinct goal of generating greater involvement of the private sector in the delivery of transport infrastructure. M5 was mostly financed through a mix of public and private funds with 56% of the capital cost covered by the central government (44%) and the city of Milan (12%), while the remaining 44% was financed by the winning private consortium Metro5 Spa.[68] The PPP formula used for M5 most resembles a Design-Build-Finance-Operate-Maintain (DBFOM) contract implemented through the legal mechanism of a concession. The Metro 5 Spa consortium, selected through an open tender, finalized the design, built the civil works and the system’s components, and will operate M5 until December 2040, under a 35-year build-and-operate contract. The city will pay an annual operation and availability fee that covers both the operations and buys down Metro5 Spa’s stake in the line. At the end of the concession period, the city will own all the assets and decide whether to re-tender the operations or transfer them directly to ATM, the municipal transit agency.
Critically, the city retained direct control over the main phases of planning and design and also the direct oversight of construction through Metropolitana Milanese. MM was tasked with preparing the early planning, feasibility study, and preliminary project documents for the whole line, and also with the final design of the second section (Lotto 2). The critical high supervision function (AS – Alta Sorveglianza), which has oversight powers over the direction of works (DL), was also entrusted to MM. The choice of a DBOFM PPP was driven more by the necessity to raise private money to finance construction than because of the will of the city to outsource design and management. As many sources pointed out, the DBFOM PPP formula has been de facto used as a way to bypass the strict borrowing cap imposed on municipalities since austerity measures were adopted in the early 2010s. Despite the atypical DBFOM PPP project delivery, MM retained its traditional management and oversight responsibilities. M5 was delivered without any major cost or schedule incidents in large part because MM’s decades of experience remained central to the project.
5.6.6 Line M4 and M1 extension
We examined Line M4 and the M1 southern extension to Baggio to contextualize the M5 case. M4, the fifth metro line of Milan, is currently in an advanced state of construction and will open in phases between 2022 – 23. It runs on an East-West alignment for 15 km with 21 stations, connecting the city airport Linate to San Cristoforo via the city center. It will connect with M1, M2 and M3 and with suburban rail services at three stations. It is expected to carry 200,000 daily riders when it opens. M4 uses the same light metro technology used in M5, but with slightly wider trainsets to accommodate higher expected ridership. Since construction is ongoing, we don’t have precise final costs, but the latest update of the economic framework made in 2019 quotes the overall project cost at €1.696 million (€1.944 million including the 47 trainsets), or €116 million per km, which, in PPP 2020 terms, is $145 million per km. That makes M4 costs comparable to those of the “twin metro” M5. A more detailed cost breakdown from the 2013 DBFOM contract (€1.572 billion) estimates similar tunneling and station costs for the Western Section (Lotto 2) of M5, which has similar characteristics, such as a twin bore tunnel and C&C stations. It is worth mentioning that M4 has larger diameter tunnels (9.7m) in the city center section to accommodate platforms. The six stations of this section were built with C&C access shafts for vertical circulation and platforms were built within the tunnels to minimize surface level disruptions.
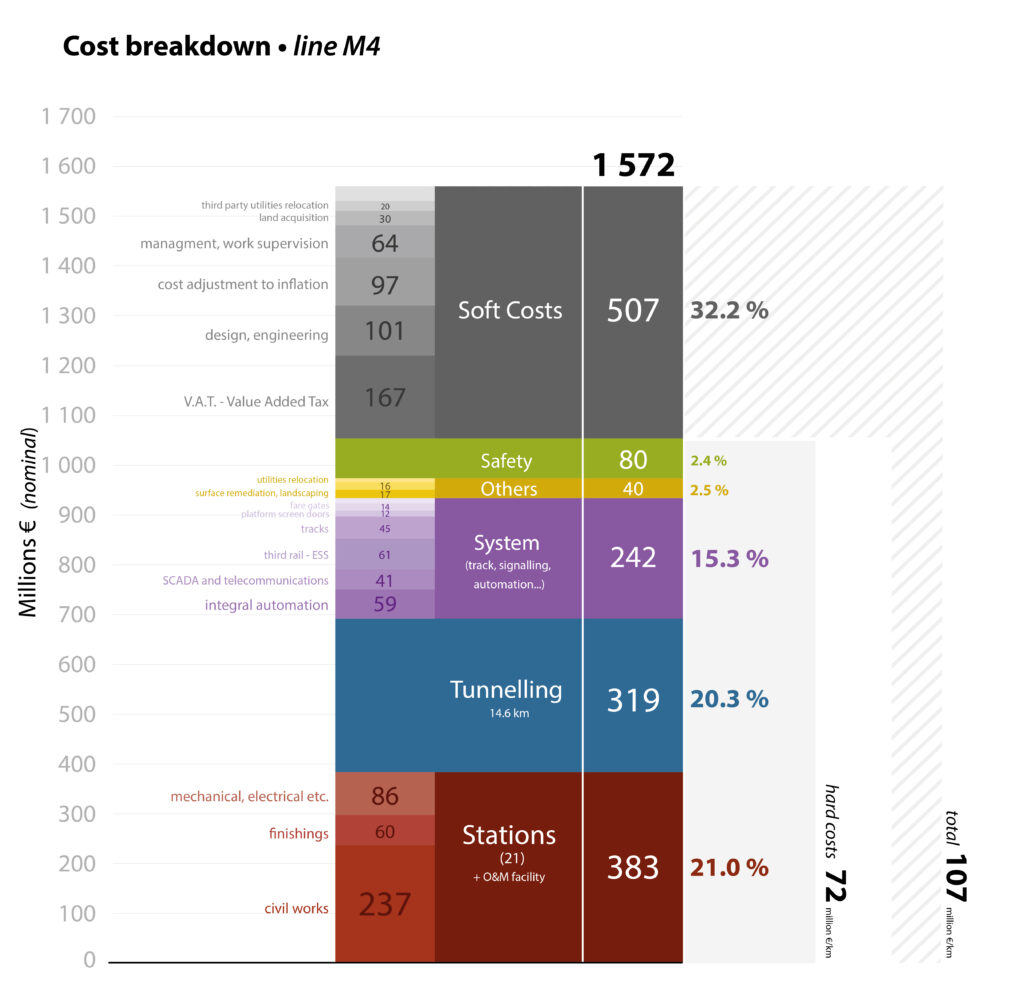
figure 22. Cost breakdown of line M4
The M1 extension to Baggio is currently being procured, and construction is slated to start in 2023. It has a similar cost profile to M4. It is a 3.3 km, 3-station, fully underground extension West of Bisceglie, mostly in a suburban setting with an aboveground Operation and Maintenance facility just outside of the ring motorway. The whole project is estimated to cost €396 million or $156 million per km, slightly higher than M4 and M5. The higher cost is mostly due to the addition of an O&M center (€12 million for civil works, €6 million for tracks, €2 million for the equipment) and for a higher per station cost, at around €27-€28 million each. On a per station basis, that is more than the average cost of M5 stations, but, considering that M1 is a heavy metro with stations that are 120 m long, 25 m wide, and 16 m deep at track level, the average station volume is more than double that of M5. Hence, the parametric cost per cubic meter is between €450-€470, an estimated cost similar to M5 stations in the “wetter” part of the city requiring bottom jet grouting. Tunneling costs also resemble those from other single-bore projects: €88 million or €27.1 million per km, including ventilation shafts, TBM launching and extraction shafts and a short C&C section for the O&M access ramp. When we break these tunneling costs down into smaller line items, we see that the TBM tunneling is projected to cost €52 million for 2.9 km, or €17.9 million per km, which compares well with other projects, like M5’s single bore and similar projects in Milan and Turin.
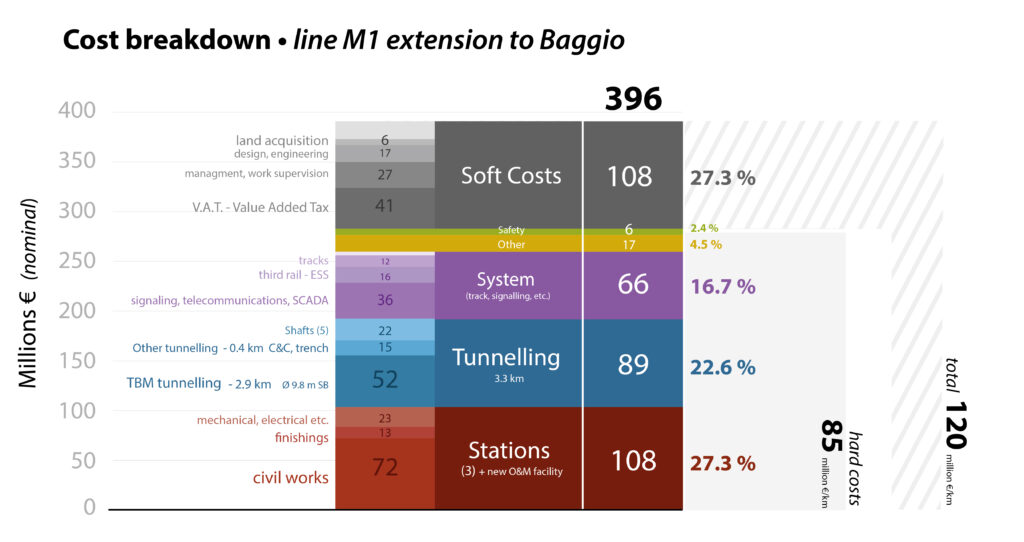
figure 23. Cost breakdown of line M1 extension to Baggio
What is more interesting is M4’s DBFOM contract, for which we have more detail compared to M5’s. Even if the economic and financial plan (PEF – Piano Economico e Finanziario) detailing the long-term cashflow and lifecycle costs for the municipality is not publicly available, the concession contract[69] highlights some of the long-term costs and how risk transfer has been balanced. The concession has a duration of 370 months, 88 months for construction and 282 months for operations and maintenance. As the contract cannot be extended, a delay in the construction would result in a shorter O&M duration, which will eat into potential revenues for the concessionaire. The construction risk (or availability risk) is essentially the only form of risk that has been transferred to the private partners through the DBFOM, as the contract guarantees a minimum yearly fee of around €94 million from the second year of operation (indexed to inflation), corresponding to a per trip fee of €1.094 applied to a minimum yearly “guaranteed” ridership of 86 million trips per year, enough to guarantee a return on investment to the private partners. If annual ridership exceeds 86 million, the concessionaire will receive €0.45 per additional trip. The additional fee is capped at a maximum that corresponds to 2% of the annual growth of the contractual Internal Return Rate of 5.93 %.[70] Even if all of the financial details aren’t public, the Internal Rate of Return (IRR) is higher than the typical borrowing rate for municipal and national bonds, suggesting that long-term costs for the city are higher than a fully publicly funded option. In fact, it is generally recognized that the two DBFOM schemes used for M5 and M4 have been a way for the city to circumvent the cap imposed on municipal borrowing by the National Government. Thanks to the central government’s renewed commitment to public-transit projects, Milan has shied away from PPPs and reverted to the more traditional Design-Bid-Build approach through Joint Procurement (appalto integrato) for newer projects, such as M1 and M5 extensions.
Unlike M5, the Municipality maintained greater control over the concessionaire by creating a Special Purpose Vehicle (SPV) company. The private consortium selected via a DBFOM tender joined the SPV “Metro 4 Spa” whose main shareholder is the city (2/3 of the shares), with the private partners owning the remaining balance of shares (see figure 24). As for M5, the city also retains a direct control over the design process, with MM having done the preliminary design and being responsible for the work supervision (DL). Also, ATM, the city’s transit operator, will be responsible for operations, as it was part of the winning consortium. ANAC criticized this arrangement as highly unusual, but the city argued that by including these known entities, the city would have greater control over the delivery process.
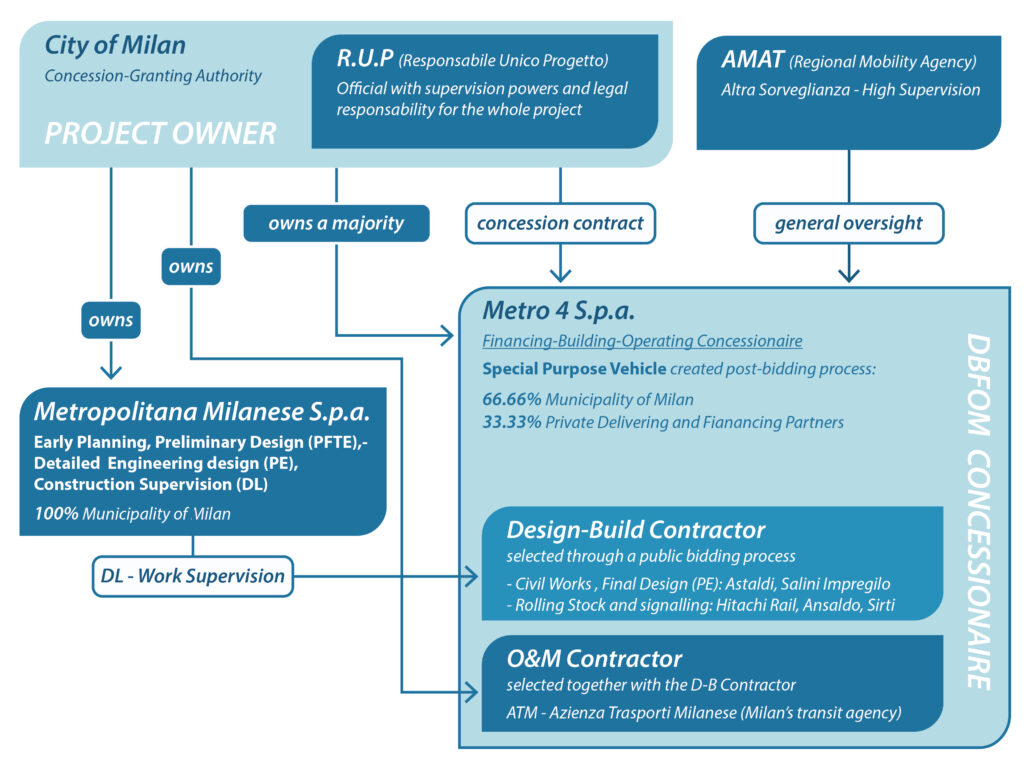
figure 24. Line M4’s DBFOM structure.
5.6.7 Longstanding in-house expertise, pragmatic approach, standardized design
Milan’s longstanding history of building cost-effective metro projects is the result of its longstanding in-house rail-transit construction expertise. As we saw in Turin’s case, the analysis of station costs and design suggests that a greater standardization of station layouts and construction processes is central to disciplining costs. As we have seen in Boston, New York, and, later, Naples, projects tend to lose budget discipline when station designs are bespoke and more concerned with community placemaking versus functional design.
Moreover, the decision to build a complete line in two larger phases, such as for M5, or even in a single phase as was done for M4, seems to be a factor contributing to savings compared to other projects, by allowing for a better location of land intensive facilities, such as O&M centers, at the margins of the built-up area and other savings through economies of scale in tunneling and a more rational distribution along the line of facilities such as crossover boxes and staging sites for the TBM.
The supervision and longstanding design capacity provided by the in-house engineering firm Metropolitana Milanese emerges as a key element to control costs, produce high quality projects and avoid scope creep through the planning, design and procurement processes even in the case of projects delivered through DBFOM schemes, where part of the design and management was outsourced to the private sector. In Milan’s case, the premium normally observed in DBFOM delivery schemes doesn’t seem to have a direct impact on capital construction costs, but more on the long-term cost the city will sustain to pay back the private capital investment, even though this claim would require a deeper study of the economic arrangements. The DBFOM model seems to have been retained solely as a way to bypass austerity limits on borrowing more than a way to transfer risk as it is often framed in the literature or as a way to outsource part of the contracting authority’s responsibilities in terms of design decisions, oversight of the procurement and construction, that the city of Milan has kept through the involvement of MM in key roles throughout the process. The lesson of Metropolitana Milanese, with its hybrid private-public statute, provides an interesting blueprint for a third-way of building and retaining in-house engineering capacity for cities that are engaged in long-term expansion programs of their rail transit network.
5.7 Rome: Lines C and B1
5.7.1 Introduction
The city of Rome (2.78 million inhabitants in the city proper, 4.05 in the metro area) is served by a three-line metro network spanning 59.4 km with 73 stations and serving 985,000 unliked trips on an average weekday[71]. The urban rail network of the city is rather undeveloped and relatively recent compared to European peers. The development of the system has been slow and plagued by delays, scandals and downscaled ambitions. In 1962, Rome developed a transportation masterplan outlining a four-line metro network that is complemented by trams and suburban rail, but the construction of the third metro line, MC, only started in 2007, with the goal of adding 25 km of new heavy rail to the city within a decade. In this case, we will analyze MC and MB1. MC is Rome’s most recent metro line project, and it is partially under construction. MB1 is a branch of metro line B built at the same time of MC and will mostly serve as a reference to measure the cost implications of technical characteristics, construction techniques, alignment, project management and delivery method.
Line MC is an illustrative case about the drivers of construction costs because it features multiple alignments as it crosses diverse urban contexts – spanning from the external eastern suburbs to the core of the old city – and presents a relevant difference in construction costs between the different sections. Line MC is being built using a delivery method labelled as “general contractor” (Contraente Generale), introduced by the 2002 reform of public procurement, that can be qualified as a form of Design-(Manage)-Build with limited public supervision. Yet, there have been relevant differences in the way the project has been contracted out for each section, as a result of intricate early planning, design and approval process. Moreover, the MC case highlights very clearly the impact of archeology and monument protection on design requirements, and, more importantly, how unanticipated archeological findings increase costs, especially when combined with political fickleness within the municipal government. Both MC and MB1 cases illustrate that the choice to break down a larger metro project into smaller, more financially palatable sections, resulted in higher overall costs at the end.
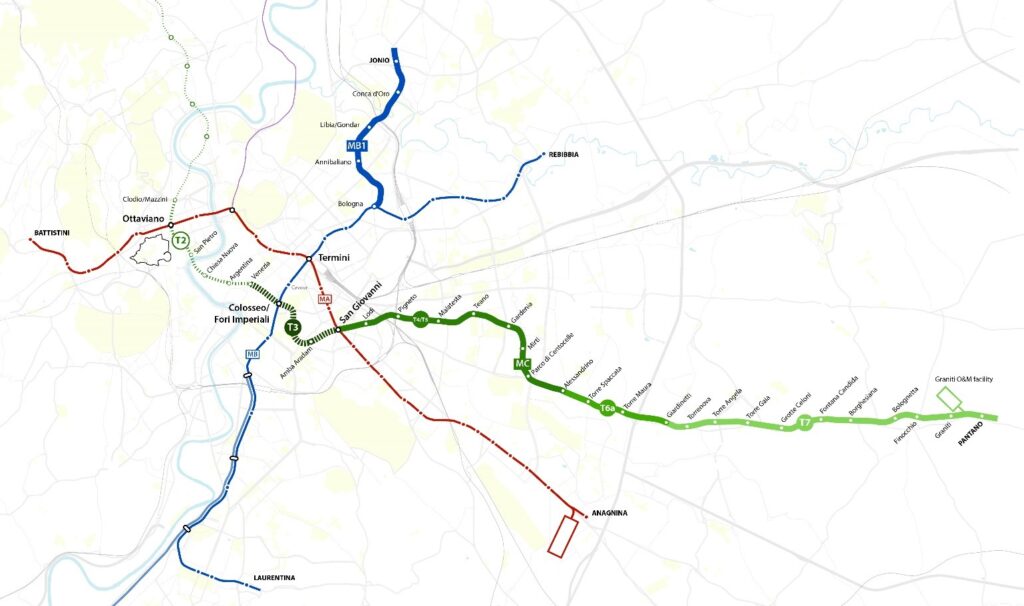
figure 25. Rome’s metro network as of 2021. Lines MC (green) and MB1 (blue) are highlighted.
5.7.2 Context: historic costs of metro construction in Rome
Rome began construction of its first metro line relatively late compared to other European capital cities. Work on an electric suburban rail featuring urban metro characteristics started in the mid 1930s on a line connecting Termini station to the E.U.R. ’42 exposition site. As works were suspended during the war, the line, now part of metro MB, was finally inaugurated in 1955, thus becoming the first proper subway section opened in Italy. Rome’s network developed slowly in the following years. Even though Metroroma spa, a public special purpose delivery company was established in 1955 to develop a multi-line network, construction on the second, fully urban line, MA, started only in 1964, following the alignment outlined in the 1962 masterplan that envisioned a three-line radial network (lines A, B1/B2, and C) and a fourth circumferential elevated line (D) in the median of an urban expressway.
MA was planned as a mostly cut & cover Milan method project, but as construction started on the outer sections, surface-level disruptions were deemed too onerous and construction was halted while the project underwent a redesign that called for a deeper bored alignment with fewer street-level challenges in the early 1970s.[72] After many delays and cost increases, Rome’s first fully urban metro line opened in 1980.
Since Rome’s metro projects were financed by special laws and appropriations approved by parliament, it is possible to reconstruct all of its historic construction costs since the original Termini-EUR section (see figure 26). MA Eastern extension and MB Northern extension are among the costliest metro lines ever built in Italy, despite being built in dense postwar expansion areas and not in the archeologically and historic sensitive urban core. Also, Rome’s costs vary more than Milan’s, with several projects being significantly higher than the €200 million per km ($265 million per km) observed in Milan as the upper limit of all but one project.
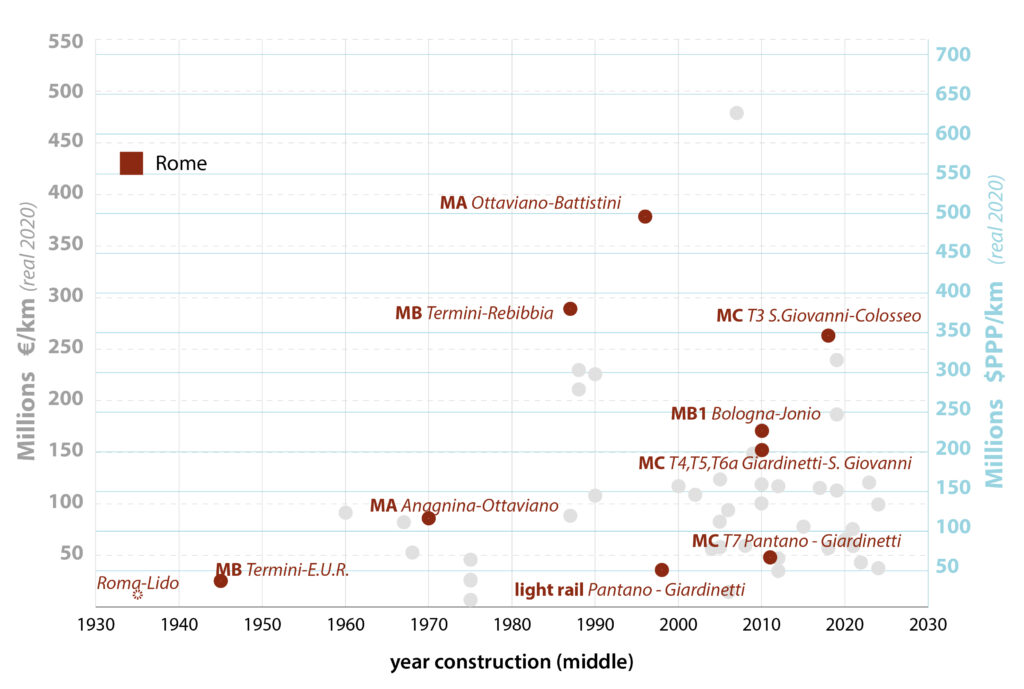
figure 26. Actualized construction costs of all metro sections built in Rome since the 1930s, in euros (left scale) and dollar PPP (right scale).
5.7.3 Line C: project overview
Line C is the newcomer among Rome’s metro lines. Construction started in 2007 after several years of planning. The core section of the line crosses the city from East to West, from the far eastern suburbs situated outside of the GRA ring motorway along via Casilina to the central neighborhood of Prati, connecting twice with MA at San Giovanni and Ottaviano and with MB at Colosseo/Fori Imperiali. Once completed, the core section of MC will span 25.5 km with 30 stations and provide direct metro service to the job-rich city core and several touristic sites: the Capitolium, the Ansa Barocca (the oldest part of the medieval and Baroque core of Rome adjacent to the Tiber meander, home to the Pantheon and Piazza Navona), Sant’Angelo Castle and Saint Peter, serving 300-350,000 daily users and relieving the overcrowded MA.
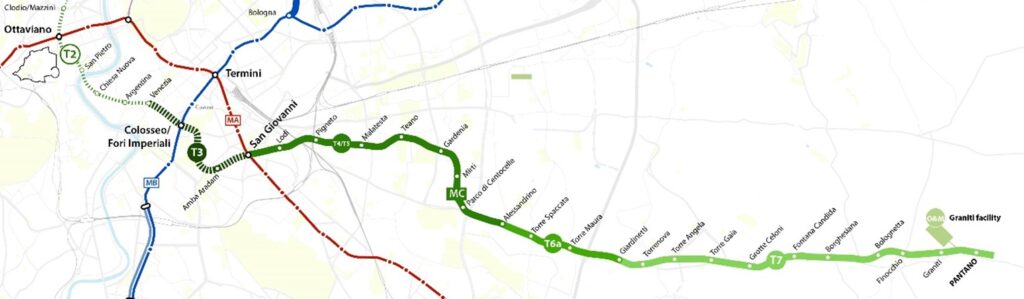
figure 27. The alignment of MC with its different construction sections. Solid line (O&M and T7, T6a, T5/T4) is operational; dashed (T3) is under construction; dashed thin (T2) is under project review.
Table 4. MC - Main Characteristics
| Sections | T7 | T6a | T4-T5 | T3 | T2 |
|---|---|---|---|---|---|
| Years | 2008-14 | 2008-14 | 2007-15 | 2011-2023 | - |
| Construction start-end | 2018* ( S. Giovanni) | ||||
| Length (km) | 8.2 | 2.8 | 7.3 | 2.8 | 4 |
| Stations | 10 | 4 | 9 | 2 | - |
| Station depth | - | 20 m | 17-30 m | 30-32m | - |
| Cost Nominal In million | €6371 | €399 | €1,090 | €735 | - |
| And in PPP | $892 | $519 | $1,417 | $955 | |
| Cost/km In million PPP/km | $108.7 | $185.3 | $194.1 | $341.2 | $400-500 (preliminary estimates) |
| Alignment | at grade elevated open trench | underground twin bore tunnel Ø 6.7m | underground twin bore tunnel Ø 6.7m | underground twin bore tunnel Ø 6.7m | underground twin bore tunnel Ø 6.7m |
| Projected maximum capacity: | 40,000 pphpd | ||||
| Vehicles | AnsaldoBreda (Hitachi Rail Italy) driverless GoA4 (109.4m long, 2.85m wide). | ||||
| Platform lengths | 110m | ||||
| Delivery method | General Contractor (Contraente Generale), i.e. Design-(Manage)-Build. | ||||
| Financing | 100% public T2-T3-T6a: 70% Central Government, 18% Municipality, 12% Region T4-T5 : 70% Central Government, 30% Municipality |
||||
| Notes | |||||
| 1. This section was reconverted from the outer section of the Roma-Giardinetti-Pantano light rail line, a 1916 meter-gauge interurban that was upgraded to almost metro standard (full grade separation, longer stations) during the late 1990s-early 2000s. This first upgrade cost 350 bn liras, that is €274 million in 2020 prices. The further adaptation and integration into MC (regauging, full station refurbishment, rigid overhead catenary, platform screen doors, noise barriers, etc.) cost €363m (not including the expansion of the depot and maintenance centre). | |||||
Plans for MC have been on the books, albeit with different alignments for some sections, since the 1964 masterplan. Provisions for a connection with MA were built during the construction of San Giovanni station in the early 1970s. Despite the promise of MC, its realization was scuttled by corruption scandals in the 1980s (see section 2.2). MC was postponed several times before an initial segment, corresponding to sections T4-T5, was approved and partially funded in the mid-1990s. In the following years, the scope of the project was expanded, notably with a new, more central alignment through the city’s core and the incorporation of the outer part of the Termini-Giardinetti-Pantano interurban tramway, which was in the process of being upgraded to full-grade separation with metro standards during the second half of the 1990s. The project received a final approval by the CIPESS inter-ministerial committee in 2003 with enough funding to begin sections T7, T6a, T4/T5. The project was to be delivered through a form of D-B scheme known as General Contractor, with the goal of increasing the participation of the private sector in the delivery of public infrastructure and seeking forms of risk transfer.
Since section T4-T5 was initially intended to be delivered with a more traditional Design-Bid-Build formula, the public bidding process for the designation of the D-B General Contractor was based on a more refined level of design for those sections (corresponding to a PD or Final Design), but only on a very Preliminary Design for the remaining sections (T7, T6a, T3, T2), including the very delicate and riskier sections through the historical, archeologically rich core of the city. Notably, the preliminary design envisioned an untested construction technique for sections T3-T2 poised to minimize disruption to the archeological layers that in some areas could be as deep as 20 m.[73] This design, hence dubbed the “Rome method” and later used for the central section of M4 in Milan, consists of enlarged twin TBM bored tunnels (up to 10 m diameter) that includes both the track and the platform, while inclined tunnels containing stairs and escalators mined from small shallow shafts provide access to the surface (see figure 28), with an additional vertical shaft for elevators, ventilation and emergency exists. The exact locations of the shafts were to be determined after a preliminary, non-invasive archeological investigation via test borings that were taken in potential locations to identify the areas having minimal risk of encountering major archeological remains.
This technique of identifying archeologically sensitive sites had several shortcomings. The very first test borings in the mid 2000s highlighted the presence of an archeological stratum richer and deeper than expected. Hence, the construction of the mined inclined access shafts was a great risk to the archeological layer because of the destructive excavation techniques involving jet grouting. The various Superintendencies expressed several reservations about the plan, issued a negative assessment of the plan described in the preliminary project documents, and asked for the archeological plan to be amended in the final design.
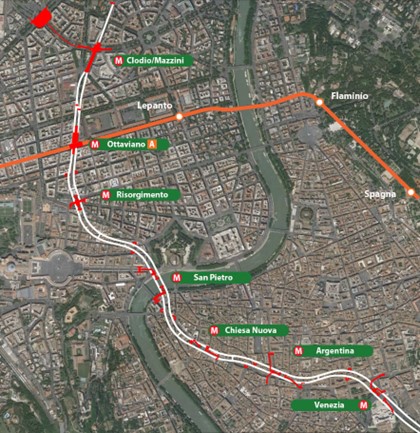
figure 28. The initial plan for the T2 section of MC. In white, the twin bored large diameter tunnels. In red, the station access built with inclined mined tunnels and shafts. Courtesy of Metro X Roma.
The overarching challenge which MC encountered stems from the decision to speed up the procurement phase in 2004-06, in part, to satisfy political pressure over funding allocations and upcoming National and Municipal elections in 2006 while ignoring the Superintendencies’ concerns about the risky construction method for the central sections of the project. By flouting these concerns, the project incurred severe cost overruns and the project was almost brought to a complete halt between 2008-10, when the central government intervened and nominated a “Czar” (Commissario Straordinario) to resolve the archeological conundrum that stymied the project.
Because of these challenges and delays, costs have increased and the T3 segment has advanced slowly and been partially descoped, namely the construction of Piazza Venezia station was put on hold and de-funded while it was redesigned. The segment T2 through the Ansa Barocca, probably the most challenging but most important part of the whole project, frozen in 2008, despite several attempts by the General Contractor Metro C spa to advance that section, either by containing costs and avoiding technical challenges through extensive descoping (in a 2011 project revision, Metro C Spa proposed scrapping most stations in the central section) or by proposing a PPP scheme. Both options were ultimately rejected by the municipality. The continuation of the project beyond Piazza Venezia or even the completion of the section to Fori Imperiali has been jeopardized by growing public skepticism and the initial political opposition of the city government’s Five Star Movement majority, which was elected in 2016. More recently, the project appears to be back on track thanks to local support from grassroots advocates who have advocated for MC through the participatory process mandated by the PUMS mobility plan. Furthermore, the central government’s renewed commitment to the project has put it on a more secure financial footing. Section T2 has been completely redesigned to incorporate lessons learned from T3 construction and the superintendencies’ recommendations about archeologically sensitive construction. Its cost is now estimated at around €1.5 – €2 bn.
Table 5. MC - Project’s Timeline summary
| Early 1990s | First project rejected after a negative E.I.S. (V.I.A.) evaluation. Partial financing of €532 million ex lege 211/92 for sections T4 and T5. |
| 2000-2003 | Preliminary project approval by CIPE (Inter-ministerial Committee for Infrastructure). T7 trough T4 sections are financed under the “legge obiettivo” framework. |
| 2004-2006 | Public Bidding Process for the designation of the General Contractor won by Metro C Spa, a consortium of Astaldi Spa (head), Vianini Lavori Spa, Consorzio Cooperative Costruzioni, Ansaldo Trasporti Sistemi Ferroviari Spa. |
| 2006 | Preliminary works (first level archaeology diggings, utility relocation) |
| 2007 | Construction starts on sections T4-T5 |
| 2008 | Construction starts on sections T6a-T7 |
| 2009 | First major cost increase for the sections T6A-T7- O&M Graniti – €189.6 million |
| 2010 | Section T3 approved and financed with some major modifications to the San Giovanni station. |
| 2011 | Proposal from the Metro C Spa contactor to build the T2 section as a PPP concession instead of CG. Proposal is refused and considered inadequate (reduced number of stations in the central section, not economically sound). |
| 2011 | Construction starts on section T3 |
| 2012-2013 | Ongoing litigation between the contractor and Roma Metropolitane about cost increases and delayed payments. Works are halted several times for short periods. |
| 2014 | Opening of the Pantano- Parco di Centocelle section (T6A-T7) |
| 2015 | Opening of the Parco di Centocelle – Lodi section (T4-T5) |
| 2018 | Opening of San Giovanni station (T3) |
| 2018 | Beginning of a major project revision of the central section (T2). |
| Notes For more details about the project’s timeline, see: http://silos.infrastrutturestrategiche.it/admin/scheda.aspx?id=1312; and also: http://www.romametropolitane.it/articolo.asp?CodMenu=18&CodArt=22#m2 |
|
5.7.4 Detailed overview of MC and MB construction costs in detail
The overview of MC’s detailed construction costs[74] and the comparison with MB1, especially for stations and tunnelling, highlights a remarkable difference in costs between two sections in particular: T4-T5 and T3. Despite both sections being fully underground and using similar construction techniques (twin-bore tunnels and cut-and-cover stations), the construction costs per kilometer of T3 is more than 75 % greater than T4-T5. Design and engineering factors, a more complex urban environment, heritage and archeology, schedule uncertainties, bad luck and poorly evaluated risks have all contributed to much higher costs for T3.
T4-T5. Alessandrino – San Giovanni
This twin-bore-fully-underground segment stretches 7.3 km and includes 9 stations from Alessandrino to San Giovanni, where the line connects with the existing metro line MA. This section opened in 2015, after 8 years of construction, but San Giovanni station opening was delayed until 2018, due to the archeological findings during the early excavations and the subsequent redesign of the whole node, a major change that had a significant impact on the cost, as it will be further illustrated in greater detail. This section of the line crosses through a mix of dense inner-city neighborhoods developed in a period spanning the interwar years—including pockets of unplanned ‘spontaneous’ developments like the Pigneto—and high-density expansion areas of 8-10 story apartment blocks developed during the postwar decades during the economic boom, such as Torpignattara and Centocelle. As is common in Italy, the stations are located under public squares, streets or in open areas involving minimal land acquisition. The station boxes were built using cut and cover, with platform depths varying between 17 and 30 meters, with a few having part of the platforms built through enlarged tunnels whenever the space for a full cut and cover box was unavailable.
The final cost of T4-T5 is €1.206 billion ($1.417 billion PPP) or €159 million ($206 million PPP) per km. Hard costs account for €104 million/km ($135 million/km), 65.6% of the total, while soft costs account for the remaining third, a rate far higher than the average 20-25% found in other projects in Italy. That is partially an accounting artefact, as the €124 million in extra costs claimed by the General Contractor (GC) and agreed upon in 2011-12 have been add to the soft cost assumed by the contracting agency.[75] Interestingly, GC’s soft costs, which should cover project management and design and risk assumption, accounts for 9.5% of the final capital cost. The nine stations account for the largest share of the construction cost, at €380 million (31% of total costs and 48% of hard costs), but San Giovanni alone accounts for almost a third of the total, at €110 million (see figure 29). Excluding San Giovanni, whose costs increased dramatically, the per kilometer construction cost (hard costs only) of T4-T5 is about €90 million ($117 million/km).
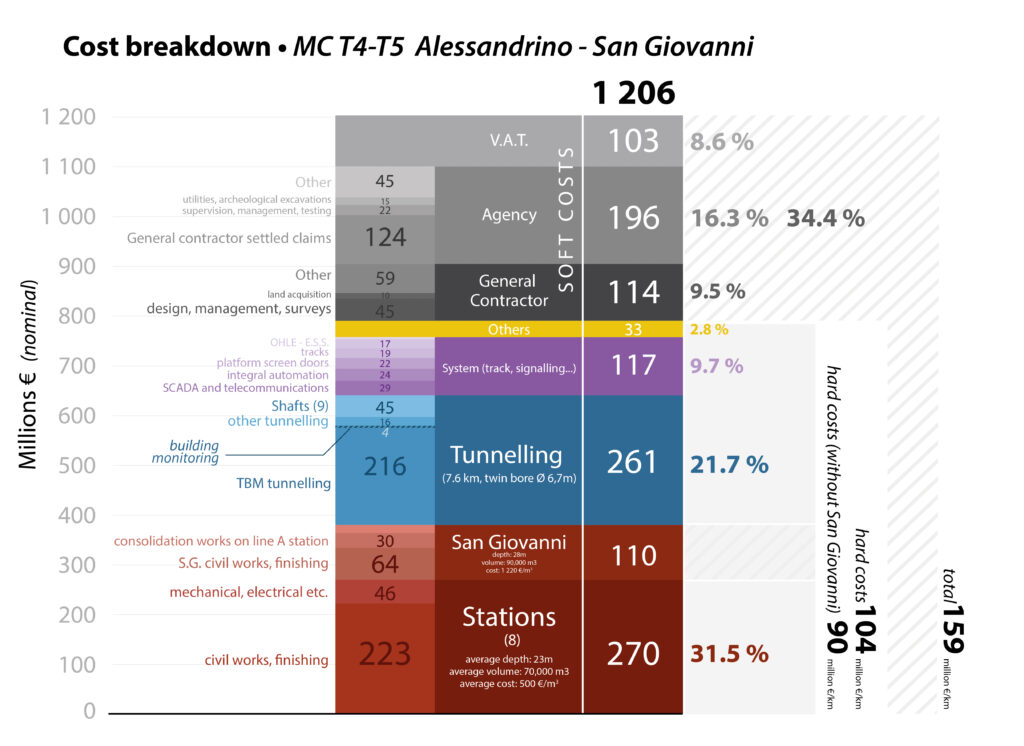
figure 29. Detailed cost breakdown of MC’s T4-T5 section.
T3. (San Giovanni) – Fori Imperiali – (Venezia)
The T3 section is the first segment of MC built within the perimeter of the city center defined by the Aurelian Walls. It encompasses 2.65 km of twin-bore tunnels from San Giovanni station (excluded) to Piazza Venezia station (excluded), and two intermediate stations: Amba Aradam, near the Aurelian walls, and Fori Imperiali, where there is a connection to MB station near the Colosseum. The line passes under or near several important heritage sites, including the Aurelian Walls (3rd century CE), the church of Santo Stefano Rotondo al Celio (5th century CE), the Colosseum (1st century CE), and the monumental complex of the Imperial Fora, notably the Basilica of Maxentius (4th century CE). Works started in 2011 but have been delayed because of archeological findings that emerged during the excavation of Amba Aradam metro station. These findings triggered a legal battle between the general contractor and Roma Metropolitane, which has created uncertainty about whether the line should continue past Fori Imperiali. T3 is now expected to open in 2024.
Section T3 experienced a 70% cost increase, growing from €510 million in the initial bidding to a total of €862 million as of 2020. That corresponds to €325 million per km ($422 m/km), more than double the previous sections (T4-T5). Two factors have contributed to this far higher cost: the cost per station, which is far higher than the average station costs for T4-T5, and tunnel-related costs. In particular, even though the TBM tunnelling cost per km is only slightly higher than in other comparable projects, it represents only less than half of the total tunneling-related cost (€124 m of €278 m). The remaining €154 is for the two main shafts at via Sannio and Piazza Celimontana, that double as crossovers and account for €64 million, and the short 150-m long sections of micro-tunnelling under the existing MA San Giovanni station quoted at an astounding €62 million (that is €200 m/km). The cost variation for stations and tunnelling between the different sections and their reasons will be discussed in greater detail in the following section.
Finally, it is worth noting that detailed costs provided by Roma Metropolitane estimate that €77 million or 12.2% of the hard cost were expended on archeological and heritage preservation.[76] Monitoring activities on building stability alone account for €42 million, while €35 million was spent on preventive restoration, temporary support and structural consolidation of several fragile heritage structures potentially affected by tunnel or station excavation. Finally, there are even more additional costs that are the indirect result of constraints imposed on construction as part of archeological and heritage preservation measures, such as deeper tunnels and stations that were selected to reduce the risk of even a minimal damage to listed structures.
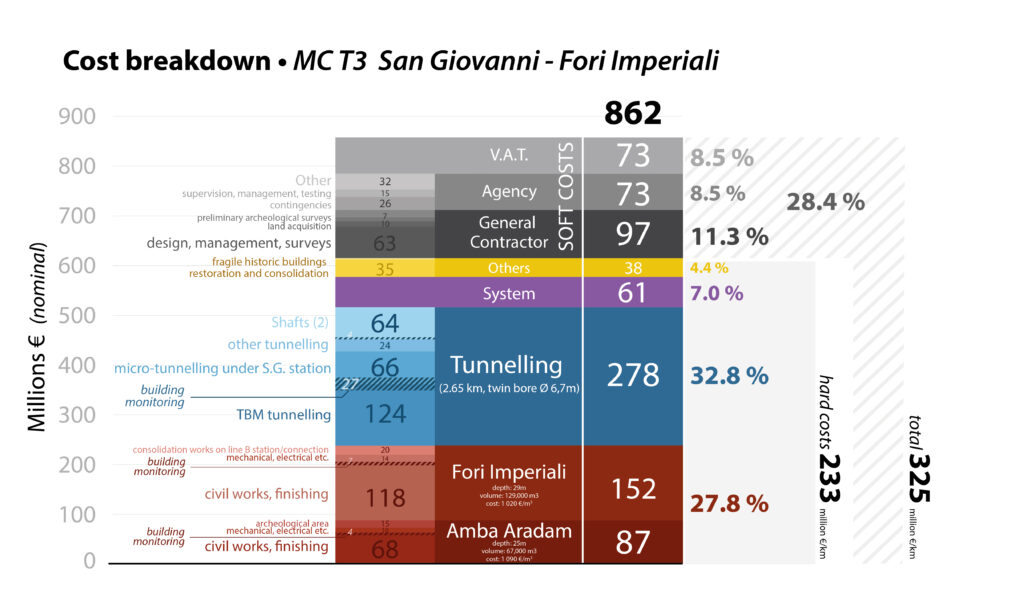
figure 30. Cost breakdown of T3 section of metro line MC. Own elaboration using data from Roma Metropolitane.
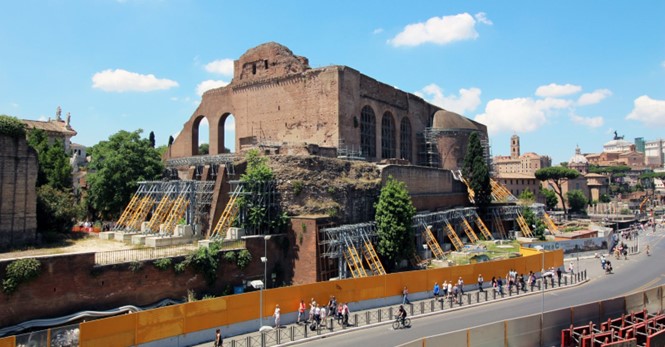
figure 31. The temporary structural support for the Basilica of Massentium, an example of the structural reinforcement and temporary provisions that had to be put in place to secure monuments during construction. Source: Metro C spa.
MB1
Line MB1 cost €761 million ($1.101 billion in PPP 2020 terms), or $231 million per km. The line was built in two separate packages, which differ significantly on a cost per km basis. The section from Bologna to Conca d’Oro, which includes 3.7 km of twin-bore tunnels and three stations, cost €534 million, or $209 million per km in actualized terms, while the final short section to Ionio, which includes 1.05 km of single-bore tunnel and Ionio station, was €226 million, or $312 million per km. As we will see in detail later, the difference is mostly the result of greater tunneling costs due to higher fixed costs, such as the launch box.
MB1’s stations, both in terms of costs and dimensions, differ from the previously mentioned MC sections. This can in partly explained by the technical characteristics of MB1, which has longer platforms (150 m compared to MC’s 110 m platforms) and requires bigger stations, which means that MB1’s station are more expensive on a relative basis than MC’s. Another unique element of MB1 is that three out of four stations include multi-story underground public parking structures that cost €23 million. Finally, the stations’ depth and the high-water table, as the line crosses through the valley of the river Aniene, all add additional costs.
MB1’s soft costs represent 31.9 % of the project’s total; however, this is due to the fact that €98 million in compensable claims and an on-time delivery bonus were included in the soft costs. Moreover, most of these additional costs are the result of stricter spoil disposal regulations that were adopted during construction. The remainder of soft costs, excluding the V.A.T., includes professional costs related to project management and design (€32 million), ancillary projects excluded from the main contract, payouts for utility relocations directly executed by utility companies and land acquisition totalling €82 million or 10.7 % of the total.
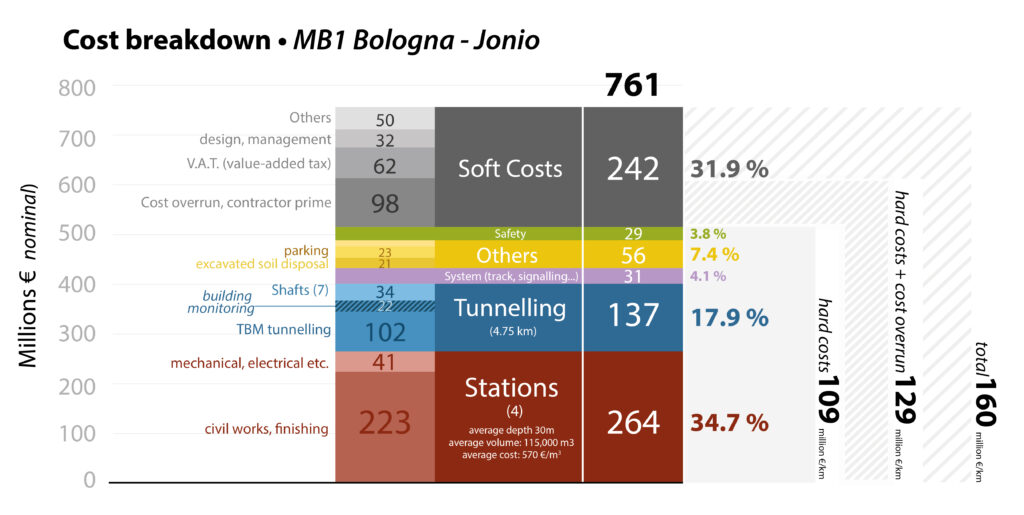
figure 32. Cost breakdown of MB1 extension.
5.7.5 Significant variations in station and tunnelling costs
By studying MC and MB1 side by side, we quickly see what drives construction costs. In urban rail, civil engineering structures such as tunnels, shafts and stations are by far the leading source of cost, accounting for as much as 80-90 % of hard costs.
Stations
Station costs are mainly comprised of two main categories: civil works and electrical/mechanical. The former includes the works needed to realize the structural components of a station box (excavation, perimeter walls, slabs, beams and columns, waterproofing, etc.), and finishings. The latter is made up of the cost to install electrical and mechanical equipment, such as lighting, fire prevention, ventilation, lifts and escalators, but not system-related costs, like platform-screen doors, passenger information system, SCADA, etc. that are normally accounted for as part of the systems. More complex stations can involve related works on existing or ancillary structures, and extensive reconstruction of the public realm above and around the stations.
figure 33 provides a comparative analysis of station costs on sections T4-T5 and T3 of MC and MB1, highlighting some interesting patterns. Most stations on the outer section of MC (T4-T5) cost between €22 and €46 million, with an average station cost of €34 million. The cost soars to more than €100 million on average for the three stations in the central section (San Giovanni, Amba Aradam and Fori Imperiali). At €58-78 million, the four stations on the MB1 metro extension are more expensive than MC’s similarly located stations in dense interwar and postwar neighborhoods. The key difference, however, is that MB1 stations are deeper and have longer 150-m platforms versus MC’s 110-m platforms. To account for these differences, we developed a parametric cost in €/m3. Even though this parametric cost is simplified,[77]</a it is worth noting that most MB1 extension stations and MC T4-T5, excluding San Giovanni, have a €/m3 between €410 and €670, while the city center stations, characterized by a robust archeological and urban historical environment, have parametric costs well above 1,000 €/m3. A more detailed analysis of San Giovanni and Fori Imperiali, the costliest stations so far, reveals that a combination of factors drives cost upward, mainly as a result of costlier design choices selected to preserve Rome’s rich archeology.
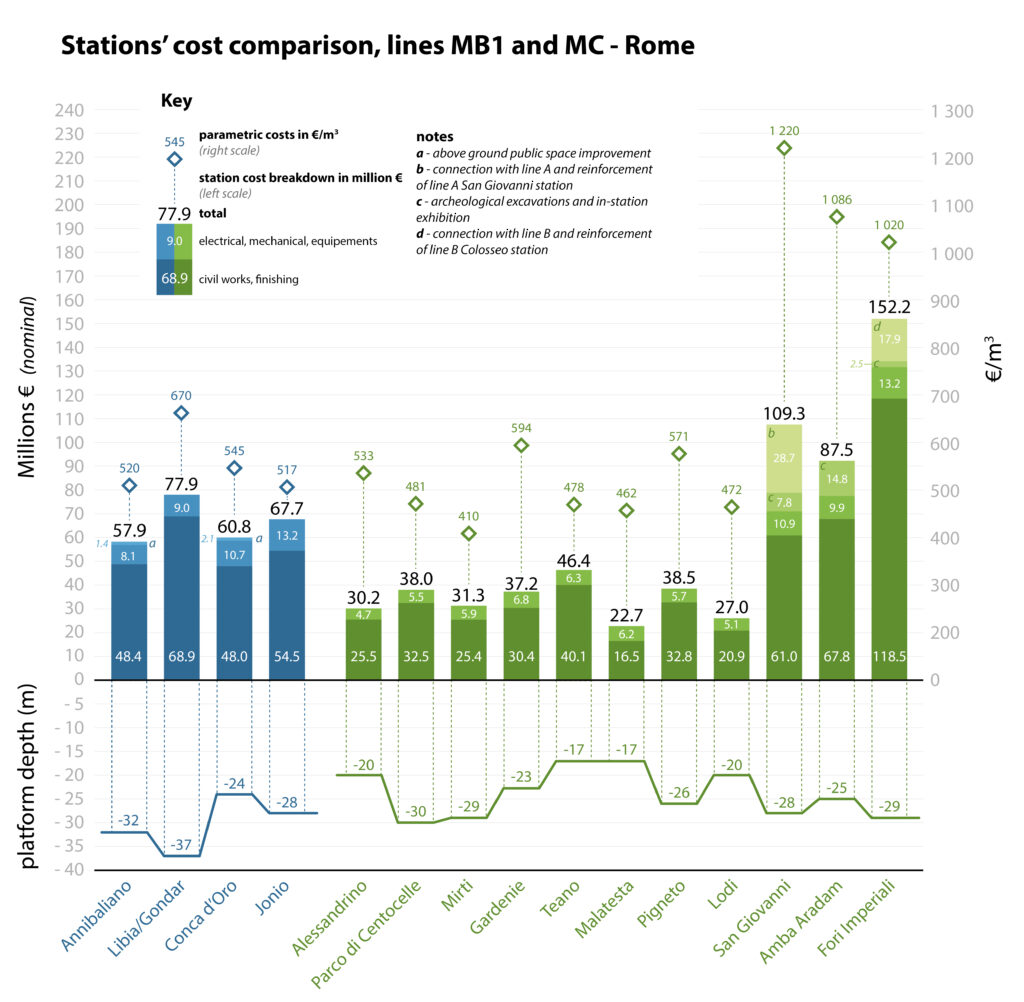
figure 33. Comparison of MC station costs (segments T4-T5 and T3) and MB1.
San Giovanni
The San Giovanni node, where MC connects with MA, shows how archeological risk can quickly drive cost escalation. In the original design, the station was planned to be built at a shallow alignment, with the platform level situated immediately under the mezzanine at around 12 m below street level. The station was to be constructed within a 250-m cut-and-cover box that would contain both the station and a crossover. Additionally, the station box was going to double as a TBM launch box, a common practice that we see in our New York and Istanbul cases. MC’s tracks were initially designed to cross the existing metro station at a higher level than MA’s, in a space left empty in the 1970s for that purpose, as the station was already planned as an interchange between MA and MC in the 1964 masterplan. The discovery of important remains from an Imperial age suburban agricultural estate, not detected during the preliminary test-boring investigations and the potentially “fertile” archeological layer as deep as 19 m, forced a complete redesign of the station layout to reduce surface excavation, with major cost implications. First, the station was sunk an additional 14 m to allow MC to pass under the MA station box, which resulted in a much deeper alignment for the tunnel both before and after the station. The crossover was placed after the MA station in a new, deeper shaft that was to be used as the launch box following section T3. Costs usually scale with depth, though often non-linearly. For example, by increasing the perimeter walls’ thickness from 80 to 120 cm and digging the station an additional 14 m deep costs more than doubled.[78] The need to go under the existing MA station box without interrupting service added €28 million in consolidation works for the existing station structures. Moreover, the limited clearance between the new MC tunnels and the foundation slab of the existing station required extremely costly and time-consuming excavation techniques involving ground freezing and micro-tunneling for the 150 m long tunnels connecting the San Giovanni MC station with the new crossover shaft on the other side (more about this particular element in the following section about tunneling). Archeological excavations and the decision to realize a permanent exhibition of the most interesting findings within the station itself added another €7.8 million to the bill.
Fori Imperiali
Fori Imperiali is the most expensive MC station, totalling €152 million. The station is situated under Via dei Fori Imperiali, a large, monumental boulevard built in the 1930s to connect Piazza Venezia to the Colosseum. The station is 29 meters deep and connects MC with the existing Colosseo station along MB, a vaulted structure built in a shallow alignment during the late 1930s and opened in the 1950s. The station’s high cost stems from numerous site-specific constraints. Because of the decision to avoid the complete closure of Via dei Fori Imperiali to vehicular traffic,[79] the station was built in two phases as two contiguous independent boxes; thus, doubling the number of deep diaphragm walls necessary for construction and requiring costly demolition in the subsequent phases. Furthermore, the particular two-step excavation technique developed with the archeological protection agency for the city-center stations, involves the construction of a first level of perimeter diaphragm walls to contain the archeological excavation, and then a second level of deeper diaphragm walls reaching to the impermeable layer of the Pliocenic clays that act as a waterproof bottom for the excavation. Moreover, costlier piling techniques had to be used in some areas to preserve the archeological layer from concrete spillovers. As a result, the various piles and diaphragm walls alone cost €29 million. On the other hand, massive prefabrication of construction elements (beams, slabs, perimeter walls) were used to reduce construction time and costs.
Due to the lack of aboveground space, the station box is L-shaped and incorporates only one of the tracks, while the other platform had to be partially built (80 m out of 110 m) through the enlargement of the TBM tunnel, accounting for €29 million, €17 million of which was used for ground consolidations prior to the enlargement excavation. Other factors that have contributed to the high costs are monitoring (€6 million), aboveground reconstruction of the public domain (€8.5 million), archeological excavations and an in-station ticketing hall for the Colosseum (€7.5 million) and all the costs related to the pedestrian connection with line MB (€17.9 million), that consists of a two-level tunnel whose upper deck was cut through the brick vault of the existing station during night and weekend closures.
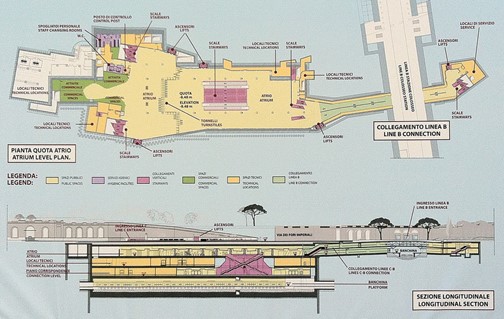
figure 34. Plan and section of Fori Imperiali metro station and of the connection with metro line MB station. Source: Metro C spa.
MB1 stations
As we have seen in the previous paragraphs and graphic (see figure 33), the four MB1 stations have a higher total per station cost than MC stations along the T4-T5 section. MB1 stations cost between €57.9 and €77.9 million. Despite the overall cost difference in the different stations, they compare more favorably when we compare costs per cubic meter, to control for variation in station volumes. This finding suggests that the primary driver of costs is station size. Libia/Gondar, the station with largest costs per cubic meter, is also the deepest of the four MB1 stations (42 m to the bottom of the excavation, 53 m for the retaining walls). Using data provided by Roma Metropolitane, it is possible to break down the costs of the station construction’s main components (see figure 35).
Civil works represent between 75.6% and 81.3% of station costs, with the structural components of the station’s box being the largest factor. All stations were built using the top-down cut-and-cover method, albeit with different configurations to adapt to local conditions: Annibaliano and Libia have stacked side platforms, while Conca d’Oro and Ionio have side platforms at the same level (see figure 35 for each station’s general layout and volume). Due to the shallow water table and resulting hydrostatic pressure, all stations required a waterproof bottom layer built using jet grouting from the surface prior to excavation. Waterproofing the station floor is the most expensive item for each station, accounting for between 19.2% to 25.1% of the total station cost. Retaining walls, which were generally built using hydromills, are the second most expensive elements, while excavation and disposal of spoils is the third most expensive. The internal structural elements, that is the lateral walls, the intermediate slabs and all the other concrete structures such as platforms, fixed stairs and lifts boxes, are the fourth most expensive element for stations. The remaining costs associated with structural elements are for the bottom and top slabs (between €1.9 and €2 million per station) and temporary structures for the maintenance and transport of the TBM through the stations and the installation of temporary noise and dust protections used during construction. The rest of the civil works’ costs are mostly for finishings (plaster, paving, cladding of walls and ceiling, etc.), additional entrances, site remediation, station furniture, wayfinding, and entrance canopies.
Mechanical and Electrical accounts for between 8.2% and 13.1% of station costs. Escalators are the largest cost at €4-5 million per station, while elevators, normally three per station, account for only a few hundred-thousand euros in total. Site preparation, including temporary diversions, building monitoring, utility relocations executed by the contractor (essentially sewage relocation) and public domain improvements in the affected areas beyond the simple site remediation, such as public squares and gardens on top of the station box make up the rest of the costs.
Even though each project has its own unique quirks, these examples highlight that even though no two stations are identical, civil works represent the lion’s share of station costs. These costs vary based on the overall dimensions of the box and, notably, its depth. Moreover, geology plays an important role in determining costs. In our Italian cases, specifically, a shallow water table increases the costs of underground stations, as we have seen in Turin and Milan, and will see in Naples’s case.
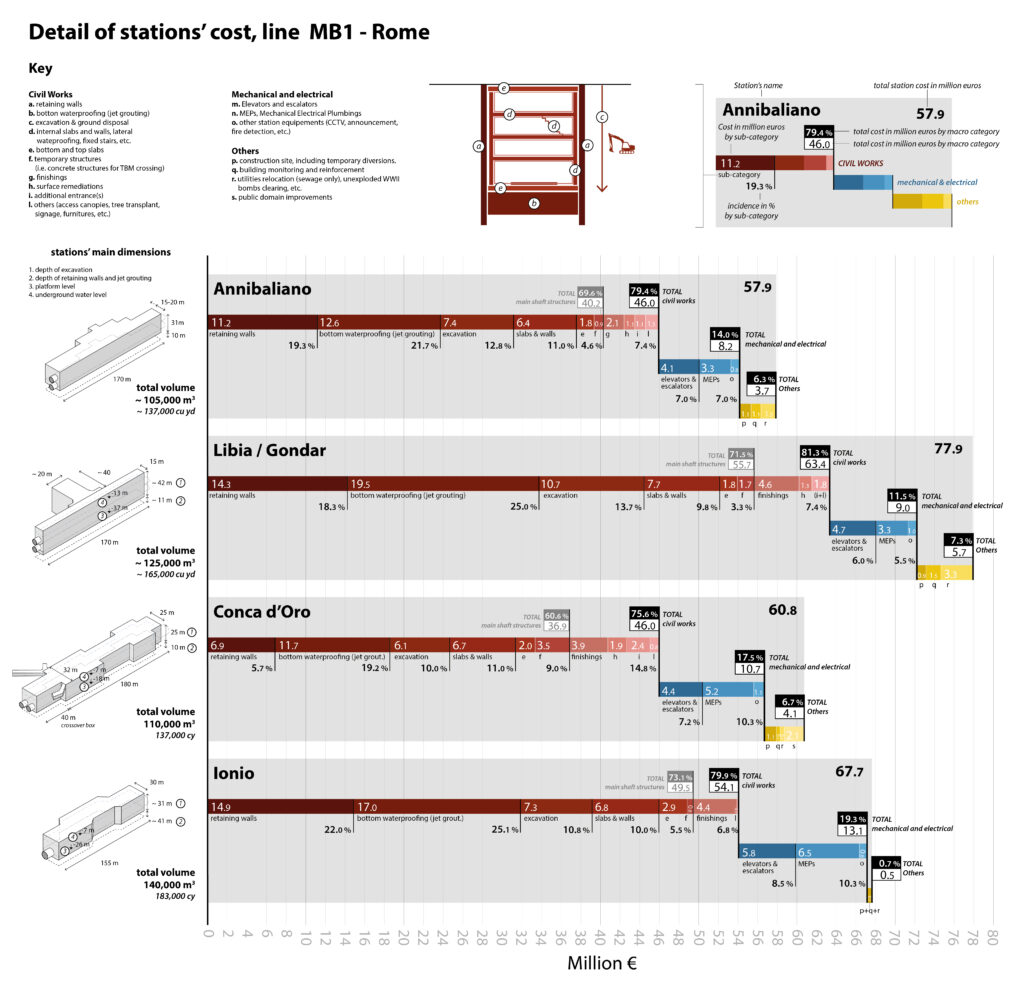
figure 35. Detailed breakdown of cost by item of MB1 stations
Tunnels
The other main civil engineering component of underground metro lines is tunnels and tunnel-related infrastructure, such as shafts needed for ventilation, emergency evacuation, crossovers, and TBM launching and extraction. In Rome’s case, the analysed projects (T3, T4-T5 for MC and MB1) have all been built using Earth Pressure Balance (EPB) TBM machines, given the presence of high-pressure underground water and incoherent alluvial soil. For T3 and T4-T5, the route consists of twin bore, 6.7m wide (external diameter), single-track tunnels with lateral evacuation walkways and overhead fixed catenary for trains having similar dimensions. Only the final section of line MB between Conca d’Oro and Ionio has been built using a single bore, 10 m-wide double-track tunnel.
Despite similar technical characteristics, the relative per kilometer cost of the different tunneled sections varies greatly, as shown in figure 36. Sections of MB1 were tunneled for as little as €24.3 million per km, while MC’s T3 segment cost €105.2 million per km. The primary reasons for this 400% difference in costs are TBM productivity, tunnel dimensions and shafts, building-stability monitoring, and specialized excavation techniques:
- TBM tunnelling. The T3 segment of MC has by far the highest TBM tunneling costs, at €37 million per km, except for the short section of MB1 built with a larger single bore TBM, at €42 million per km. Yet, the reason for higher cost on MB1 Conca d’Oro – Ionio section is mostly related to the relationship between the short distance of the tunnel, in this case 1.1 km, and the high fixed costs of TBM tunnelling techniques, namely the purchase/rent, transportation, assembly and launching of the TBM. In the case of T3, many factors contributed to a TBM excavation cost far higher than in the T4-T5 section, despite identical soil characteristics, tunnel diameter and TBM machine: i) a consistently lower average digging speed (5m/day for T3 versus 18m/day for T4-T5)[80], mainly caused by longer delays imposed by the time required to move the TBM backstage from the initial launching shaft (see point iii), but also by non-technical factors, such as the political indecision over whether to continue the line past Fori Imperiali up to Venezia, that held the TBMs at Fori Imperiali station for several months; ii) the decision to bury the TBM shield under Piazza Venezia, since construction on that station has been delayed for technical and financial difficulties, and political squabbles, that caused €4.5 million in extra costs; iii) Further, €3.9 million was spent moving the TBM staging site during construction from the initial launch box to the Amba Aradam station, to allow for an anticipated opening of the crossover at shaft 3.3 – via Sannio, necessary to increase frequencies on the already opened section until San Giovanni.
- Fixed cost. The relevant difference in tunneling cost within the MB1 project can be explained mostly by the very high fixed costs on the much shorter 1km section between Conca d’Oro and Ionio. The decision to switch to a single bore tunnel for this final section, in order to build the crossover within the tunnel without requiring an additional shaft, required the contractors to acquire, transport, install and then dismantle a new TBM for a very short section. The impact of those fixed costs namely construction staging and logistical issues on the per km cost was dramatic. Moreover, in order to vacate the Conca d’Oro station for an early commissioning of the Bologna-Conca d’Oro section, an additional shaft needed to be built a few dozens of meters north of Conca d’Oro station’s box. This supplementary shaft was necessary in order to create a vertical muck-removal system for the earth excavated by the TBM shortly after it began its drive. Initially, the conveyor belts transporting the excavated earth were horizontal, thus stretching back into the tunnel. Once the decision was made to press MB1 into testing and revenue service, a second muck removal solution had to be devised to allow for both muck removal and active train operations. This scenario is similar to the one described in the previous section for T3 and is an example of how uncertainties over the workflow and external necessities (such as early openings)[81] can trigger cost increases.
- Ventilation or emergency access shafts located between stations tend to be quite small and cost a few million euros each for T4-T5 and MB1. TBM launch box costs run into the tens of millions of euros because they have the dimensions of a station and require significant excavation. While these launch boxes are often repurposed as station boxes, there is still a need for dedicated shafts when there are space constraints or a desire to speed up the construction schedule. Again, section T3’s shafts budget was very high. It cost €28 and €36 million to dig two shafts (3.2 and 3.3), which is similar to the station costs for the T4-T5 section. These shafts are so expensive because they double as crossovers, are quite deep (notably 3.2 – Celimontana, which is 59 m deep), and required partial tunnel enlargement to accommodate the crossover track geometry. By breaking the project up into multiple phases, a hallmark of American projects, namely Los Angeles’ Purple Line and New York’s Second Avenue Subway, rather than building it all at once, there needed to be additional crossovers spaced at a very short distance to allow for higher frequencies as each segment opened for revenue service.
- Building-stability monitoring costs is a much greater for MC’s T3 city-center section (12.7% of the tunneling cost) versus only 2% for the outer T4-T5. For MB1, monitoring costs ranged between 13.7% and 24.5% of the tunneling cost due to its winding alignment with stacked tunnels that don’t follow a single aboveground thoroughfare, but pass under high-density interwar and postwar housing built on inconsistent soils, and its crossing the river Aniene.
- Unique excavation techniques. T3’s detailed costs show how a single node can increase costs dramatically if it entails non-standardized excavation conditions and techniques. The already mentioned decision to sink the MC alignment below the MA station while building a new TBM launching shaft for the T3 section (3.3 – via Sannio) located on the opposite side, resulted in the necessity to excavate the remaining 150 m with a costly approach. As part of the tunnel crosses under the base slab of the existing MA station, it necessitated an ad hoc approach that included the use of a pilot tunnel bored by a micro-TBM to prepare the ground for additional non-mechanized excavation (see inbox in figure 36)[82]. This very short, non-standardized 150 m twin tunnels increased the cost of T3 tunneling by €63.2 million.
Overall, tunnelling costs are sensitive to a combination of factors: longer TBM sections tend to be cheaper on a per kilometer basis because high fixed costs diminish over greater distances; interaction with and constraints imposed by above ground structures (limits on ground settlement, interference with above and belowground structures) can be extremely onerous, forcing consolidation and constant monitoring; political uncertainty and design changes during construction can increase the final costs of tunnelling by reducing TBM productivity and the overall efficiency of construction phasing and workforce allocation.
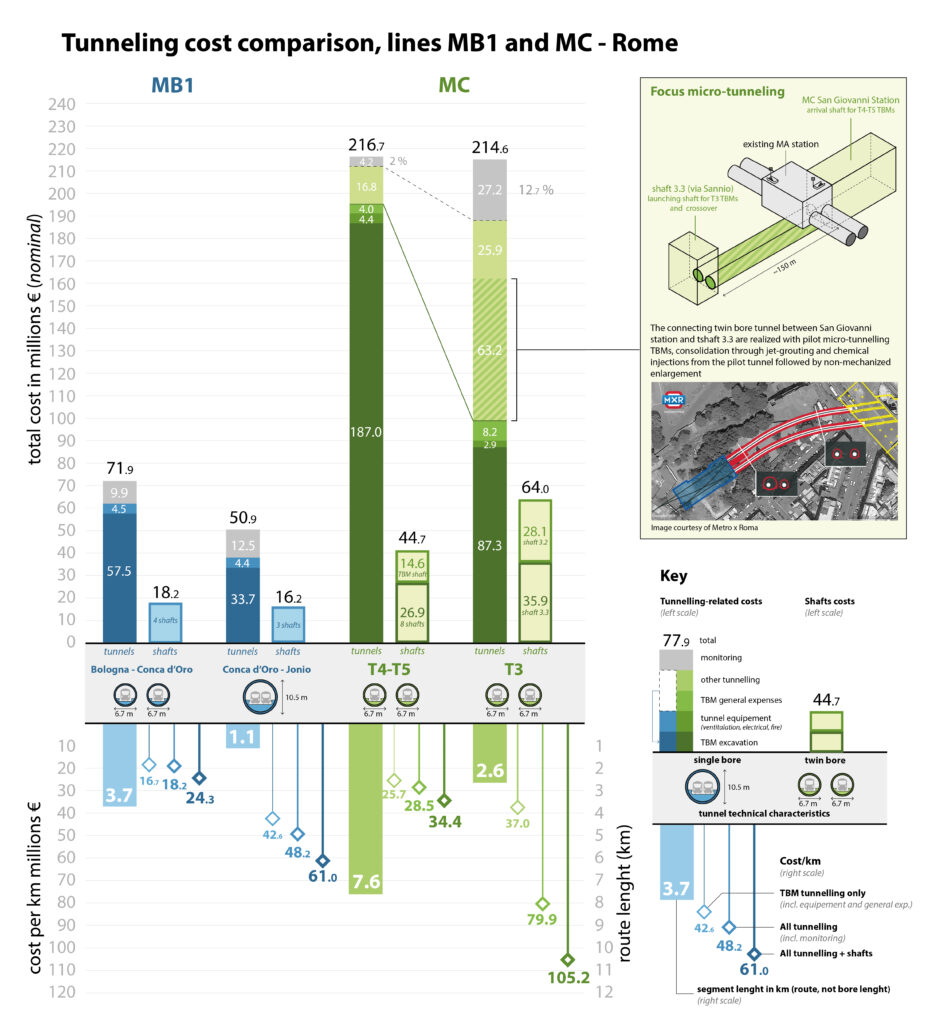
figure 36. Tunnelling cost comparison, lines MB1 and MC (segments T3 and T4-T5).
5.7.6 Cost overrun: the archeological problem and who bears the risk?
MC ran into major cost overruns from the initial bidding and contract signature in 2004, when the budget grew from €3.047 billion for the entirety of T2-T7 to €3.739 billion in 2012, a 22.7% increase. The major changes in overall cost, depicted in detail in figure 37, are mainly due to two major project revisions. In particular:
- 2004 (A). The total project cost was €047 billion for the so-called “fundamental section” which encompasses sections T2 to T7, from Clodio/Mazzini to Pantano. The construction contract, which includes hard and soft costs related to the project design and management function of the General Contractor was €2.051 billion.
- 2007 (B). Total project costs remain unchanged, but construction costs are slightly reduced to account for the winning joint venture, Metro C spa, which came in 6% lower than expectations. Total project costs are unchanged as savings are added to the project’s contingency and partially transferred to the future T2 section.
- 2009 (C). The project encountered its first major contract revision. The overall cost remained unchanged, but the hard costs increased from €2.365 to 2.558 These additional expenses, covered by contingencies, were mainly related to a large change order for technological improvements (essentially a move toward better automatic train operations and the full automation of station operations).
- 2010 (D). A second major contract revision was finalized. Archeological findings at the San Giovanni Station required a redesign from a shallow station to a deep station (see description in section 5.5). In addition to these design changes, there was also a two-year reappraisal of the construction process prompted by the Sovrintendenza for archeological protection and carried out under the supervision of a “Czar” nominated by the Central Government. The overall project cost reached € 3.338 billion, a 9.5% increase.
- 2012 (E). The final major cost increase is linked to litigation between the contracting authority (Roma Metropolitane) and the General Contractor about extra costs claimed under the “riserve” mechanism (see section 3.5) that was settled in 2012 after €124 million in additional compensation was agreed to for sections T7 to T4. The projected cost rose to € 3.739 billion, a 23% increase compared to the initial estimations
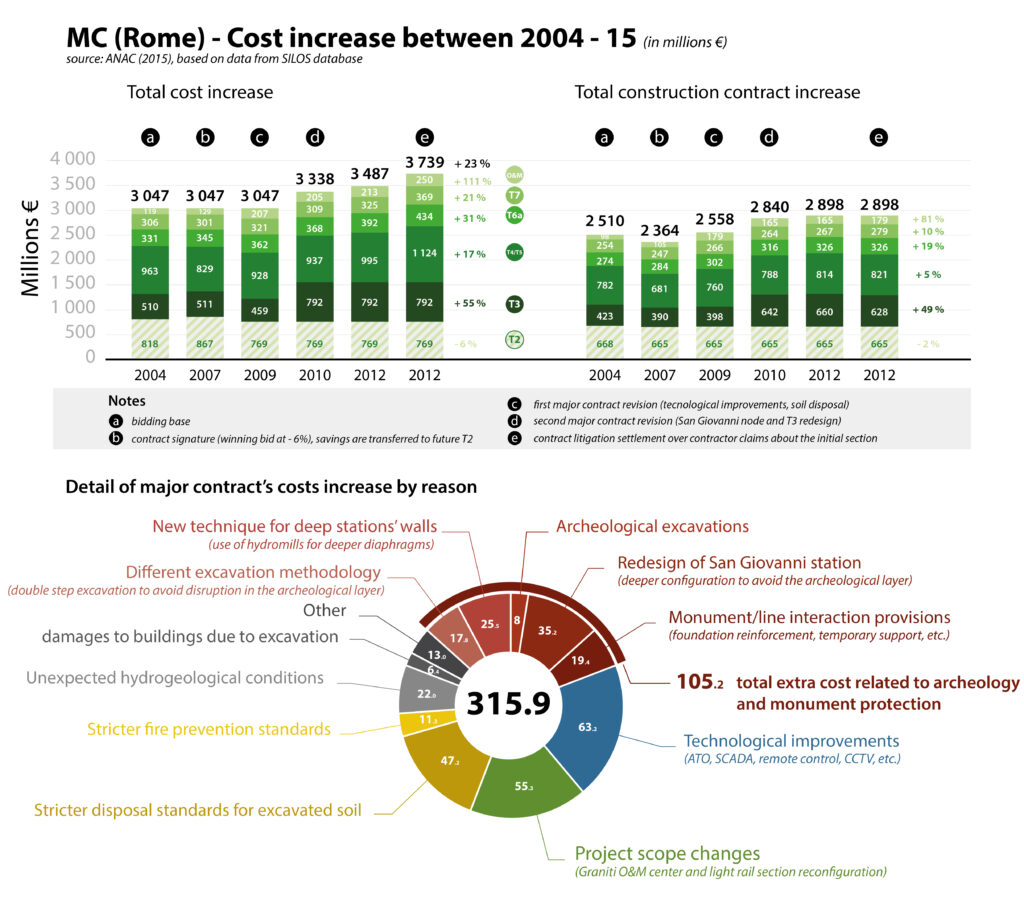
figure 37. Summary of MC cost increase, 2004-12.
The cost increase between 2004 and 2012 was not equally distributed across the project’s budget. The most relevant cost variations are concentrated in two sub-sections of the contract: the Graniti Operation & Maintenance (O&M) facility, whose cost more than doubled between 2004 and 2012 and the T3 section in the city center, which experienced a 55% increase. While the increases to the O&M facility are significant, they are also largely an accounting trick. The facility was supposed to be enlarged in the 1990s under a separate project was absorbed by the MC more than a decade later. The T3 section’s cost increases are mostly attributed to unanticipated archeology-related changes, notably the complete redesign of the San Giovanni node and its cascading effects.
Sub-sections T4 and T5, despite being completely underground and also encountering unanticipated archeological findings had relatively modest 5% cost increases, mostly due to changes to the automation system decided after the contract was signed and geotechnical problems that damaged adjacent above ground buildings. If we include the contractor’s claims,[83] overall costs rose by 17% between the contract signature and the commissioning in 2014. Even considering that this section is less challenging than the city center stretches (T3 and T2), it is generally acknowledged by engineers working in the project and by official project overviews[84] that the fact that T4 and T5 did not run into major cost overruns is in part due to the contract being awarded based on a more refined level of design compared to the historic core’s section (T3), where the project’s design and estimates were based on an insufficient assessment of the archeological risk and its consequences for station and tunnel design. The choice of rushing the procurement phase in the early 2000s was due to many factors, including the political pressure to start building as soon as possible, even if financing for the whole line was not yet secured and the project was still partially undefined, notably the archeological risk and the related excavation method to be used in the city center sections.
The unsolved problem of the compensable claims
Part of the story about cost increases remains to be written. The General Contractor, Metro C Spa has claimed a significant amount of “riserve” (compensable claims) over the T3 section, whose precise amount has not been disclosed yet. Thus, it is possible that the final cost of the T3 section could increase by another 5-10 % before the end of the project. The long-term D-B framework contract signed with the general contractor, which includes the construction of all sections from T2 to T7 as funds become available, but doesn’t establish a clear process for resolving compensable claims before the end of construction.[85] The future of MC is unclear because of the issue of compensable claims, Roma Metropolitane’s legal liabilities[86] and Rome’s precarious financial condition.
5.7.7 Archeology, political squabbles, and a lacking project as the main drivers of cost increase
Rome’s MC is an extremely informative case that shows how costs rise and fall based on a large number of inter-related variables that are affected by constraints and scope changes that appear to be minimal to observers but have a dramatic effect on costs. To summarize, it is important to highlight four key lessons that emerge from Rome’s MC case.
First, there are a litany of constraints that arise from Rome’s urban form and geology and requirements imposed upon construction to protect Rome’s historic heritage. In every city we have looked at there are different “rules of combat” or “rules of engagement” that structure design decisions, construction techniques, and the projects’ overall schedules. In Rome, poor ground conditions and the Heritage Superintendencies’ strict 3 mm ground settlement limit meant that stations and tunnels were dug deeper than in previous generations and monitoring construction impacts was a greater concern.
Second, changes made in the middle of construction, especially when those changes need to conform to the rules of combat outlined above, generate a snowball effect on costs. The redesign of San Giovanni Station triggered the need for additional shafts for crossovers because of schedule delays on other sections, the relocation of the TBM launch boxes, the shifting of construction staging sites, etc. Large metro projects are massive coordination projects. Changes accumulate and ramify through the project rather than simply adding or subtracting easily. What looks like a minor change order can be the equivalent of pulling a string that ripples through the entire project.
Third, the choice to deliver the project through a Design-Build “General Contractor” procurement played a role in inflating costs, or at least in weakening the supervising capacity of the public authority. Soft costs linked to the General Contractor function of design and delivery management, which accounts for 10.6% of the overall cost of sections T7 to T3, are slightly higher than comparable projects when the contracting authority-side soft costs are also included (6%). In return, the risk transfer from the public to private sector implied by the D-B formula didn’t work, even if this is one of the major arguments in favor of shifting project design and management to a private entity through alternative-project delivery schemes that tend have higher upfront costs. The cost increases and the still unsettled compensable claims documented in this chapter underscore how risks that were shifted onto the General Contractor, ended up being pushed back onto the public. As the Court of Auditor and ANAC repeatedly stated,[87] the General Contractor delivery formula failed to determine who was the real bearer of risk. They determined that it is impossible to account for archeological risk when the archeological issues are insufficiently studied and enumerated. Since the bidding process was expedited and based on preliminary project documents that lacked adequate detail to quantify risks. At the same time, the transfer of the DL (work supervision) function to a firm directly hired by the GC hindered the capacity of the contracting authority to be an effective AS – Alta Sorveglianza. One official we spoke to who was involved in the project explained that in principle the General Contractor procurement strategy should align the contracted-out construction manager and Roma Metropolitane to manage the contractors effectively. In practice the contractors and construction management were organized against Roma Metropolitane (Personal Interview A 2021). With limited internal resources to manage the project effectively, similar to what we saw in our Green Line Extension case, and prolonged uncertainty about the viability of the project, public oversight capacity proved inadequate.
Finally, political indecisiveness and conflicting directives proved to be another cost driver of MC. T3’s high tunneling costs and the slow pace of excavations stem from the municipal government’s inability to decide whether or not to continue the project beyond Fori Imperiali station. Similar political fickleness over funding the whole T2 section may result in incredibly high costs for the Piazza Venezia station, whose construction in a separate contract from the T2 section is currently under discussion, even though it will lead to higher costs because of complex logistical issues and the need for a deep cavern for an additional crossover.
5.8 Naples: line 1
5.8.1 Introduction
The city of Naples is the center of the third largest urban area in the country (940,000 inhabitants in the city proper, 3.6 million in the metro area) and has a long tradition of building complex urban rail infrastructure. The city boasts Italy’s first cross-city rail line for long distance and suburban service, which opened in 1927, and a well patronized network of legacy suburban lines radiating out from the city center terminals: the Cumana and Circumflegrea lines to the West, and the Circumvesuviana network to the East. Yet, Naples started to build its first proper metro line only during the 1970s and projects to expand and improve the existing rail transit network have been plagued by delays, cost overruns, weak political commitment and challenging geological conditions. Today, the metro network extends for 28.5 km carrying 150,000 daily passengers, mostly on the urban loop line (line 1) and in the linked interurban metro to Piscinola-Aversa (MCNE-line 11). Two more sections of the line 1 loop, accounting for 7 kms and 8 stations, are now under construction and are planned to open by the mid-2020s. Line 6, a 6.7 km, 8-station light metro, that originates from an abandoned 1980s LRT project, is currently under construction and will open in 2022-23.
The history of the development of Naples and Campania’s urban rail system is a fascinating and instructive one, with many positive lessons such as the development of one of the earliest and more thoughtful experiments regarding fare integration in the late 1990s (UnicoNapoli and UnicoCampania) and a regional planning framework for transit. On the other hand, line 1’s long-winding, more-than-four-decades-long saga and its relatively high capital costs are a lesson in the multiple drivers of construction costs. The central section of line 1, that we will analyze in greater detail here, is by far the most expensive metro line built in Italy, at €406 million per kilometer with a real value of $635 million in actualized PPP terms. Line 1’s costs far outstrip other Italian projects, and, in a way, share similarities with challenges encountered in Rome: a very difficult urban and geological context, archeology, and funding uncertainty. In addition, Naples’s line 1 had the added goal of providing additional public benefits, such as rebuilding the old city’s public realm. This mixed mandate led to oversized, expensive stations. Finally, the persistence of an opaque, non-competitive Design-Build delivery scheme further contributed to inflating construction cost.
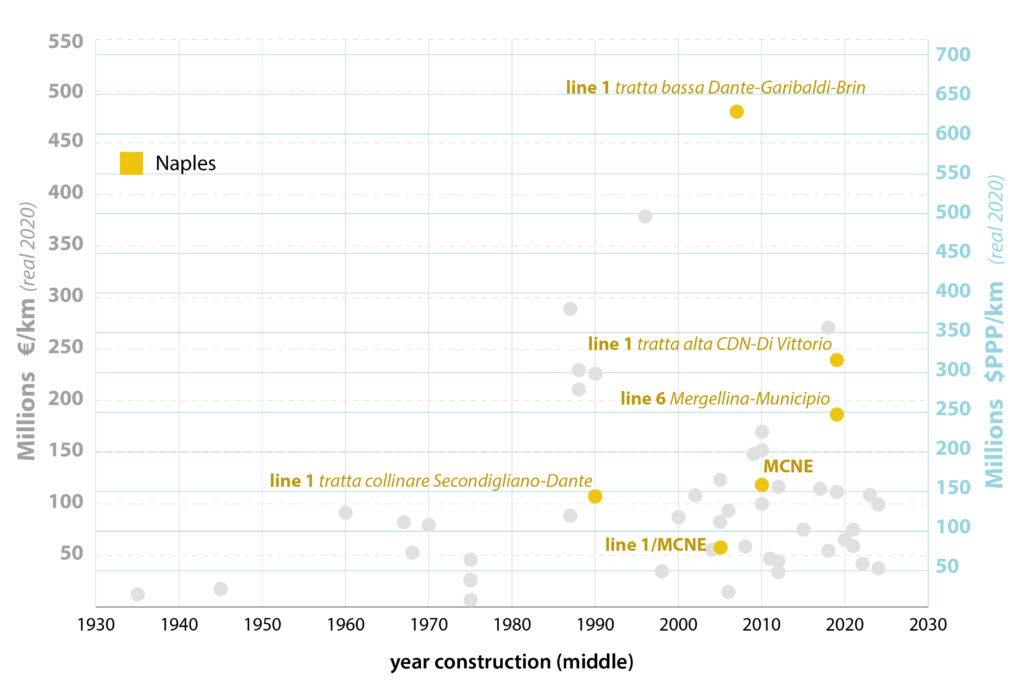
figure 38. Historic construction costs of Naples metro lines in real terms, Euros and Dollar PPP (2020).
5.8.2 Line 1: project overview
Naples’s line 1 is a heavy-rail line serving the core of the city and its major transportation hubs. As of 2021, it extends for 18 km with 19 stations, stretching from the peripheral neighborhoods of Scampia through the hilly Vomero and then down to the city center up to Garibaldi main railway station. The particular shape of the line, it includes a loop and a very steep section (5.5% grade), responds to the city’s topography. As most of the pre-1980s metros, Line 1 has the same technical characteristics of Milan’s original three lines and Rome’s MA, that is 110m platforms and 2.85-m wide trains, as this was the technical standard established in the postwar period for heavy metros.
Line 1 dates back to the 1970s, when the city of Naples began planning a rail-based connection between the rapidly growing hilltop neighborhood of Vomero and the city center. The line was initially dubbed the “metropolitana collinare” (hilly metro, TC in the map pictured in figure 39) and a rack railway technology to secure the rolling stock as it climbed and descended the changes in elevation. In 1976, the city awarded a “concession of sole construction” (a form of Design-Build) without a public tender process to a consortium of companies called Metropolitana di Napoli Spa (MN), initially led by Metropolitana Milanese, who eventually exited the venture a few years later (see section 6.2). This single decision locked in a long-term binding agreement without a clear timeframe, clearly defined scope of work, or alignment for Line 1. The first section of line 1 was a short two-station pilot funded by the city during the second half of the 1970s. After the Irpinia earthquake in 1980, construction stopped and designs were redrafted to comply with the tougher seismic regulations. Works resumed in the mid-1980s thanks to an injection of funds from the central government and the EU, while a mostly elevated extension to Piscinola (TV in the map) was also approved and funded by the national government. Thanks to law 211/92, L1 was extended down the hill from Vanvitelli to Dante (TB.1 in the map), while an additional extension through the core of the old city from Dante up to Garibaldi Station (TB.2, pictured in the map and the focus of our analysis) was also planned, but with an alignment different from the one eventually built. Finally, in 1993, after fifteen years, the first section of the line was opened for revenue service.
In the years following the first section’s opening, the alignment and the scope of the project evolved multiple times within the very fluid political environment of the early 1990s and amid the corruption scandals of Tangentopoli, that also affected line 1 construction. In particular, during the second half of the 1990s, a new progressive municipal government, devised a comprehensive plan for the expansion of the urban rail network in the metro area, while starting to implement a fully fare-integrated system (UnicoNapoli). Following the 1997 Municipal Transportation Plan (Piano Comunale dei Trasporti), also known as the “hundred stations plan,” line 1 took its current form: a loop line connecting the city’s core–where Municipio station is a major node that serves line 6 and the ferries to the Islands–central Station, airport, and the modern CBD. The project’s scope broadened from a simple transportation project to a far-reaching tool to reconfigure the city center. “Stazioni dell’Arte” (Art Stations), to take one example, gained momentum and became a consistent design approach making the new metro stations into unique showpieces designed by renowned architects. These changes in scope and the project’s orientation are one of the key drivers behind the central section’s dramatic cost increases, which saw its final cost triple between the early 1990s estimates and the completion of the project in the 2010s.
Preliminary works on the city center section of the “tratta bassa” (TB.2) eventually started in 1998. Yet, construction was dramatically delayed by extensive archeological findings during the major stations’ excavations, in particular at Municipio and Duomo stations. The extent and relevance of the archeological findings almost brought construction to a halt in 2008, when a joint “Czar” (Commissario Straordinario) for both Naples and Rome’s MC was nominated to solve both cities’ archeological challenges. Like in Rome, unanticipated archeological discoveries have been a major factor in increased costs and delays. As a result, the opening of the city center section was delayed several times and was eventually completed in phases between 2011 and 2015, with the Duomo station only partially opened for revenue service in 2021, some twenty years after works had begun.
Cobbling together the funding for line 1 has been a persistent problem. Line 1 was initially funded by the city via municipal debt or from the public lending authority, CDP. In the aftermath of the Irpinia earthquake, the EU played a key role in securing funds for Line 1. European funds funneled through the Regional Development Fund (ERDF) covered up to half of the €1.75 billion for the “tratta bassa” city center section, with the remainder coming from the city and national government.[88] Even with this assistance from the EU, the stop and go nature of funding and construction has contributed to cost increases.
Two more sections of line 1 are currently under construction: the 3.5 km, 4-station extension from Centro Direzionale to Capodichino airport (€652 million or $242 million per km) and the 3.3 km, 4-station extension from Secondigliano to di Vittorio (€356 million or $154 million per km). Both sections have encountered funding and schedule delays, just like the rest of the line. The extension to the airport was descoped in 2012 by cutting one station and scaling back the architectural grandness of the remaining 4 stations to reduce the overall costs by around €300 million. The second section that is managed directly by the Campania regional government, in part, because it will serve line 1 and suburban metro MCNE once completed, was started and halted several times because of political squabbles between the city and the region following a shift of the regional government from the center-left to the center-right between 2010-15. The remaining gap in the loop (a short tunnel section and di Vittorio station) has been funded recently and will possibly be completed by the mid-2020s. Even though we will not cover these more recent project iterations in detail, these recurrent problems of discontinuous political commitment and inter-governmental fights were highlighted in an extensive Court of Auditors report (CdC, 2017a) detailing the general governance problem that has plagued the project throughout its history.
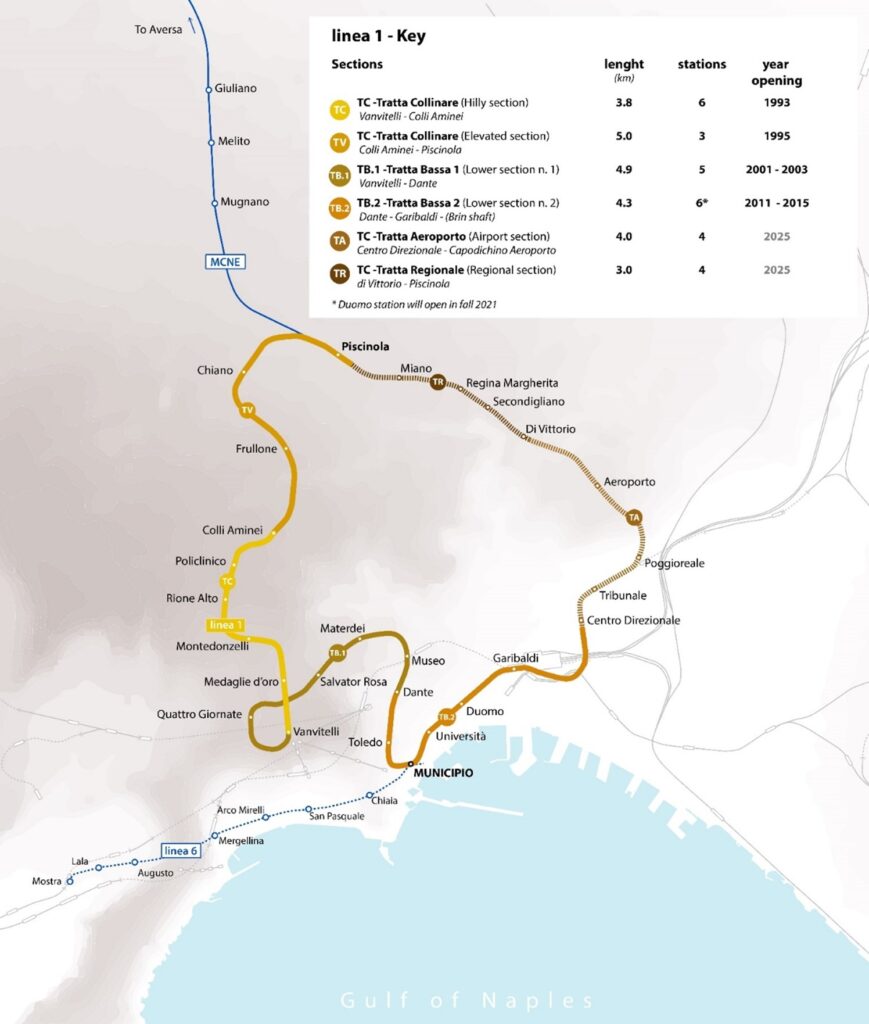
figure 39. Line 1’s different phases with opening years.
Table 6. MC - Project’s Timeline summary
| 1976 | A Design-Build concession contract called “concession of sole construction” is awarded to the joint venture Metropolitana di Napoli S.p.a (MN) composed of local construction firms and supported by Metropolitana Milanese. |
| 1978 | Design is finalized for a 11km line connecting the hilly area of Vomero to the city center and the central station. |
| 1980 | The Iprinia earthquake hits Naples. Construction is halted to update design to seismic regulations and address the city’s financial troubles. |
| 1984 -1985 | Work resumes thanks to EU funds and a special law granting Naples the right to borrow more money with the central government guarantee as matching funds. |
| 1985 | A 5 km mostly elevated extension to the outlying social housing neighborhoods of Scampia and Frullone is approved. |
| 1986 | The first consistent grant from the central government (500 billion liras) boosts the construction pace, previously limited by the scarcity of local financial capacity. Construction starts on the sections between Vanvitelli-Dante and Colli Aminei-Piscinola |
| 1992 | Further funding is secured to complete the section reaching the city center at Dante |
| 1993 | The first “hilly” section (tratta colllinare) of line 1 is inaugurated between Vanvitelli and Colli Aminei |
| 1992 - 1996 | After MN is implicated in Tangentopoli-era scandals, its contract with the city is revised and unit costs are reduced by 30%. |
| 1995 | The elevated section between Colli Aminei and Piscinola enters revenue service. |
| 1997 | Major redesign of line 1: the city center (tratta bassa) section is extended to reach a new exchange node with line 6 and ferries at Municipio, A new ring section is devised to connect Capodichino airport and Piscinola. The “Stazioni dell’Arte” (Art stations) concept is adopted. |
| 1998 | Grants from the central government are secured together with matching EU funds. Preliminary works start in the Dante-Garibaldi section of line 1 (the so called tratta bassa) across the city center |
| 2001 - 2003 | The Vanvitelli-Dante section of line 1 is opened. |
| 2011 -2012 | The Dante-Università section of line 1 is opened |
| 2012 | Major project revision for the section between Centro Direzionale and Capodichino airport: the line is shortened, urban realm improvements are descoped, and one station is removed to save some 300 million euros. |
| 2013 - 2014 | Funding is secured for the Centro Direzionale-Aeroporto section and preliminary works start |
| 2013 - 2015 | The Università-Garibaldi section of the TB.2 is opened |
| 2021 | Duomo station is partially opened |
5.8.3 Cost Detail: grand and deep stations, bad geology, and an archeological Eldorado.
The central section of Naples’s line 1 is by far the most expensive metro section ever built in Italy, with a total capital cost of € 1.748 billion in nominal value, that is almost $635 million per km in PPP real terms. The detailed breakdown of the capital costs of the “tratta bassa” (see figure 40) provides a good insight into the main drivers that makes this project an outlier in the Italian context in terms of construction cost.
Line 1’s design was overhauled during the 1990s. The new design called for a deeper, hook-shaped route instead of the originally planned cut-and-cover tunnel following 19th and early 20th century large Haussmann-style thoroughfares, such as the Rettifilo Vittorio Emanuele. This change in construction technique and alignment had a major impact on costs (see section 8.4 for more details): The five deep and partially mined stations that replaced the shallower cut-and-cover stations cost €667 million or 38.1% of the project total and represent that largest project expense. As we will see in greater detail in the following section, this high cost is the result of six factors: First, the construction technique; second, the depth; third the additional access shafts; fourth, new designs that called for vast mezzanines and “hypogeum plaza;” fifth, the extensive public realm improvements and, sixth, an overall “grandeur” characterized by ample volumes and high quality architectural finishings.
Tunnelling accounts for €286 million (including shafts) for 3.9 km of twin bored tunnels and about 400 meters of cut and cover and open trenches at the Eastern end, mostly built under the wide throat of Garibaldi station and along the Circumvesuviana suburban rail alignment. At €65 million per km in nominal terms or $103 million in real terms, the central section of Line 1’s tunneling costs are by far the highest per kilometer cost of tunneling among the cases studied in this report. Naples’ difficult geology and high-density urban area is another important driver of costs: soil consolidation and freezing techniques, using liquid nitrogen to consolidate the excavation front of incoherent soil and prevent dangerous soil settlement, in a context characterized by underground brackish water, accounted for €74 million. Finally, archeology has been another major driver of costs. In one sense, the decision to incorporate some of the findings into the stations was a clever embrace of inevitable preservation concerns. No matter what, however, the excavation, removal, restoration, and transport of these items added an additional €266 million to the project and ensured each station would be unique.
Finally, even though the V.A.T. is more than 75% of the soft costs, the overall accounting structure of the Design-Build concession scheme makes it difficult to identify accurately the soft costs, as MN applies a fixed 3.5 % fee for design and management on top of the itemized costs negotiated in the contract (see section 8.5). This structure makes it difficult to quantify what counts as design and management as compared to the other cases that explicitly break out those costs in their financial documents.
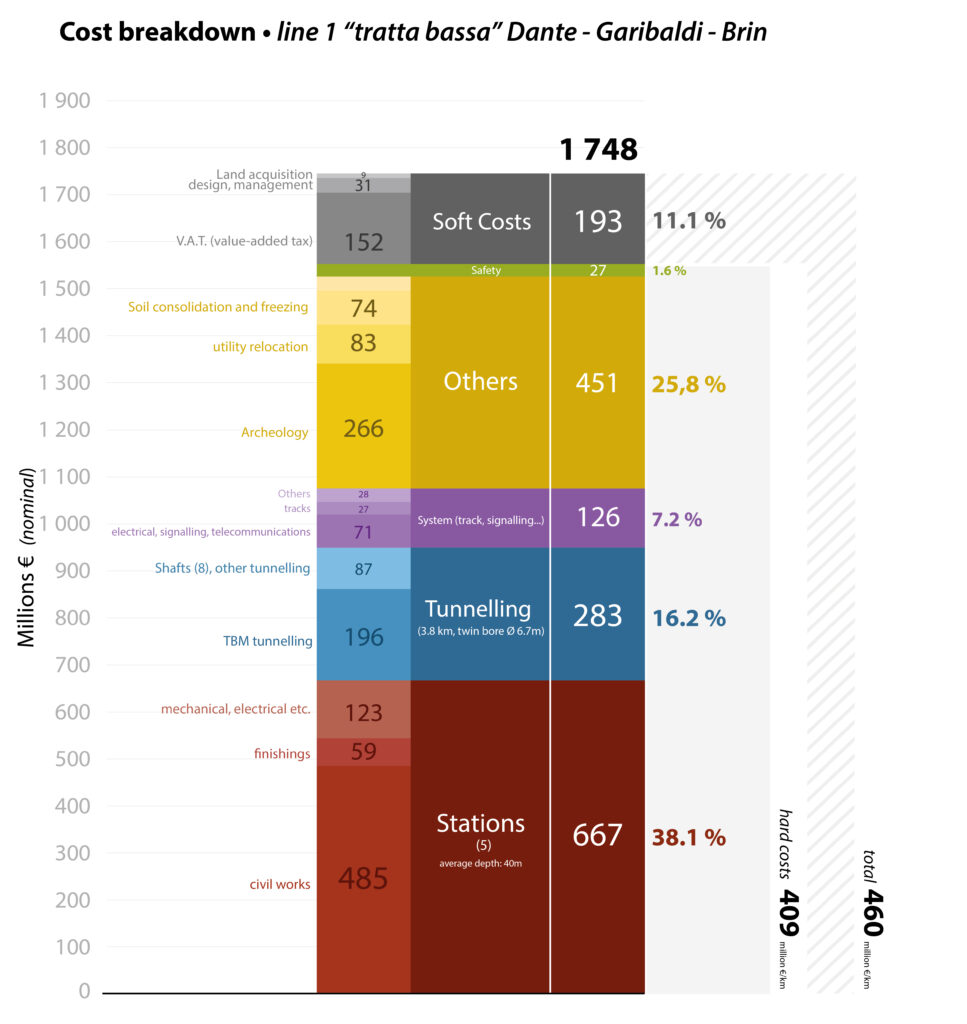
figure 40. Costs breakdown of the city center part of the “tratta bassa” section of line 1 in Naples
5.8.4 Stations as main drivers of costs: construction technique, depth and ‘over-scoping’
The 1997 project revision called for the complete overhaul of the station engineering completed in the preliminary project in the early 1990s. The decision to build the city-center section of the line with a deeper alignment using TBM bored twin tunnels instead of shallow cut and cover[89] necessarily forced station construction deeper, requiring a mix of cut-and-cover and mined techniques. Each station has a centrally located main shaft—approximately 16-20 m long, 45 m wide and up to 46 m deep that was built mostly using cut and cover. The shaft contains all vertical circulation elements (escalators, elevators, stairs) from the sub-surface mezzanine to the level situated just above the track level. Platforms were then built by enlarging the 6.7-m wide TBM tunnels to approximately 10.7 m, using various excavation techniques that involve complex operations of soil consolidation and artificial freezing of the excavation front for approximately 50 m on each side of the shaft, while the smaller connecting tunnels from the main shaft to the platforms were built using NATM-ADECO excavation methods[90].
The choice to build deeper stations was accompanied by the broadening of the project’s scope, associated with the so-called Stazioni dell’Arte program. Famous architects were invited to design not only the stations’ layout and interiors, but, in most cases, station construction was accompanied by the complete redesign of the public realm above the stations. Station complexes now included secondary entrances to improve accessibility, while showcasing archeological findings and artwork, based on the concept of the metro as a ‘compulsory museum’ for travellers.[91] Even though the name of the program (Stazioni dell’Arte – Art Stations) might suggest that the art installations themselves had a primary impact on costs, they in fact represent only a tiny fraction of the overall capital budget. It is the associated works for expansive mezzanines, public realm redesign and secondary entrances that drove costs, as we will see in the following three examples: Garibaldi, Municipio and Toledo stations.
Garibaldi station (€ 166.8 million)
Garibaldi stations is a major transit node where Line 1 connects with the mainline rail terminal (Napoli Centrale), the passante cross-city tunnel for regional rail (Napoli Piazza Garibaldi) and the Circumvesuviana suburban rail network (Napoli Garibaldi). The station layout itself follows the design of all city-center stations, with a main access shaft and platforms built within enlarged tunnels. Following the 1997 project revision, the scope was broadened to include a complete overhaul of Piazza Garibaldi, the large 58,000-sqm square facing the main rail terminal, and the construction of a 200m-long “Hypogeum” mall, covered with a pergola designed by the architect Dominique Perrault, that doubles as station access and an “open-air” mezzanine connecting Line 1 to the rest of the transit hub. The hypogeum mall and the complete overhaul of Piazza Garibaldi cost €53.1 million, or approximately a third of the €166.8 million station costs.
Toledo Station (€ 143.6 million)
Toledo station is situated in the core of the densest part of the historic center of Naples. It provides access to Via Toledo, one of the city’s main shopping thoroughfares, the Spanish Quarter and connection to the Central funicular. Because of the lack of aboveground space for the construction of a sufficiently large shaft, the station construction involved an even larger proportion of mining: a smaller lateral shaft was built instead, and platform access is provided by a deep mined cross-cavern. This alone resulted in greater mining costs (€46.2 million) compared to other comparable stations in the central section. Moreover, the decision to build a second access point from Montecalvario square in the heart of the dense Spanish Quarter involved the construction of a second deep 50-m shaft and an 80-m long inclined deep bored tunnel connecting to the station’s mined cross-cavern. This complex civil engineering feature alone added €37.8 million, increasing the overall station costs by a fourth.
Municipio station (€ 185.3 million)
The 1990s redesign of the central section of Line 1 identified Municipio as another main node in the city’s transit network, connecting Lines 1 and 6 to the ferry and cruise terminal (Stazione Marittima). The redesign expanded the station’s footprint and called for a full reconstruction of Piazza Municipio and the creation of a vast, fully underground mezzanine spanning more than 300 m from the station shaft to the ferry terminal. Together, these two elements added €91.3 million, almost half of the entire construction cost of the station. Copious archeological findings, such as Greek and Roman harbor structures and three boats and the foundations of the Aragonese walls of the Castel Sant’Angelo, delayed construction and forced additional redesigns of the mezzanine structure several times during construction
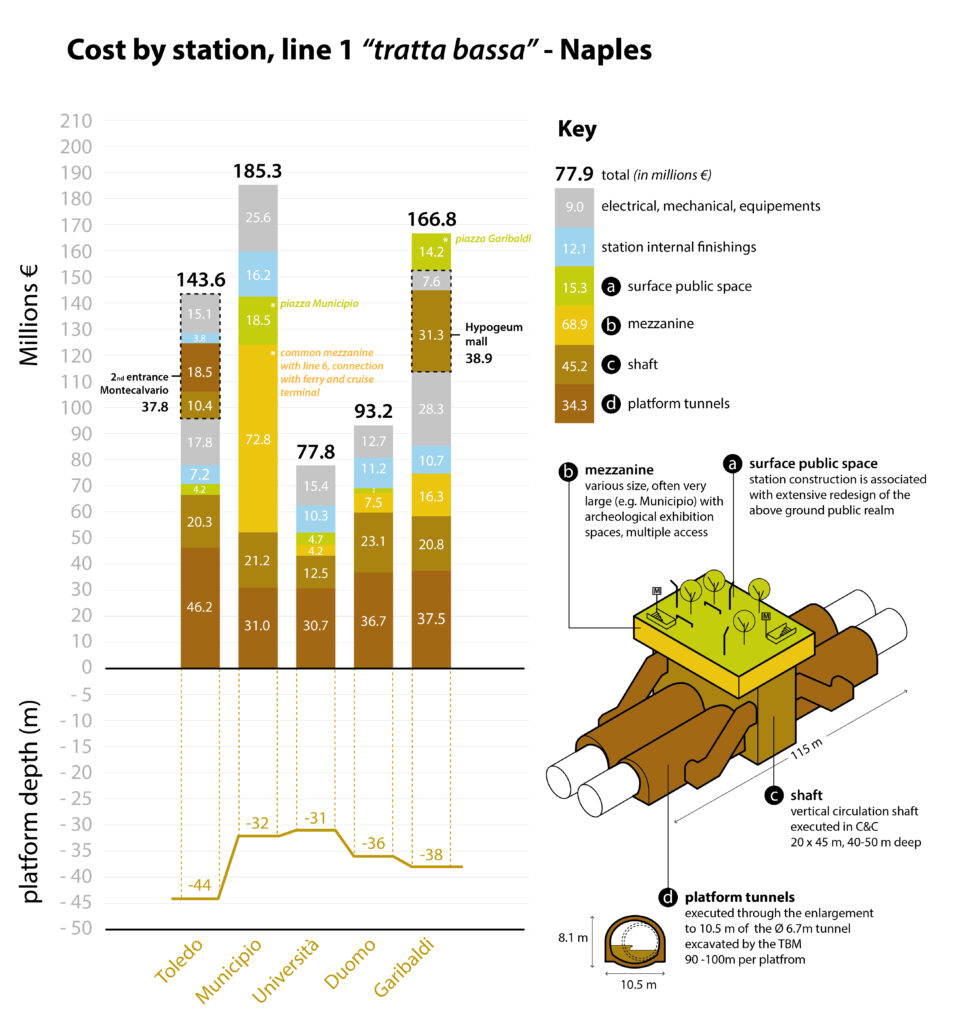
figure 41. Breakdown of station’s cost for the “tratta bassa” of Naples’s metro line 1.
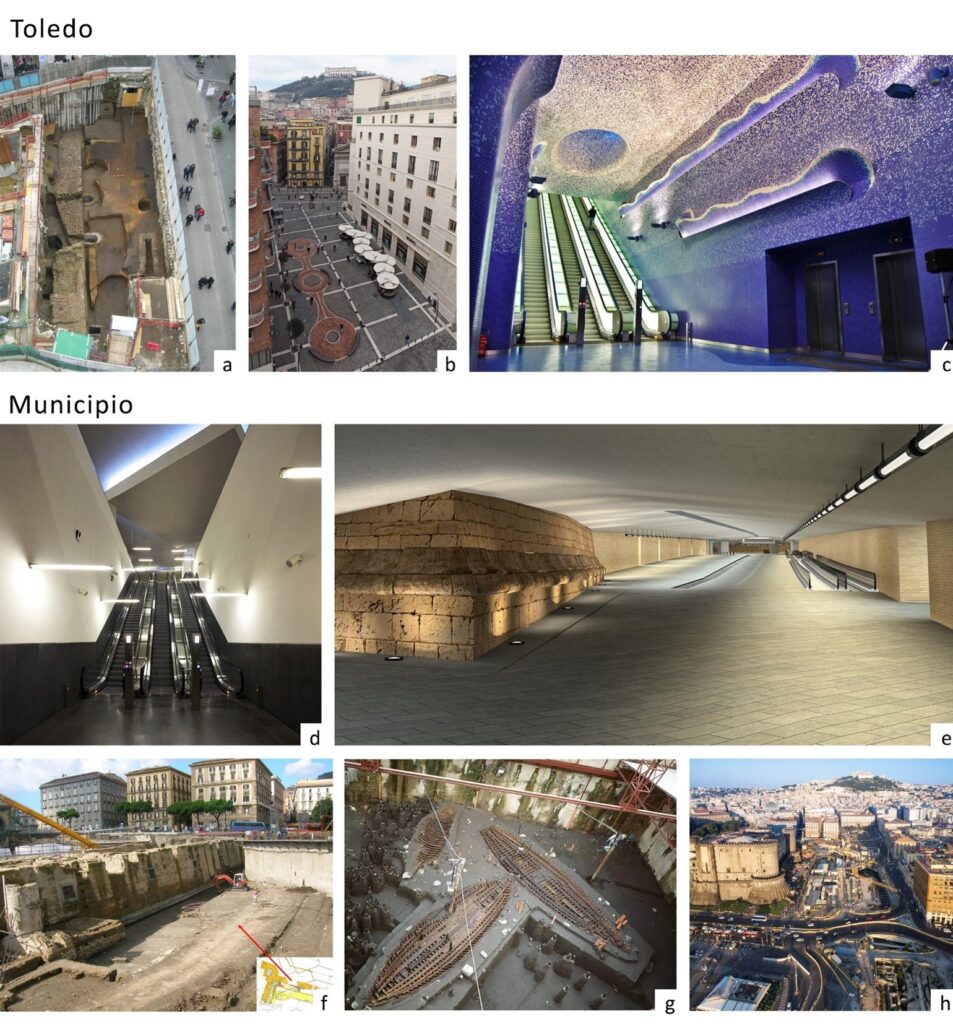
figure 42. Pictures of Toledo and Municipio stations. TOLEDO. (a) archeological excavations. (b) Public realm above the main access shaft. (c) Station’s internal design by architect Oscar Tusquets Blanca. MUNICIPIO. (d) Station’s internal design by architects Álvaro Siza and Eduardo Souto de Moura. (e) Rendering of the long corridor connecting L1 and L6 station complex to the ferry terminal. (f-g) Archaeological excavations. (h) The construction site at Piazza Municipio in 2016. Courtesy of Metropolitana di Napoli spa.
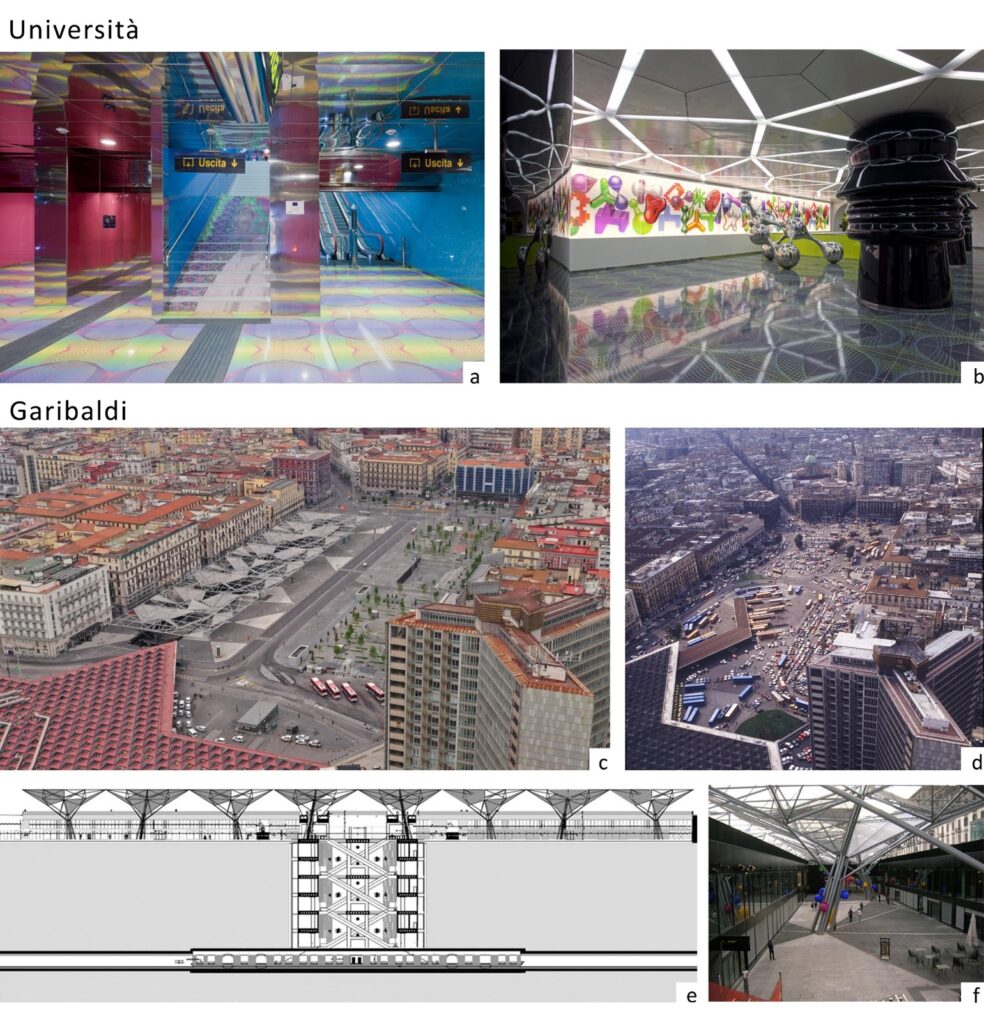
figure 43. Pictures of Università and Garibaldi stations. UNIVERSITÀ. (a-b) The station’s playful interior design by designer Karim Rashid. GARIBALDI. (c-d) Piazza Garibaldi after (c) and before (d) the extensive overhaul linked to the construction of line 1’s metro station. (e) Station’s longitudinal section across the vertical access shaft and the Hypogeum Mall, both designed by architect Dominique Perrault. (f) The Hypogeum Mall with the triangle shaped pergola. Courtesy of Metropolitana di Napoli spa.
5.8.5 Consistent cost escalation over the years
The initial cost estimate for Line 1’s 2.7-km five-station extension through the center city beyond Dante station was approximately €570 million in 1990 (see figure 44). From here, the project twisted and turned as corruption trials led to the election of a new center-left majority in 1993, which renegotiated the project costs down to €500 million.[92] By the close of millennium, however, the costs and scope had changed considerably.
The Municipal Transport Plan of 1997 sketched out a new alignment with deeper stations and a major node at Municipio. It also called for continuing the tunnels beyond Garibaldi to Centro Direzionale to allow a future extension to the airport and, ultimately, the completion of the loop. These changes in scope added €189 million or 38% to the D-B contract.
By 2007, the project’s cost had nearly doubled from €689 to €1.375 billion because of delays caused by unanticipated archeological discoveries and geological challenges. The €686 million increase broke down along two factors: first, changes in the itemized costs and quantity of inputs between 1995 and 2007 accounted for €335 of the increase, while the remaining €351 million were the result of design and construction-technique changes to adapt to the archeological findings (notably, by changing the excavation methods to the same costly two-step approach described in the Rome case), and, to a larger extent, from changes in the project scope. The decision to build bespoke showpiece stations increased costs by €143 million, and the additional utility-relocation and public realm improvement added another €52 million.
In 2014, there was a €382 million cost increase that brought the final project cost to €1.757 billion. Again, unanticipated archeological findings were partially to blame for these costs, but the other issue was that since the 1990s, technological advances had rendered obsolete design decisions regarding the signaling system.
Overall, the history of cost increases for Line 1 is illustrative of the effects of continuous changes to a project’s scope and the challenges of combining broader goals of urban renewal with a transportation project. It was unrealistic to accept the original €500 million estimate as a reasonable guide because it was based on an impossible to implement cut-and-cover approach in one of the most historically significant Italian cities. While this first order problem is clear, the project also suffered from additional scope creep, which is a well established worst practice. Part of the problem here is the exceptionally long timeline, which allowed the goals of the project to shift multiple times. On top of these two significant flaws, the structure of the Design-Build scheme was too opaque and uncompetitive to keep costs in line and the project on schedule, much like we saw in our Green Line Extension case.
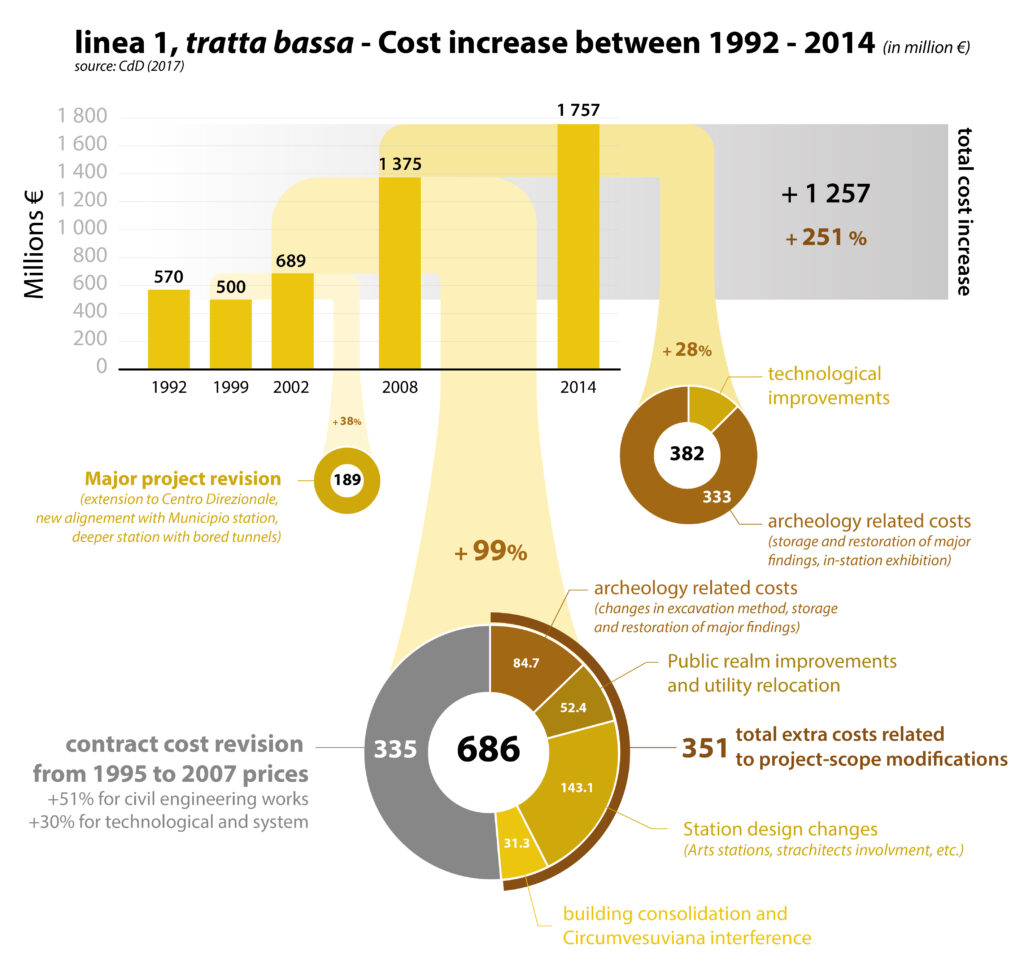
figure 44. Cost increase of the city center section between 1992 and 2014. Based on data from the Court of Auditors (CdC, 2017a).
5.8.6 The “original sin”: a flawed Design-Build scheme
Naples’s Line 1 was delivered under a Design-Built (D-B) scheme called ‘Concession of Sole Construction’ (in Italian: concessione di sola costruzione or concessione di committenza). The general protocol of a D-B delivery is that the grantor, normally a public agency, retains a design-builder to design and build an infrastructure project based on a preliminary feasibility study. The design-builder designs the project to the specifications laid out in the feasibility documents, secures approvals, and then builds it. The Concession of Sole Construction used in Naples and in other Italian projects initiated in the 1970-80s did not specify a project schedule or define a scope in advance of the agreement. The current agreement includes all future extensions of line 1 (and later line 6) for an indefinite term.
The original 1976 contract between the Municipality and the joint venture Metropolitana di Napoli S.p.a. (MN) was awarded without a public bidding. Metropolitana Milanese (MM), the public company responsible for Milan’s metro, was MN’s majority shareholder. At the time, MM was deemed the only national firm with sufficient expertise in metro construction. However, MM sold its stake two years later, in 1978. Moreover, the contract’s term and scope have been modified repeatedly since the short initial section of the Metropolitana Collinare. As a result, the procurement of new sections, including the city center and airport sections planned after the 1997 municipal transit plan have been awarded to MN through private negotiations of unit costs between the Municipality and the company rather than being bid out to all qualified bidders.
Under this framework, unit prices are set through negotiations between the granting authority and the concessionaire following periodic renegotiations and contract amendments[93] rather than competitive bidding based on the official reference unit prices that have governed other public works since the 1990s. The Court of Auditors ruled that this opaque and non-competitive D-B concession scheme had a material role in inflating the overall costs of the project. In addition, Metropolitana di Napoli is compensated for the various project-delivery tasks included in the Design-Build scheme, such as management, design, work supervision, etc., with a fixed percentage of the construction costs, that varies between 22.7% for the civil engineering structure to 8.5% for the rolling stock.[94] An even higher percentage, 30%, has been granted as compensation for dealing with the “high quality” internal finishes of the Stazioni dell’Arte.[95] This compensation structure incentivizes cost increases. Furthermore, since the term of the contract is indefinite, there are inevitable conflicts over pricing unit costs, but rather than opening up bidding to other contractors and allowing reference unit prices to discipline bids, these changes are negotiated privately. The Court of Auditors estimates that the €335 million increase in unit costs negotiated through this method following the 1995 amendment of the contract represent an excessive increase, outperforming the average sectorial inflation in the 1995-2007 period by at least six to eight percentage points.
Disentangling costs scrupulously in Naples is a challenge because the opaque delivery mechanism and the lack of competition and public oversight makes it difficult to estimate the magnitude of these “original sins” on the final costs. Without question, it has been one of several factors that makes Naples’s Line 1 the most expensive metro segment ever built in Italy.
5.8.7 Gigantism, archeology, uncompetitive bidding, lack of public oversight: the “perfect storm”
The case of Naples Line 1[96] highlights several factors that can drive construction costs upward dramatically, even in the context of a country that has otherwise put in place effective mechanisms to moderate construction costs. The challenging environmental conditions of the city’s old core, with its high densities, layered history, poor geology, and brackish subterranean waters represent a difficult environment that contributes significantly to increase the technical complexity of excavation and drives costs. Yet, the choice to link the construction of the metro line with an extensive redesign of the public domain and the construction of the glamorous Art Stations designed by renowned starchitects was entirely the choice of political leaders. The city-center section’s high station costs are the result of the excavation technique (freezing, consolidation, etc.) prompted by geological considerations and the desire to minimize disruption of the archeological layers. But also, to a large extent, to the broad scope of using the construction of Line 1 as a catalyst for urban redevelopment by the city’s political leaders, as Municipio’s large mezzanine, Garibaldi’s hypogeum mall and Toledo’s second entrance and public realm improvements highlights.
As in Rome’s case, the rich archeological strata that lies under the city’s streets have been a major driver of costs. Indirectly, because the rigid regulatory framework for heritage protection and the unchallenged veto power held by archeological authorities resulted in conservative design decisions, notably about the tunnel alignment and depth, and about the station’s construction techniques that contributed to record-breaking costs. Directly, by adding €266 million to the budget for excavation, removal, storage, restoration and the display of findings, notably the Isolympic temple unearthed at Duomo station and the Aragonese walls and Roman boats discovered at Municipio.
In addition to the environmental conditions and deliberate political choices, the D-B delivery mechanism of the Concession of Sole Construction weakened the contracting authority’s oversight capacity and incentivized the concessionaire to add scope and increase costs to reap larger fees.
The case of Naples’ Line 1 city-center section shows that its high costs were the product of difficult conditions, poor geology for metro construction and a dense urban environment, and self-inflicted wounds, poor project delivery and management and attaching too many goals to a single infrastructure project. In short, no matter what, Line 1 would have been relatively expensive because of unavoidable challenges, but those challenges were exacerbated by poor decision making.
[1] The contract has been amended 8 times since 1976, but the general structure of the concession scheme remains unchanged, while the unit cost have been reviewed times and again.
[2] CdC (2017a), page 70, table 8.
[3] CdC (2017a), page 64.
[4] Similar problems have plagued the construction of line 6, that we do not cover in detail in this report for a matter of space and simplicity.
5.9 Nine Takeaways
What do the Italian cases teach us about the drivers of construction costs? It is a common refrain in the mega-project domain to say: “once you have done one project, you have done…one project,” meaning that the complexity and specificity of each context doesn’t offer lessons that can be easily generalized. It is true that every project has its own characteristics, and it can be risky to generalize findings and lessons into an easy-to-apply list of Dos and Don’ts of transit-infrastructure projects. Nevertheless, we believe that by reconstructing the historic development of construction costs and detailing the institutional framework in Italy over several decades, together with the four cases of Turin, Milan, Rome and Naples, there are several valuable lessons for achieving a more cost-effective delivery of rail transit infrastructure.
The nine takeaways derived from the cases in this report are meant to help planners, policymakers, and the public better understand and tackle the drivers of construction costs.
1. Delivery method matters, but the devil is in the details rather than ideology
The cases feature delivery schemes ranging from General Contractor, PPP concession, traditional Design-Bid-Build, and DBFOM concession. Despite the different labels, Italian legislators who studied project delivery in both the 1994 and 2016 reform found that what really matters is the level of oversight public agencies have over fundamental tasks such as early planning, design, as well as project and construction management. Contracting authorities with sufficient in-house capacity, like Milan’s Metropolitana Milanese and Turin’s InfraTO, are able to implement the more traditional Design-Bid-Build (preferred in Turin and normally used in Milan too) but also to effectively guide projects procured under various PPP structures (like the ones used for M4 and M5), which were set up to limit the public’s ability to exercise effective technical oversight. To ensure that the public can manage projects effectively, key techno-managerial roles need to be enshrined in law such as the RUP project manager position, the DL (work supervision) and the AS (high supervision) detailed in section 3.2. The fact that the most successful contracting agencies are essentially staffed by technical professionals, mostly civil engineers, geologists and architects and almost never managers, suggests that empowering technical experts to manage and supervise are a key to building and nurturing reliable, competent and stable in-house expertise.
2. Level of design for the RFP: the more detail, the better
Regardless of the delivery method, it is critical that contracting authorities publish RFPs based on detailed designs to reduce risks and limit cost escalation. In order to evaluate cost estimates effectively, it is necessary to have a detailed final project, especially when considering geological and archeological risks, two key contributors to change orders during construction. As we saw in Rome’s case, the different outcomes in terms of absolute costs and cost increases between section T4-T5 and T3 of MC, both contracted out within the same General Contractor’s RFP, but based on different levels of design, are linked to the different level of design detail. The transfer of risk implied in PPP schemes, upon which a greater involvement of the private sector is often justified, seems to work more in theory than in reality, especially if the RFP lacks sufficient detail. In general, going into the bidding process with a design that addresses all the possible sources of uncertainty provides a better opportunity to assess risks and divide them between the agency and contractor equitably.
3. A winning trio: Official unit-price lists, itemized unit-price contracts and best-value-for-money scoring of bids
Functioning markets need symmetrical and transparent access to information, especially information about key inputs. Italian legislation on public procurements developed over the last three decades, in the aftermath of a national corruption scandal, shows that the “winning trio” of official unit-price lists, itemized unit-price contracts and best-value-for-money scoring of bids has proven to be a successful recipe for more transparent public-procurement markets. Regional official unit-price lists (Prezziari Regionali delle Opere Pubbliche) are both a tool that provides public authorities with a guide to anticipating how much goods and services cost and a way of disciplining contractors’ behavior. Itemized unit-price contracts, unlike lump sum contracts, show exactly how costs change when scope or schedule is adjusted. Best-Value-for-Money scoring of bids (regola dell’offerta economicamente più vantaggiosa) improves the quality of bidders and proposals by de-emphasizing the need beat out the competition solely on cost (or even sanctioning it with exclusion, thanks to the so-called “rule of the anomalous offer”), while emphasizing the technical quality of offers. Naples’s ill-conceived Design-Build concession scheme, based on privately negotiated itemized costs and insufficient pre-bid design, resulted in inflated prices and a general lack of transparency and competition. Finally, as some interviewed experts and officials have stated, the official unit-price lists are also an effective tool to counter the growing concentration of large conglomerates that play in the international infrastructure market.
4. A balance between in-house technical capacity and outsourced design, and how to achieve it
By examining cases in four cities, we saw different degrees of in-house capacity and varying ways this capacity was mobilized in the planning and delivery process. In Milan’s case, the municipal engineering firm Metropolitana Milanese has been able to develop its world-class expertise in metro construction because of continuous support from the municipal government to maintain strong in-house capacity in the context of a shrinking public sector, privatization, and international competition. Given Milan’s relatively low construction costs in spite of growing private involvement in more recent projects, MM is a blueprint for cities or states engaged in large infrastructure projects that seek to cultivate and maintain technical capacity within the public administration. Turin’s InfraTO offers another approach to in-house design and technical capacity. InfraTO outsources large parts of the design work due to its much smaller staffing and a lower project output compared to MM, but it does so in a frame of strong in-house technical supervision and continuous non-adversarial collaboration with consultants, something that we also see in our Istanbul case. The InfraTo approach is effective and demonstrates that smaller cities and agencies can achieve similar outcomes to larger, better staffed organizations if properly staffed. In particular, these cases suggest that it’s crucial to maintain a strong technical in-house capacity to steer the early planning, design and engineering choices setting the parameters of the project, while downstream detailed engineering and design, which is labor-intensive and more technical, requires fewer choices that explode costs, can be delegated to private firms. Finally, the case of Roma Metropolitane, which on paper is similar to MM and InfraTO, shows how political uncertainty to transit expansion and agency oversight powers, notably through the imposition of the GC delivery formula for political reasons, can reduce the effectiveness of in-house technical capacity.
5. Technical requirements: how specific do they have to be?
Tighter standards and regulations are a major driver of costs. The constant change in standards and regulations about excavated soil classification, fire proofing, seismic standards has triggered costly change orders on several projects. Standards intended to protect archeology and monuments represent one of the largest constraints in the Italian case. The cases of Naples and Rome illustrate plainly the consequences of strict heritage regulations on design choices and, ultimately, on costs. Moreover, even if Italy does not use NFPA 130 as its fire safety standard, but instead a set of local norms established through ministerial technical committees based on EU recommendations, the new standards approved in 2015 will have impacts that are yet to be visible in current projects. In general, technical requirements that on paper look like necessary and savvy improvements, are rarely evaluated by the legislator or the industry from a genuine benefit/cost perspective and are often taken for granted. At the same time the Italian case offers some insight into possible technical approaches to reduce the impact of tighter standards: for example, the complete separation of platforms and tunnels in the new automated metros reduces the need for costly ventilation infrastructure that is common in other cities, such as in New York. Furthermore, new archeological protocols established after 2008-10 in Rome and Naples, shifting from a reactive to a proactive approach to archeological screening, will possibly reduce, if not the upfront costs, at least the delays and cost overruns due to archeological surprises in future city-center projects.
6. Political hesitancy, difficult funding, cumbersome bureaucracy
Political intervention, micro-management, and uncertainty all have a negative impact on costs. Large infrastructure projects require enormous upfront preparation and coordination among multiple actors. Well intended political meddling, especially when it affects the project scope or schedule by adopting more restrictive work conditions, something we also saw clearly in our New York case, will inevitably impact costs. At the same time the inability to commit to a project or the avoidance of contentious decisions also increases costs by adding time to the design, redesign, and process of gaining approvals and support, all of which stymies the construction process and opens the contracting authority up to litigation from disgruntled contractors.
7. Greater public awareness about costs and transparency matters
The Italian case shows that an increased awareness among the general public and policymakers about the problem of rising costs, corruption, and waste-prone practices is the first step to build the consensus needed to address complex and entangled problems and enact reforms that establish public confidence and curb escalating costs. Based on our review of official reports and interviews with officials and public works experts, there is consensus that better procurement practices and effective oversight authorities, stemming from the public works reforms started in 1994, have contributed to reduce waste and weed out corruption and abusive practices relative to the 1980s and reduce construction costs.
8. The longer, the better
Cutting projects into shorter sections to make them more financially palatable in the short run ends up increasing the overall costs in at least four different ways: First, by making economies of scale more difficult to achieve; second, by reproducing expensive construction staging and operational requirements; third, by hindering the learning curve of both management and contractors that is typical of all large-scale complex projects like metro construction, and, fourth, by introducing potential delays that slow down approvals and trigger cost escalations.
9. Industrial sector expertise
As a final takeaway, the Italian case points more broadly to the importance of national policy nurturing the development of a construction sector with diverse and broad expertise that can be applied to metro construction. Expertise in tunnel building and design, in particular, stand out as being critical to building underground metros at a relatively low cost. Even though our study doesn’t allow us to make any definitive conclusion on that claim, some hints, such as a greater use of prefabrication in construction, which is possibly one of the reasons for a lower incidence of labor costs on hard costs, might suggest that the construction sector in Italy is more “advanced” thanks to a greater capacity built over time. Similar observations can be extended to other countries with low construction costs, such as Spain, Switzerland, Turkey, and Austria. Countries that develop domestic expertise that can adapt solutions to specific constraints, such as geology, and catalyze cost-saving innovations through new techniques will achieve greater efficiency and build transit-infrastructure faster, cheaper, and better than nations that rely solely on importing expertise and consultants.
[1] This data is derived from our own database that can be retrieved at transitcosts.com
[2]A total of 24 interviews has been conducted between November 2020 and April 2022.
[3] The Maastricht treaty (1993), that institutes the single currency, required that the EU countries that wanted to join the monetary union needed to have a public deficit lower than 3% of their GDP and a shrinking public debt tending to 60% of GDP or lower. In 1993, the deficit/GDP ratio was 10% and the debt/GDP one at 115%
[4] Spinosa (2019), processing data from transit agencies for 2019.
[5] For older projects in Milan, data come from the 1959, 1970, and 1975 budgets published by Metropolitana Milanese. For Rome’s lines MA and MB, data come from several appropriation laws (1145/1959, 285/1968, 82/1970, 396/1971, 374/1974, 19/1978, and 19/1978) that have financed the early developments. Costs for projects realized after the mid-1990s are mostly derived from the House of Deputies official database of infrastructure projects (SILOS, 2021), and the official report of the Court of Auditors (Corte dei Conti – CdC) tracing the spending linked to the 211/92 transit fund law (CdC, 2017b).
[6] See among others: Calise (2021).
[7] Since 2016, RFPs for public works must explicitly state the incidence of labor on the overall hard costs.
[8] The terms of the national Contract of Construction workers can be consulted here: https://www.filleacgil.net/edilizia/15155-industria.html
[9] SIG, Società Italiana Gallerie: http://www.societaitalianagallerie.it/notizia/1551/presentazione/
[10] The Regional level of government comprises 15 Ordinary Regions, 4 Regions with Special Statute (Sicily, Sardinia, Valle d’Aosta and Friuli Venezia Giulia) and 2 Autonomous Provinces (Bolzano/Bozen and Trento). This level corresponds, to a certain extent, to States in the US (albeit with less autonomy) and Régions in France.
[11] Until 2015, there were two sub-Regional levels of elective government: Provinces (that correspond roughly to the County level in the US and Départments in France) and Municipalities. Since 2015, Provincial governments have been de facto abolished and their responsibilities have been uploaded to Regions or, for the 14 largest urban areas, to newly established Metropolitan Cities, whose executive council is composed by the mayors of the member municipalities and is normally led by the mayor of the largest city.
[12] Funds are allocated by regions through a 5-year program called POR-FESR.
[13] Calise (2021).
[14] Italy does not have a single national framework defining participatory processes, unlike, for example, the Débat Public process in France. Some Regions have their own legislation that defines the forms and limits of public participation. Cities may have their own bodies devoted to participatory practices.
[15] In particular, early design includes preliminary geological and hydrological investigations, archeological pre-scoping (evaluation of the archeological risk), and environmental components assessment (air, soil and water pollutant, noise, vibrations, etc.).
[16] Actual approval processes might vary depending on Regions, as many matters have been regionalized and are thus subjects to slightly different local legislations and procedures, albeit with a general common national framework.
[17] As we will see in the case of Rome’s MC, this is a recipe for a hard to manage conflict of interest, as the General Contractor is, at the same time, the controller and the controlled.
[18]Palma (1972).
[19] This law was only amended in 1970 and the first government contributions to metro construction arrived only during the late 1970s with ad hoc legislation.
[20]Minici (2018).
[21] Notably: laws 1145/1959, 285/1968, 82/1970, 396/1971, 374/1974, and 19/1978.
[22] Calise (2021).
[23] Mai (2009); Metropolitana Milanese spa (1980); Minici (2018).
[24] A detailed account of appropriations and spending related to the 211/92 law is available in a report published by the Court of Auditors – Corte dei Conti (CdC, 2017b).
[25] For more detail about the problems of law 443/01 see: Beria (2007).
[26] Regio Decreto 350/1895.
[27] The I.R.I. – Istituto per la Ricostruzione Industriale (Institute for the Industrial Reconstruction) was established in the 1930s after the nationalization of several large industries, insurances and banks bankrupted by the Great Recession.
[28] Calise (2021); CdC (2017a).
[29] Article 9: “The Republic promotes the development of culture and of scientific and technical research. It safeguards natural landscape and the historical and artistic heritage of the Nation.”
[30] Notably, the 1089/1939 (heritage and archeology), the “Galasso law” 431/1985 (landscape) and the following Dlgs. 42/2004, establishing an organic Code for the protection of Heritage and Landscape (Codice dei Beni Culturali e del Paesaggio).
[31] The first attempts to introduce itemized costs in public works was done in the early 1970s (law 14/1973) as a way to promote procurement practices based on unit prices instead of lump sum contracts. It had a limited impact because it left to each contracting agency the burden of elaboration its own reference lists and deciding how to apply it. The obligation for contracting agencies to devise their own reference price lists was first introduced with the so-called “Merloni” reform (law 109/1994), but only slowly implemented over time as the law left undefined how to technically elaborate those reference prices. With the devolution of many legislative matters to regions after 2001 and further refinements of the public works law in 2006 and 2010, the competence for the definition of the official reference price lists was finally transferred to Regions and the regional Prezziari has become the official reference for bidding prices in public works. Nevertheless, large agencies like RFI and ANAS, which had strong in-house engineering and design capacity, implemented them already starting from the mid-1990s.
[32] The so-called “concorso-appalto” or a form of RFP procedure involving a shortlisting process.
[33] article 26, law n. 109/1994
[34] article 133, Legislative Decree n. 163, 12 april 2006
[35] Regional Governments are not the only ones determining official list. Major national agencies involved in large public works, like RFI (national rail network manager), ANAS (national road agency), or even local transit agencies with specific needs (for example, Turin’s GTT and Milan’s ATM for tramway equipment construction and maintenance) have their own Prezziari that are fully elaborated in-house based on a consolidated experience.
[36] Since 2018, the threshold has been lowered to 8%.
[37] See for example: https://la.curbed.com/2017/1/27/14416120/metro-purple-line-contractor-tutor-perini
[38] The threshold for lump sum contracts varies depending on the type of works, but lump sum contracts are limited to small public works.
[39] Those thresholds are set by EU regulations, and they vary depending on the sector of public procurement and its relevance for the common market, as all bidding process higher than a certain value must be open to all EU contractors.
[40] For example, see the DPR 207/2010 and the D.Lgs. 50/2016
[41]Those numbers are mostly derived from interviews with officials and sectorial publications.
[42]There are several minor and a few major inconsistencies between projects that depends on how different elements are accounted for in the documents. The major inconsistencies that result in more pronounced differences will be treated in greater detail in each project’s specific chapter.
[43] Milan’s M4 has not been included in this evaluation as only the cumulative cost of all the open-air civil works, which includes stations and the storage, operation and maintenance facility, has been provided by the agency.
[44] Historic cores are defined as the area comprised within the widest walled area a city covered in its history.
[45] The coefficient of correlation is +0.60 for light metros (n=46) and +0.64 for heavy metros (n=35).
[46] The gross volume metric used in this comparison should be taken as an indicative metric of a station’s scale, not the effective volume of excavation. Station’s volumes have been calculated using station’s major dimensions from project’s drawings. For stations not completely excavated from above, a “theoretical’ volume (footprint on the surface multiplied by the depth) has been used instead. Depth = tracks depth from the surface plus 4 meters, to account for the bottom slab.
[47] As the first capital city of Italy, Turin was selected as the main venue for the celebration of the 150th anniversary of the Italian Unification of 1861.
[48] Ansaldobreda’s steel-on-steel light metro was under development at the time and going to be deployed in Copenhagen.
[49] See: https://www.infrato.it/the-company/
[50] The reconstruction of Corso Francia wasn’t part of the M1 capital budget but was paid for directly by the city.
[51] According to numbers derived from cost estimations for line M2, the jet grouting injection for water proofing of a station’s bottom can add up to € 2-3 million to the overall cost.
[52] For the importance of the role of the R.U.P. (Responsabile Unico del Progetto) as the chief manager and the figure that insulate the technical team from political interference see chapter 3.2.
[53] Bernard Kohn et associés: https://www.bernardkohn.org/fr/architecte/projets/ligne-1-metro-turin.html
[54] As one responded pointed out, the RUP carried out its role of High Supervision in a very proactive manner, participating in all the important decisions taken during construction throughout the different phases of the project.
[54] As a comparison: Los Angeles purple and red lines (heavy metro) have a ridership per km of 4,600, while the LRT lines have 1,100; Atlanta’s MARTA (heavy metro) has 2,700; Seattle’s light rail has 2,450 (Spieler 2021).
[55] Siemens, that purchased the VAL patent from Matra in the late 1990s, has discontinued the commercialization of the VAL 208 in the 2000s, replacing it with an incompatible system called Neo-VAL.
[56] Ridership data are from Spinosa (2019).
[57] Most pre-1990s data are from Metropolitana Milanese spa’s fact sheets and reports published as part of the company’s budgets and reports to the shareholders. The high volatility of the Italian Lira from the late 1960s through most of the 1970s, with double digit inflation rate topping at 20% annually, makes accurate actualization difficult for projects that last over several years.
[58] That number is derived from various non-official sources, all of them referring to an original 1992 investigation carried out in the frame of the Tangentopoli scandal. Unfortunately, it has been impossible to retrieve the original source.
[59] Cost estimates for the 3.6km, 3 station extension of M1 to Baggio, that is currently in final design, are derived from the detailed estimations made for the final (90%) design and publicly accessible bidding documents.
[60] See : https://www.mmspa.eu/wps/portal/mmspa/en/home/the-company/who-we-are
[66] See : MM Spa, Bilancio d’Esercizio 2020
[62] Spinosa (2019).
[63] Zara station was built using ADECO-NATM for platforms in a space adjacent to the existing mezzanine of M3 metro station that ensure seamless transfer within faregate area.
[64] Tre Torri station was built as part of the City Life redevelopment scheme and it’s directly accessible from a sunken pedestrian plaza at the center of the area.
[65] ADECO is a tunneling method for incoherent soils developed mostly in Italy since the 1990s that involves a continuous monitoring of the excavation front combined with a targeted consolidation of it using various types of jet-grouting or freezing techniques in water rich soils. See for example: https://www.rocksoil.com/documents/ADECO_english.pdf
[66] For more details, see also
[67] M5 factsheet: http://allegati.comune.milano.it/trasportiambiente/SportelloUnicoMobilita/LINEAM5.pdf
[68] The full concession contract is accessible here: https://www.metro4milano.it/wordpress/wp-content/uploads/2016/09/Testo-Convenzione-di-Concessione.pdf
[69] For the value of the IRR see: https://www.metro4milano.it/la-giunta-approva-delibera-per-m4-si-tratta-di-un-provvedimento-necessario-per-la-realizzazione-dell-opera/
[70] Spinosa (2019).
[71] For a complete reconstruction of Rome’s line A history see: Palma (1972).
[72] RM (2021b).
[73] Detailed construction costs have been provided by Roma Metropolitane.
[74] This is somehow a misuse of the established accounting principles that has been sanctioned by both the Court od Auditors and the ANAC, since the extra claims made by the contractors using the riserve system should not be settled before the end of the contract the way it has been done with an extracontractual transaction in 2012.
[76] That amount does not include the preventive archeological excavations and the preparatory studies that are accounted for in the soft costs borne by the General Contractor, that is estimated at around €7 million.
[77] Station volume has been calculated using design drawings provided by Roma Metropolitane and simplifying more complex station layouts as simpler equivalent parallelepiped.
[78] For a complete description of the technical details of the station redesign, see RM (2021a)
[79] Eventually, the street has been closed to private traffic in 2015, while the station was already under construction.
[80]The two TBMs used on segment T3 took approximately 520 days each to dig 2.65 km of tunnel each, with an average of 5 m per day including stops. The same two TBMs were used for section T4-T5 and T6a, digging approximately 9.5 km each in 540 days, an average of approximately 18 m/day.
[81] M4 offers a similar example: the political will to anticipate the opening of a section, mostly for electoral reasons, is a factors that influence negatively the optimal workflow and add costs because of special provisions such as doubling testing and commissioning operations.
[82] For a more detailed explanation of this particular excavation technique, see RM (2019).
[83] The extra costs claimed by the contractor through the “riserve” system (see chapter 3.7) were awarded
[84] (ANAC, 2015; CdC, 2011)
[85] According to the law, however, as spelled out by the ANAC and the Court of Auditors, compensable claims should be settled only after construction has concluded. This poses severe cashflow problems for a DB contract with no clear timeline.
[86] Unlike Metropolitana Milanese, which is only the technical in-house consultant of the city of Milan, which remains the contracting authority for metro projects, Roma Metropolitane, and not the city of Rome, is legally the contracting authority of MC and thus RM is directly financially and legally exposed for compensable claims pursuits. This flaw in the juridical arrangement has put RM is a precarious situation with a clear solution to the risk of bankruptcy not yet reached.
[87] (ANAC, 2015); CdC (2011).
[88] For an exhaustive reconstruction of the complex history of line 1’s funding, see Roberto Calise’s “la metropolitana Europea” (Calise, 2021).
[89] The reasons for that choice are multiple and not all linked to NYMBYs opposition to a cut & cover shallow alignment: the ‘hook’ necessary to reach the future Municipio transit hub (lines 1,6, ferries) envisioned in the 1997, the political will to give direct access to the metro to the disadvantaged communities living in the extremely dense Spanish Quarters, and the hard-to-estimate archeological risk connected with extensive shallow excavation in a multi-layered historical city are all reasons behind that costlier design choice.
[90] For a complete description of the station engineering and excavation techniques see Lunardi, Cassani, and De Giudici (2008, Italian) and Mandolini and Viggiani (2017, English).
[91] The idea of the metro as a Museo Obbligatorio (i.e., compulsory museum) has been associated to the Stazioni dell’Arte Program by its creator, the art critic Achille Bonito Oliva.
[92] See the acts of the parliamentary commission (CD, 2009), and Calise (2021, pp. 72-73). In 1992, a new electoral law for municipalities, that give more leverage to the mayor vis-à-vis the municipal council, empowered a new generation of politically active and progressive mayors in large cities, a political season that came to be known as “the mayors’ spring.”
[93] The contract has been amended 8 times since 1976, but the general structure of the concession scheme remains unchanged, while the unit cost have been reviewed times and again.
[94] CdC (2017a), page 70, table 8.
[95] CdC (2017a), page 64.
[96]Similar problems have plagued the construction of line 6, that we do not cover in detail in this report for a matter of space and simplicity.
The Sweden Case
6.1 Introduction
Stockholm County is a region of 2.5 million people. Despite its modest size, it has one of Europe’s busiest urban rail networks: in 2019, on the eve of the corona crisis, the 104 km Stockholm Metro (Tunnelbana or T-bana) network carried 1,265,900 riders on an average weekday and including the region’s commuter and light rail networks the system carried 1,892,300, representing comparable ridership per capita to large, established European transit cities like Paris and Berlin. The modal split for all trips in 2019 was 40% car, 30% public transport, 28% biking and walking (SL Annual Report 2019), representing one of the highest shares for public transport in Europe. The system is currently in the middle of a large expansion wave: the commuter rail tunnel Citybana opened in 2016 and the system is currently carrying 410,300 passengers a day, while the T-bana is currently building about 19 kilometers’ worth of extensions, collectively called Nya Tunnelbanan.
The urban rail expansion program in Stockholm is an instructive case. The construction costs remain fairly low. Citybanan cost SEK 16.8 billion in 2007 terms, or about $2.4 billion in 2020 purchasing power parity (PPP) terms, averaging $320 million/kilometer; this is slightly more expensive than the global median, but Citybanan was an unusually complex project, built entirely underneath city center, with two large station caverns mined under older T-bana platforms. Nya Tunnelbanan is currently projected to cost SEK 32 billion, about $190 million/km, well under the global median. Alongside the other Nordic countries and perhaps Switzerland, Sweden is the only country among the world’s very wealthiest with construction costs this low: other low-cost countries such as those detailed in the reports about Italy and Turkey are on the economic periphery of the developed world.
The quality of in-house designs under the civil service system is high. The Swedish Traffic Administration, or Trafikverket, has a generations-long tradition of apolitical engineering, and decisions about the construction of small road projects are undertaken on the basis of benefit-cost analysis. Rail megaprojects like Citybanan and Nya Tunnelbanan cannot be so reduced – they cost so much that the elected national government must approve the final plans, and yet it has not politicized those plans. The in-house expertise of Trafikverket cascades down to the regional level and incorporates a procurement strategy that centers public-sector expertise; designs are traditionally done by the public sector, with the assistance of private consulting firms, and are subsequently owned publicly and bid out to private construction firms.
And yet, there is danger that the low Nordic costs are rising. Nya Tunnelbanan has had a large cost overrun, from SEK 23 to 32 billion. The cost of Helsinki’s West Metro (or Länsimetro), opened 2017, was only $130 million/km in 2020 terms, but this was more than double the cost when the project was approved in 2007, and the second phase of the West Metro is costing $230 million/km. Oslo’s under-construction Fornebubanen with its deep-mined stations is projected to cost $300 million/km (2020 PPP terms), triple the cost of Lørenbanen, which opened 2016.
Moreover, the Nordic civil service is showing long-term interest in changes in procurement in a direction more akin to what is found in the English-speaking world. Academic and gray literature within the Nordic world, and not just Sweden, speaks favorably of reforms that reduce public-sector involvement; Trafikverket’s new strategy is that it should become “a pure client” and implement a system that centers private-sector expertise and innovation.
The long-term changes are unlikely to be positive. The one-time increase in cost of Nya Tunnelbanan appears permanent: future metro expansion is likely to have similar per-km cost to Nya Tunnelbanan, Fornebubanen, and the second phase of the West Metro, rather than to the original budget for Nya Tunnelbanan or the actual cost of Lørenbanen or the first phase of the West Metro. The English-speaking world has high construction costs, and yet the academic and gray literature out of the Nordic world looks up to it and ignores low-cost construction within Southern Europe, which Northern Europe looks down on.
Nonetheless, construction costs in Sweden, Norway, and Finland, remain well below the world average; nowhere else in Northern Europe are construction costs so low save perhaps Switzerland, and costs in Germany, the Netherlands, and the United Kingdom are a multiple of those of Sweden.
6.2 Sweden and the Nordic Region
The Nordic countries are expanding their urban and intercity rail offerings, including metro extensions in their capitals, investments in regional rail, and intercity rail that in some cases includes high-speed rail.
Those countries are institutionally similar: their legal and political systems are all similar to one another, and they make efforts to learn from one another. Nordic or Scandinavian law is based on collaboration among Denmark, Sweden, and Norway going back to the 1880s, with Finland joining after independence in 1917; Nordic contract law was harmonized in 1915 (Bernitz 2007), and when reforms were needed in the late 20th century, they largely happened in parallel across all Nordic states. In comparative law, Nordic law is treated as a primary global category, alongside French civil law, German civil law, and English common law (Siems 2022).
Politically, too, there are strong parallels among the four mainland Nordic states, and early intergovernmental cooperation under the Nordic Council. The party systems in Sweden, Norway, and Denmark are similar, and to some extent so are those of Finland and Iceland, with extensive ties between each Nordic party and its counterparts in other Nordic states.
It is common in each Nordic country to compare its performance on topical issues to the other Nordic states. For examples:
- Norwegian politicians comment on immigration to Denmark (Moe and Kagge 2021) and the media comments on immigration to Sweden (Andreassen 2014).
- Critiques of education in Sweden heavily employ comparisons to Finland with its higher PISA test scores – see for example Boman (2022) but also multiple personal conversations with Swedes in academia and political advocacy.
- Sweden’s approach to corona drew comparisons to the rest of the Nordic world above all; within Sweden, defenders of the approach, including public health chief Anders Tegnell, compared Sweden’s death toll with that of the United States or the European average, in which case Sweden would come out above average, whereas critics would compare it with that of Norway, Denmark, and Finland, all of which had far lower death rates.
Diplomatically, there is greater divergence – Norway and Iceland are not in the EU, and Sweden and Finland had no interest in joining NATO until the Russian invasion of Ukraine – but there is enough of a concept of Nordicity that all five Nordic states built their post-unification embassies to Germany in the same complex.
The concept of Nordicity applies throughout the social, economic, and political spheres, and so it should not be a surprise that public transport planning follows similar broad trend across Scandinavia. In the interviews we have conducted with Norwegian and Finnish planners, their descriptions of project procurement, management, and construction techniques are similar to the ones we have in Sweden. Therefore, we expect that this report has bearing not just on the case study from Stockholm but also on how the rest of Scandinavia engages in planning.
The similarities across Scandinavia also lead to extensive comparisons between the different Nordic countries, focusing on differences between them. The academic literature compares the impact of benefit-cost analysis in Sweden and in Norway, finding it is much more significant in Sweden (Eliasson et al. 2015). Other examples may compare countries with non-Nordic countries, but usually several Nordic countries will be included as well, for example in the Finnish Ministry of Transport’s review of rail transport in Finland (Ministry of Transport and Communications 2003) or in Smith et al. (2018) on Mobility as a Service developments.
Although the social context of metro rail investment across Scandinavia is parallel, many of the physical characteristics of public transport across the four main Nordic capitals (omitting Reykjavík as it is far smaller) differ, as do their histories:
- Stockholm has a metro system consisting on three lines (Red, Blue, and Green) each with two to three branches; it has removed its historic tram network, converting some lines to metro branches. Its metro system has always been supplemented by various commuter rail lines, of which those using mainline rail service are called Pendeltåg and those operating as isolated systems, generally connecting to an outlying metro station, are called Lokalbana if longer-distance or Spårväg or tram is shorter-distance. The Pendeltåg system ran through the same two-track tunnel through Central Stockholm until Citybanan opened, giving it a dedicated tunnel to permit for more commuter rail as well as longer-distance regional and intercity rail capacity.
- Copenhagen has a metro system with two main lines with branches, of which one forms a circle, but the system only opened in 2002, later than in nearly all other European cities of comparable size. The Copenhagen Metro is driverless and runs short trains at high frequency, as is common in some smaller Italian cities. In contrast, Copenhagen has long had a dedicated commuter rail tunnel, opening in 1917 and running high-frequency urban electric rail service since 1934 under the name S-tog, borrowed from the German S-Bahn. The city also makes extensive use of bikes: within the city proper, consisting of about a quarter of the metro area, bikes have a 62% modal split (City of Copenhagen 2019).
- Helsinki has a metro system consisting of one line branching in two in the east, together with a large urban tramway network and a regional rail system running from suburbs and secondary cities to the north of Helsinki to a stub-end city center terminal. The region is expanding all three modes, with a western extension of the metro (West Metro), a large expansion program for the tramways, and a proposed loop tunnel under city center to permit commuter trains to run in and out without reversing direction.
- Oslo combines a subway system, a tramway network, and commuter rail, like Helsinki. Its subway system consists of a Common Tunnel with four to five branches on each side, generally on the surface but with some tunneled urban sections. Its commuter rail system has a common trunk carrying mostly commuter traffic but also some longer-distance trains and is oriented toward farther-away suburbs than in the other Nordic capitals.
Despite the differences in characteristics and modal choice within public transport, all four Nordic capitals maintain a high modal split for non-automobile traffic; in Copenhagen this comprises high usage of both bikes and trains, whereas in the other capitals, public transport predominates, and bikes have a secondary role.
The construction costs in Sweden, Norway, and Finland look broadly similar. This includes ex ante and ex post costs for metro tunnels, regional rail tunnels, proposed high-speed rail, and conventional rail upgrades. Danish costs are somewhat higher, but the costs in Sweden, Norway, and Finland are converging to Danish levels. A report on the Copenhagen Metro is in preparation for the construction costs project at the Eno Center (Aevaz et al. 2021) and is beyond the scope of this case study, but it appears from Eno’s existing work that Copenhagen has always used the procurement and regulation package that the other Nordic countries are moving to.
6.3 Case Selection
In preparing this report, both urban rail extensions in Stockholm – Citybanan (built 2007-16) and Nya Tunnelbanan (built 2020-30) – are considered. In the same period in question, going back to the early 2000s, Sweden has had two additional urban rail megaprojects: Malmö’s Citytunneln, and Gothenburg’s under-construction West Link, or Västlänken.
Citytunneln, built 2005-10 for SEK 8.45 billion ($1.37 billion in 2021 PPP terms), is outside the scope of this analysis. It is a connecting railway on the Malmö side of the Öresund Bridge, with new stations including under city center, but much of the planning was done in the 1990s, and most of the length of the 17 km project is surface connections, not an urban tunnel.
The West Link, in contrast, is a valuable sanity check for the analysis of this report. It is contemporary with Nya Tunnelbanan, with construction expected to take place over 2018-26. It is a regional rail tunnel for Gothenburg, more akin to Citybanan than to Nya Tunnelbanan albeit without the need for deep-mined city center stations, and like Citybanan the lead agency is state transport administration Trafikverket as it is a mainline rail project; Nya Tunnelbanan is led by Stockholm County, often still abbreviated by its old name SLL, and its transport arm SL (Storstockholms Lokaltrafik)
6.4 Stockholm Metro History
The system to the 1990s
In the 1940s, Stockholm was a small city; the county’s population in 1940 was 880,000, rising to 1.1 million by 1950. At the time, the city’s tramway network already included grade-separated segments, including a tunnel running north-south through Södermalm, called Södertunneln, opened 1933. When the city made the decision to build the metro in 1941, it was the smallest in Europe with such plans; Rome opened its metro a few years later than Stockholm, with a municipal population of 2 million.
Construction began in 1944, and the first section, an upgrade of Södertunneln to metro standards, opened in 1950. By 1965, there were two lines, the Green and Red Lines, and a plan was proposed for further expansion including the construction of what is now the Blue Line and further extensions, and some of those extensions are now being built as part of Nya Tunnelbanan.
Throughout this construction scheme, the T-bana took over peripheral radial lines constructed as tramways or local trains, converting them to metro standards in the process. At some places, such takeovers did not happen, creating the modern Spårväg and Lokalbana lines terminating at a T-bana station with a transfer for onward trips to city center.
The Green and Red Lines were designed as a coordinated system from the start. They meet in city center at three stations: T-Centralen, Gamla Stan, and Slussen; each of the two lines has dedicated tracks through this shared segment. Moreover, all three stations are set up for cross-platform interchanges, between same-direction (northbound or southbound) trains at Gamla Stan and Slussen and opposite-direction trains at T-Centralen. This way, same-direction transfers can be done cross-platform, and opposite-direction transfers between the Red Line to the northeast and the Green Line to the northwest can be done cross-platform at T-Centralen; only opposite-direction transfers between the Red Line to the southwest and the Green Line to the south require the inconvenience of walking between platforms at Slussen, or else staying on the train two extra stops for the interchange at T-Centralen.
The T-bana was integrated with urban planning from shortly after opening. While the 1946 city plan centered auto-centric development and city center urban renewal, the 1952 city plan took a different route. It took inspiration from Copenhagen’s contemporary Finger Plan, for what would today be called transit-oriented development around the branches of the S-tog; with a just-opened subway system, the plan called for the construction of modernist neighborhoods facing the stations, with neighborhood centers and high-density housing close to the stations and lower-density housing at greater distance.
The first major suburb based on this plan, Vällingby, grew rapidly in the 1950s. Soon thereafter, the nationwide Million Program constructed a million units of social housing in 1965-75; in the Stockholm region, those projects tended to be oriented around the T-bana like Vällingby before them. The 1952 plan envisioned a polycentric region with communities with both housing and jobs (“ABC,” where A stands for jobs, B for housing, and C for center), but in practice they turned into bedroom communities for Stockholm jobs. To this day, urban studies literature considers Stockholm an example of monocentric transit city development (Söderström et al. 2015; Cats et al. 2015; Spasov 2017); where there is polycentricity, it is often radial along the rail lines, with high modal split (Cervero 1995).
A recent study by Börjesson et al. (2014) finds that the benefit-cost ratio for the system built so far is 6 without taking agglomeration and labor market benefits into account; if they are taken into account, the ratio rises to 8.5. This comes from a combination of high ridership and low construction costs: the 104 km system cost SEK 5 billion in 1975 prices, corresponding to $3.3 billion in PPP 2021 dollars, or $2,600 per workday trip;[1] even taking into account that only 57 km of this system is underground, this is an extraordinarily low cost, not achieved on contemporary lines such as those of London, Milan, or Rome.
But then expansion cooled. The Million Program was over by 1975. The Blue Line opened in the same year, and T-bana growth thereafter was slow; the most recent expansion, a short extension of the Green Line Skarpnäck branch, opened in 1994.
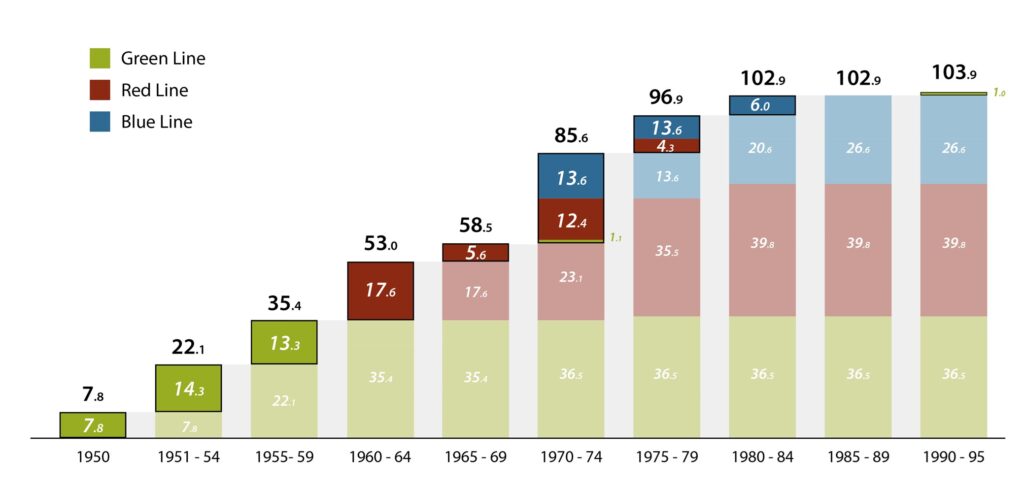
figure 1. Stockholm Metro kilometers built per five-year period per year
Between the 1980s and 2000s, Stockholm was characterized by stability. Population growth slowed down, as the working class had already settled in in the Million Program projects. Swedish economic growth was weak, culminating in the financial crisis of the early 1990s, also affecting the rest of Scandinavia. Most of the T-bana lines planned in 1965 had been built already, and the metro region had already shaped itself along what had been built.
Planning since the 2000s
Stockholm has continued growing in the last 30 years. Recovery from the financial crisis has been rapid: from 1990, the earliest year with current World Bank PPP (2017) calculations, to 2019, the eve of the corona crisis, Sweden’s GDP per capita grew a cumulative total of 55%; in the developed world as conceived at the time, without newer entrants like South Korea, only two countries have posted faster growth, Australia at 59% and the Netherlands at 56%, and the US near-tied Sweden. This growth has attracted immigrants, and, moreover, Sweden has maintained long-term openness to labor and humanitarian migration, leading to high population growth.
The monocentric character of the city and its population and economic growth led to escalating urban rail ridership. Long-term growth in Stockholm commuter rail traffic led to concerns about capacity saturation; there were only two railway tracks through Stockholm, which had to carry both the county’s commuter rail system and intercity rail to points south and west, where the vast majority of the rest of Sweden’s population lives. On the eve of the opening of Citybanan, those two tracks, called the wasp’s waist, carried 24 trains per hour at the peak, including 16 commuter trains and 8 regional and intercity trains.
Moreover, all projections called for further growth. In the 1990s and 2000s, Stockholm County’s population averaged 1.1% annual growth; this rate accelerated in the 2010s as immigration levels have increased, raising the county’s annual growth rate to 1.5% over the decade. In 2005-6, Trafikverket contracted with the consultancy Transek, now owned by WSP, to project future demand through 2060 and perform a benefit-cost analysis (Transek 2006).
The Transek report projected a rapid exhaustion of capacity. Under a high-growth assumption, a no-build option would have traffic reaching the wasp’s waist’s capacity by 2011, before any project could be completed. A surface track option investing in the system without a new tunnel could raise capacity in the limit to 32 trains per hour of which 18 were commuter trains, but traffic would reach that level by 2014. Citybanan would suffice through 2020, and even a second step for Citybanan, with a theoretical capacity of 30 trains per hour in the tunnel rather than the current 24, would only last until 2032. A more conservative assumption of low growth had the no-build option lasting until 2018, the surface option until 2021, Citybanan until 2043, and a second-step Citybanan until 2075.
At the same time, the benefit-cost analysis was unfavorable. All investment options had negative social rate of return, but the surface option had a more negative rate of return than the Citybanan options, which cost more but were far more beneficial for the region. The project was decided then because of the need for further increases in capacity in the Stockholm region; wider benefits are not always directly measured,[2] and official analyses can omit them, making projects that by broad consensus are beneficial look weak.
Nya Tunnelbanan comes out of similar plans for long-term capacity. The population growth projections in Stockholm require large quantities of new housing, to be developed on greenfield and brownfield sites outside city center; in Stockholm, as is typical for growing European cities, housing redevelopment is done on non-residential sites, with no replacement of historic low-rise apartment buildings with bigger ones.
To permit this growth, SLL concentrates on three growth regions: Nacka, Barkarby, and the Arenastaden area in Solna. Planning for all three extensions was done in coordination with local and regional growth plans.
The Nacka extension plan was explicitly done with a housing growth target in mind for the municipalities served (SLL 2018a); a branch of the same extension is to take over a Green Line branch, to reduce the Green Line’s southern section from three branches to two in order to both increase frequency on all branches and permit redevelopment of brownfield industrial sites.
Once the overall direction was decided, SLL looked at many different options for alignments:
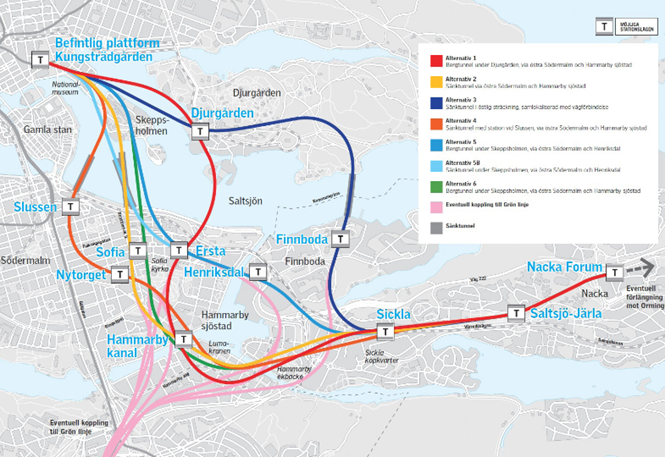
figure 2. Studied deep-mined routes for the Nacka extension
Plans for the extension to Barkarby followed a standard four-step process, to ascertain such a high-cost megaproject is truly necessary for the region (SLL 2014):
- “What if?”: this includes measures that manage transportation demand, such as reducing parking.
- Optimization: this includes using existing infrastructure more efficiently, for example encouraging carpooling to use road lanes more efficiently, increasing public transport frequency to effect modal shift, and improving the bus network.
- Rebuilding: this includes minor infrastructure improvements in conjunction, such as running more surface commuter rail service to non-city center destinations (since city center is already full, hence Citybanan and long-term plans for Citybanan step 2) and rearranging bus infrastructure for higher priority, including transit signal priority.
- New construction: only after steps 1-3 are exhausted is fully new infrastructure to be considered. The report looks at many modes of public transport, such as BRT and a gondola, but finds that they are not as good as a subway extension, and further finds that the best place for an extension to Barkarby is from Akalla.
Arenastaden had the most complex history of planning (SLL 2018b). It originates in plans for expanding public transport capacity to Karolinska, located in Solna just to the north of the present-day Green Line. Multiple options were considered, including bus service expansion, a tram, a branch of the Green Line, and an entirely new subway line.
The metro option was deprecated at first due to its cost and complexity; some of the early plans called for rebuilding Odenplan, which proved too difficult. Eventually it was bundled with parallel plans for Nacka and Barkarby to form what is now Nya Tunnelbanan.
The choice of brand even recalls this history of the Arenastaden branch: it is called the Yellow Line and portrayed as such on maps, even though it is still a branch of the Green Line. Thus, maps show the Yellow and Green Lines as two separate branches to the north and northwest, but then as a single line from Odenplan south, with the southern branches carrying both Green and Yellow Line trains.
6.5 Project decision process
As in most of the Nordic world, Swedish politics is traditionally bipolar between two blocs, with regular alternation between them, albeit with more frequent left governments and less frequent center-right ones than elsewhere. The party situation in Sweden is important for understanding budget priorities, and Sweden displays large variations in broad policy according to which bloc is in power, but little in the way of political influence over technical matters or over alignments. This is in contrast with frequent interference in North America – for example, as we explain in more detail in the New York case, there was partisan politics in the decision to build Second Avenue Subway, which in the late 1990s was seen as a Democratic city project in opposition to commuter rail to Republican suburbs.
Politics and priorities
The center-left bloc is led by the Social Democrats (S), who were dominant in the middle of the 20th century, and consists also of the Green Party (Mp) and the farther-left Left Party (V); it is currently called Red-Green, and is dominated by S, with Mp as a minor partner and V at most an outside supporter of the coalition, mainstream enough to participate in some political institutions but not enough to enter the government. S and Mp are aligned on practically all issues; a joke among S members is that Mp exists as a thinktank for S’s environmental policies, and with little daylight between them, Mp support has dwindled in recent years.
The other bloc, formed by the center and center-right parties and known since 2004 as the Alliance for Sweden, is a four-party bloc consisting of the mainline center-right Moderates (M), the Liberals (L or Fp), the historically agrarian Center (C), and the Christian Democrats (KD). Its situation is in flux, and the Alliance proper was dissolved in 2019, due to differences over the role of the far-right Sweden Democrats (SD), who supported the Alliance from outside in 2010-4 but grew more vocal subsequently; currently, C and L support the S-led government with tensions with V over budgetary and regulatory issues such as rent control (Steensig 2021) while M and KD do not and are willing to govern with the support of SD. The future of this system is in flux, but the entire history of planning in Sweden so far has been with the traditional two-bloc system, long before the center-right called itself the Alliance.
On transport-related issues, there are large differences between the two blocs over priorities, owing to the role of public transport as a green alternative to the car. There was intense disagreement over the issue of congestion pricing in Stockholm in the 2000s, and right now, there is debate over a high-speed railway connecting Stockholm with Gothenburg and Malmö, which the Red-Greens support and the Alliance does not, preferring investment in electric cars instead (Eliasson 2014; Hårsman and Quigley 2011; Personal Interview B 2021; Personal Interview G 2021).
Both Citybanan and Nya Tunnelbanan faced some Alliance opposition, both on fiscally conservative grounds: as explained above in the section on Stockholm Metro history, the alternatives analyses for both programs projected negative rates of return. Nonetheless, the plans for growth and extra capacity required the construction of those projects, and so they were not canceled, and the Alliance assented to both in its 2006-14 coalition.
A culture of consensus
The guiding principle within Swedish culture is consensus (Personal Interview E 2021). This occurs at the levels of politics (Bengtsson 2013), office culture (Altinkaya 2006; Salminen-Karlsson 2013; Ullman 2017), and local empowerment.
Whereas in business, consensus means slowing down process until everyone agrees, in politics it means accepting a large interpartisan difference in political agendas. There is little sniping involved: Alliance governments do not cancel projects begun under the Social Democrats, and vice versa, and projects that are so controversial there is risk of such sniping are not chosen for going through (Personal Interview E 2021).
This has implications for the use of Stockholm’s congestion pricing revenues. In the 2000s, the Social Democrats and Greens called for using them to fund investments in public transport, whereas the Alliance, having formerly opposed the scheme, promised to instead divert the money to roads. The compromise under the Alliance government of 2006-14 under Frederik Reinfeldt was that congestion pricing money would go toward building new motorway tunnels in and around Stockholm, but also to some extent Nya Tunnelbanan, which was planned in the same era.
The same culture of consensus applies to labor and to other conflicts. Swedish and other Nordic unions go on strike often if their demands for higher wages, benefits, or labor standards are not met. Consensus may be achieved at tripartite meetings between the government, union representatives, and business-group representatives, but there is recognition that there is conflict between workers and bosses and overall the system does not empower groups to act as veto points.
There is likewise a right to sue within Sweden, which interview subjects who discussed this issue treat as a normal part of the democratic process (Personal Interview F 2021). However, in practice, lawsuits are rare, and no group chose to sue Citybanan or Nya Tunnelbanan. Informally, there is great effort made not just at community level but also at the level of conflict between public agencies and private contractors to avoid going to court; see below on procurement.
Local-national interface
Sweden’s unitary state is tempered by a large degree of devolution of planning to county and municipal governments. Rail megaprojects come from regional growth plans: Citytunneln was planned locally and likewise the West Link in Gothenburg is planned by the county, Västra Götaland, which comprises the entire metropolitan area plus additional rural hinterland.
This devolution applies not just to megaprojects but also local transit planning. In Gotland, an island of 59,000 whose main city is Visby, a county-level civil servant handling public transport is connected to all other important officials within the county, enabling rapid coordination, in contrast with top-down unitary systems such as that of the United Kingdom (Personal Interview C 2021).
The Swedish state has extensive fiscal devolution: local and county taxes are 16% of Swedish GDP, the second highest figure in the OECD after Australia’s, and among the highest figures as a proportion of total government revenue; moreover, there is near-complete discretion by local governments about how much to charge, as opposed to central taxation at a uniform rate that is then distributed to localities by formula (OECD 2020). However, megaprojects remain beyond the capability of a county, even one as big and urbanized as Västra Götaland, and therefore project funding comes from a combination of regional and state sources. The West Link is funded about 50% by the Swedish state, 41% by Gothenburg congestion pricing revenues, 7% by city and county funds, and 2% by land sales (Personal Interview E 2021).
To resolve the issue of multiple funding sources for one project, Sweden employs competitive grants given by Trafikverket to regions that have the strongest proposals. If a county or municipality has demands in excess of the minimum required to execute a project, such as additional tunneling to avoid the impact of above-ground intercity rail service, the local government is required to fund the excess costs; this prevents local areas from treating state infrastructure money as a free lunch for unrelated priorities.
Stockholm is nationally unique in the size and importance of the city and its projects. As a result, state involvement is unavoidable, and both Citybanan and Nya Tunnelbanan are planned and funded jointly between the state and county budgets. Citybanan may be a mainline rail project planned primarily by Trafikverket and SL, but funding came from multiple sources (Tihinen 2017):
SEK 10.3 billion: state loans.
SEK 5.1 billion: Stockholm County and the municipality.
SEK 2.3 billion: municipalities in adjoining counties benefiting from regional rail service.
SEK 1.6 billion: state appropriations.
In this way, Stockholm and Gothenburg are similar: megaprojects are funded by negotiation between the state, the county, and municipalities. However, unlike in Gothenburg, the planning for the need for Citybanan came not from the county, but from Trafikverket, which projected both regional and national rail traffic trends; Citybanan was deemed a project of national importance, and therefore the county was less involved in its planning and municipalities even less so.
Civil service role
Interviewees from the civil service as well as external organizations confirm that decisions on planning originate in the civil service, and not in politics. In the 1950s, Sweden imitated the American road planning system that produced the Interstates (Personal Interview B 2021), which was insulated from political interference through strong civil service norms under Thomas MacDonald and a lockbox on road funding such that federal funding was not subject to regular congressional control. Unlike in the United States, in Sweden the system was also designed to remove local infighting and prevent regions for jockeying for funding; competition between different regions for funding is handled through apolitical mechanisms.
This system has persisted through changes in the organizational chart. Swedish Railways (SJ), nationalized in 1888, developed internal planning capacity, and modernized throughout the postwar era, running both commuter and intercity rail. In 1988, SJ was split, and the responsibility for infrastructure was transferred to the new Swedish Rail Administration, which through mergers in the 2000s combined with the Road Administration to form modern Trafikverket in 2010.
Trafikverket retains extensive planning power, even with growing privatization of operations, such as the contracting out of Stockholm commuter rail to the MTR. At the regional and local levels, there are parallel civil service systems, and there is porosity between Trafikverket and SL: many of the planners responsible for Nya Tunnelbanan worked on Citybanan previously.
Swedish norms of civil service independence are such that it’s fair for civil servants to frankly criticize common wisdom. As detailed below in the section on functional procurement, a growing trend in Nordic procurement is to have loosely-specified functional contracts, with support from Trafikverket and independent research, but a civil servant with experience in both Citybanan and Nya Tunnelbanan openly criticized this trend in an interview (Personal Interview 2021), in much more straightforward language than observed in interviews with American, Canadian, or British civil servants.
Nonetheless, politicians remain the top authority when it comes to the biggest investment decisions. While both Citybanan and Nya Tunnelbanan were planned by civil servants, the decision to proceed was political. The budgets for both projects are so large relative to the size of Sweden that it was unavoidable that they should be debated as part of the national budget.
While road investment decisions in Sweden are decided by benefit-cost analysis whereas those in Norway are not, in neither country is there politicization of route choice (Eliasson et al. 2015). Political influence boils down to a yes-no decision, perhaps with loose guidelines over the level of investment. To the extent there is any evidence of politicization of priorities, it is again loose, consisting only of decisions of whether to prioritize urban or rural infrastructure, or, in the Stockholm region, modal conflict between road and public transport investments.
Cost and ridership
Predicting the ridership of an urban rail project ex ante is imperfect. Nonetheless, we can look at the ridership of recently-opened lines to gauge whether the value proposition of Nordic urban rail construction is positive.
Citybanan provides a ready example: ridership in 2019 was 410,300 on a winter workday (SL 2019). The project’s overall cost, SEK 16.8 billion in 2007 terms or $2.4 billion in PPP 2020 dollars, is $5,850 per weekday trip, among the lowest costs for urban rail lines in the Transit Costs Project for which there are definitive ridership figures and not just costs. Recently-opened and under-construction lines in Europe usually cost $15,000-40,000 per weekday trip. This is especially positive for Citybanan as its business case relies on estimates of continued growth in the coming decades, whereas the ridership figure is only two years after it opened.
Even if the ridership of Citybanan nets out the previous commuter rail ridership, 324,800 per weekday in 2016 (SL 2016), the case remains solid: it would mean that Citybanan generated enough ridership to lower the cost per new rider to $28,000 within two years, and will lower it further in coming years due to continued growth in this region, where typically metro and commuter rail tunnel projects cost within this range when considering all riders and not just new riders.
The $5,850/rider figure is especially extraordinary when compared with the existing T-bana network. Its construction costs over the decades amount to $3.3 billion in 2020 dollars, for a total of $2,600 per trip, a cost figure that like the $5,850 figure does not net out the ridership of older lines, such as the now-closed historic tramway system. But Sweden today has 2.6 times the GDP per capita that it had in the early 1960s (Maddison 2020)[3], midway through the opening of the T-bana; the affordability of Citybanan relative to ridership is higher than that of the T-bana.
The combination of benefit-cost ratios for the original T-bana and Citybanan is a puzzle. The benefits of the T-bana scale with ridership, and practically all of them come from the value of time, which scales with income; some analyses even disaggregate the value of time by class or income (Teulings et al. 2018). If $2,600 per trip results in a benefit-cost ratio of 6 in a Sweden with a GDP per capita of $17,239, then, in a Sweden with a GDP per capita of $45,193, a $5,850/rider project should have a benefit-cost ratio of about 7, and even netting out the entire 2016 ridership of Stockholm commuter trains, the resulting $28,000/rider project should have a benefit-cost ratio of 1.46 without taking into account future ridership growth. And yet, the projected benefit-cost ratio was lower than 1.
Elsewhere in Scandinavia, costs per rider for recently-opened lines have not been high either:
- Helsinki had 92.6 million metro trips in 2019 (HKL 2019), compared with 64.1 million in 2016 (HKL 2016), on the eve of the opening of West Metro. The difference, 28.5 million annual trips, is about comparable to 95,000 on an average weekday, in line with the projection of 100,000/weekday (Railway Gazette 2017), which makes the project cost about $18,000 per new weekday trip, only two years after opening.
- Lørenbanen has 8,000 boardings at the single station that opened (Sporveien 2016), which corresponds to 16,000 trips; this makes the cost of the project $10,000 per weekday trip, new or diverted from other lines.
It is likely that the contrast between low or medium costs per rider and low benefit-cost ratios reported in prior analysis is why the decision to build Citybanan was undertaken, even in a fiscally conservative Alliance government.
Transit-Oriented Development
Historically, the T-bana was built together with suburban social housing, from Vällingby to the Million Program. The connection between housing construction and public transport infrastructure remains strong with Nya Tunnelbanan, and so the extensions to both Nacka and Barkarby are bundled with regional housing growth plans.
This is because housing is sorely needed in the Stockholm region. In 1987, as an environmental and anti-sprawl measure, Sweden passed the Plans and Constructions Act (Plan- och Bygglag, or PBL), requiring community consultation for development. Housing growth remained healthy in the run up to the financial crisis of the early 1990s, but after the crisis it crashed to a minimum of about 12,000 units a year in a country of 9 million people, compared with 110,000 in the peak years of the Million Program (Statistics Sweden 2022b).
Weak housing growth even as the economy was recovering from the crisis and growing fast led to rapidly rising housing costs; the rise in rents in the late-1980s bubble was not erased after the bubble popped but instead became permanent, and rents kept rising further (Statistics Sweden 2021). By the 2010s, the housing bubble returned (Dermani et al. 2016; Asal 2019), as on the eve of the global financial crisis house prices were 60% above 1990 levels and by 2015 they had risen to twice 1990 levels. Apartment prices, for which the index only goes back to 2005, rose even faster over the period with available data, a nominal rise of 138% compared with 71% for detached houses.
Starting in the 2000s, plans for housing growth became part of the Stockholm region’s growth projections. In 2007, the advocate group YIMBY was founded in Stockholm, calling for a repeal of the PBL and acceleration of housing construction in urban areas, where there is the most demand; YIMBY asserts that it wants Stockholm to grow “both in width and in height,” that is through taller construction in or near city center but also the construction of new high-density neighborhoods on urban rail lines to be built (YIMBY Stockholm 2022; Personal Interview J 2022).
The further-reaching demands of YIMBY are far from met. However, in the 2014 election, the political parties competed by promising to build more housing, as both rents and prices reached record levels, and waitlists for rent-controlled apartments in Stockholm reached decades. Prices are now high enough that even with extensive local role in development, municipalities are more likely to approve new housing as they expect the new residents to be wealthy enough to be net contributors to local taxes. In the mid-2010s, the rate of construction of housing accelerated to about 55,000 annual completions Sweden-wide (Statistics Sweden 2022b), with 15,000 net completions in Stockholm County, or about 6 per 1,000 people. The municipality where Barkarby is located, Järfälla, built 780 net new dwellings a year over the same period, or 10 per 1,000 people (Statistics Sweden 2022a).
The coordination between housing construction plans and urban rail infrastructure is one of the contributing factors to high public transport usage in Stockholm. The main threat to this model is that there is substantial lag between housing demand and housing supply: the infrastructure development plans of the 2000s were designed for a population not much higher than that of the 2000s, but thanks to economic growth and immigration Stockholm has surpassed the projections, leading to a state of permanent housing crisis; the delays in the opening of Nya Tunnelbanan are likely to magnify this crisis.
6.6 Project delivery
Project scoring
When receiving bids, Sweden uses a combination of the lowest-bid and best-value methods for picking the contractor.
Lowest-bid contracts, awarded purely on the basis of price, are used for less complex public procurement, for example access tunnels. In addition, Swedish contracts may be decided on the basis of cost rather than price (Swedish Public Procurement Act 2016), in which case the entire lifecycle cost can be considered, including in the case of public transport operations and maintenance.
However, complex projects are awarded on the basis of best value. The main contracts of Nya Tunnelbanan and Citybanan were both best-value, with Nya Tunnelbanan using the ratio of 75% price to 25% quality and Citybanan using a 50-50 ratio. Going forward, the 50-50 ratio is the most common for the most complex project, whereas 25% quality is intended for intermediate projects, which Nya Tunnelbanan was not.
Benefits for technical purposes are assessed based on a pre-published schedule of monetary values, collecting in the ASEK manual, of which the current version is 7.0 (Personal Interview G 2021); the external costs and benefits are compared across the Nordic countries, and there is substantial variation, but also interest in sensitivity analysis to ensure that project selection does not hinge on arbitrary values (Nordic Council of Ministers 2021).
Competition
Sweden has a large and growing ecosystem of engineering and construction firms. Some are international in scope and well-known for getting contracts abroad, most notably Skanska; others are more regional, such as NCC, the Finnish conglomerate YIT, the Swiss tunneling firm Implenia, and the Czech firm Subterra/SBT.
Contracts are awarded on a competitive basis. In an analysis of 41 contracts let between 2018 and 2021 for Nya Tunnelbanan, only two received just a single bid, both small contracts for work access tunnels, and eight more received just two bids. The median number of bidders is four. In Gothenburg, a major contract worth SEK 820 million had to be rebid because the first tender received only one bid and it was over budget (Reynolds 2018); it is a general rule in Sweden that if there’s only one bid and its price is not as expected, the contract must be relet (Interview D 2021).
Moreover, the market is large enough that it is not the same four firms bidding on all contracts. An analysis of both the winning bids and all bids on some contracts (Siljevall 2021) shows the following list of contractors for tunneling projects:
- Skanska
- NCC
- YIT
- Implenia
- Subterra
- Obrascón Huarte Lain
- China Railway Tunnel Group
- Gülermak
- Itinera
- Sacyr Construcción/Serneke
- Comsa/Soner Temel Mühendislik (STM)
- Züblin
- Peab
The Swedish market is open to international entrants, such as CRTG and multiple Turkish contractors.
However, Turkish contractors report that they are informally required to partner with longstanding Swedish or otherwise European firms. The above list includes one such partnership: STM is a Turkish firm bidding on Nya Tunnelbanan contracts together with the Spanish contractor Comsa. Such partnerships are not restricted to Turkish groups – Sacyr is Spanish and bids together with Swedish Serneke. But Turkish contractors who were interviewed for this project say that Swedes are culturally more comfortable with a partnership than with hiring a purely Turkish firm. In one interview, a Turkish contracting manager held up an Android phone and said, “If a Swede says this is an iPhone, then this is an iPhone, and if I say this is an iPhone, they will check” (Personal Interview 2021).
While openness to Turkey remains uncertain, openness across Europe is much more complete. The list of contractors includes multiple from Southern and Eastern Europe, and some of the firms are relatively new entrants to the market (Serneke was founded in 2002).
Build contracts
The typical contract for infrastructure in Sweden is done as design-bid-build. The design is done in-house with the assistance of private consultants, and is owned by the lead agency, for example SLL; the construction contractors only bid for the build contract, and as a result, in domestic Swedish parlance, design-bid-build contracts are called build contracts (Personal Interview D 2021; SLL 2021).
There has been a long-term shift in the Nordic countries toward the design-build method, which is viewed as more modern and efficient (Andersen 2018). At the same time, Osipova (2008) finds that the design-build method’s attractiveness in offloading cost escalation risk to the private sector means that bidders increase the price to compensate, leading overall to higher profit margins. It is notable that the method that is viewed as more modern and cooperative between the client and contractor nonetheless is associated with higher costs and higher uncertainty.
Part of the issue concerns familiarity to the contractors. Although design-build is not yet common in the countries the contractors come from, the separation between design and construction works differently. In particular, the Nordic build contract has relatively little flexibility for the contractor to suggest changes.
An interview in Oslo (Personal Interview A 2020) revealed that in this model, the standard for risk allocation is that the designer bears all risk in case the builder follows the exact specification, but otherwise the builder and the client bear the risk. As a result, builders do not deviate from the design based on meter-scale geology, and designers compensate with defensive design, including more options than is required to avoid liability. The Oslo case is that of the Fornebu Line, built for about $300 million per km (in 2020 PPP terms) with underwater tunneling and deep-mined stations in imperfect geology; to avoid water intrusion, the designers recommended waterproof concrete throughout the project, whereas a building contractor with more flexibility would decide whether to use such concrete based on local conditions as discovered while tunneling.
The Nordic style of design-bid-build then contrasts with other styles. Turkey uses two contracts, but splits them differently: one contract goes up to 60% design, another combines going up to 100% design with construction; this provides builders with the flexibility needed to make small changes, and even then, builders can redo some of the work in the 60% design contract if they need to. The Spanish system of design-bid-build emphasizes the flexibility to make small changes based on conditions as well, as detailed by former Madrid Metro CEO Manuel Melis Maynar (Melis 2003).
Because of this difference, Turkish and other international contractors in Sweden find the local design-bid-build system cumbersome. This has led to a tendency to use design-build more often, but so far the contracts for Nya Tunnelbanan remain largely build contracts, as was the case for Citybanan.
Fixed price, but with itemization
Contracts in Stockholm, as in the rest of Scandinavia, vary between contracts let on the basis of fixed price (lump sum), and itemized contracts. Itemized contracts come in multiple flavors; for the most complex projects, including Nya Tunnelbanan and Citybanan, they tend to use the cost-plus model, as recommended by Nilsson (2011). In this model, instead of a single price for the contract, the contractor and client compute the total itemized costs in the contractor’s proposal and apply a fixed rate of profit; this is a common method in low-cost countries, and Melis (2003) credits it with Madrid’s easy process of change orders, which contrasts with the contentious process in fixed-price American cities.
Nya Tunnelbanan uses some fixed-price contracts in addition, but more common is a hybrid method based on fixed prices but still with itemization, in case modifications are needed; this is called fixed-price with adjustable quantities, or fixed-price with bill of quantity, which begins with a fixed price but itemizes a portion of the budget to shift some of the risk from the contractor to the client.
Under the Swedish Public Procurement Act (2016), change orders do not require redoing the bid if the cost overrun is less than 50% and the change is necessary for the completion of the contract, or if the overrun is less than 15%.
Interviews with civil servants involved with procurement did not reveal any contentious process for change orders (Personal Interview D 2021). If the modifications are itemized in the contract already then it is easier, but even if they are not and renegotiation is required, both sides aim to avoid litigation, and the courts prevent the contractor from walking away from risk that it assumed.
In contrast, contractor interviews portray a more complex process (Personal Interview I 2021). There are pre-agreed itemized rates, but not for everything, and sometimes there is conflict, leading to a back-and-forth in which the client rejects a design multiple times due to disagreements about quality control, although even then there is no litigation so far for Nya Tunnelbanan or the West Link. For change orders, the builder can propose modifications but needs the approval of checkers, who are external consultants and are insulated from civil service pressure; only the general manager of Trafikverket can overrule them, and otherwise the builders have to communicate with the checkers via the client.
Within the Nordic countries there is demand from the private contractors to be given more control, in the form of not just design-build contracts but also a transition to lump-sum contracts, as investigated by senior civil servants at not just Trafikverket but also peer agencies in the entire region (Andersen 2018). This is justified on the grounds of private-sector innovation, in which fixed-price contracts permit contractors to do what they know best.
Functional procurement
Sweden is transitioning to a new form of procurement aiming at greater flexibility, called functional procurement (Personal Interview B 2021). Under functional procurement, the agency does not specify what it wants, but only the function of what it wants. If it needs a bridge, it only specifies the type of bridge (road or rail), the required capacity and speed, and operating and maintenance standards. This contrasts with the more conventional approach, retrospectively called product procurement, in which the agency gives more details about what product it wishes to buy.
The Swedish state’s overall procurement strategy talks of transitioning from product to functional procurement in order to improve the competitiveness and dynamism of the market (Ministry of Finance 2016): “Requesting by function can promote competition in public procurements by enabling more companies and organizations to participate and submit tenders, to the benefit of small and medium-sized enterprises.”
Trafikverket participates fully in this transition to functional procurement, which is among the reforms with which it hopes to boost construction productivity – but see below on ongoing reforms.
However, in practice, the effect of functional procurement may be limited in the rail sector. A civil servant responsible for procurement (Personal Interview D, 2021) said they “can’t say it makes it easier.” In practice, a lot of technical detail has to be filled in to ensure backward compatibility with other systems, and railways must follow UIC and national regulations.
Ongoing reforms and the West Link
Trafikverket is slowly transitioning toward greater use of design-build. Its procurement strategy for the West Link (Trafikverket 2014) speaks favorably of the increase in the proportion of Swedish infrastructure contracts that use design-build, citing contractors who prefer it to design-bid-build. Trafikverket’s slogan toward this is “pure client”: Trafikverket, in this view, should not be doing designs by itself but rather outsourcing this aspect to the contractors.
The major theme in the strategy is internationalization. The Nordic market is too small, hence the invitation of international players. Trafikverket surveyed the contractors about their preferred contract size, and received answers ranging from SEK 500 million for national firms to SEK 3-4 billion for large multinationals:
Foreign contractors require sizable contracts since it is otherwise difficult for them to be competitive with smaller procurements. The specified size is needed in order for it to be worth them coming with their own construction vehicle fleets, own sub-contractors and designers, to move personnel and learn Swedish practice and Swedish regulations.
The West Link is accordingly divided into six contracts, of which four are in the SEK 3-4 billion range and two are smaller. In addition to sizing contracts for multinationals and using design-build, Sweden is putting out more information in English and proposing greater use of English as a business language for infrastructure.
The design-build variant proposed is called Early Contractor Involvement, or ECI. Under ECI, the client and contractor work together to define the project and its needs, so that the contractor and client jointly plan the scope and design. This is intended to increase flexibility as well as provide international contractors with a more familiar procurement environment.
However, while some of the literature in Scandinavia speaks favorably of lump sum contracts, justified on similar grounds as design-build, Trafikverket takes a more measured approach. It views the question of lump sum contracts versus itemization as dependent on the complexity of the contract, and prefers to maintain itemization for the more complex West Link civil infrastructure contracts, using lump sum only for the systems contract and for the smallest civil contract.
Broader reforms: discussion
There is extensive published literature in Sweden, some peer-reviewed and some gray, concerning procurement and construction productivity. The work done is largely on roads, because there are many road projects in the country of various sizes, permitting large-n studies, whereas rail megaprojects are rare, and the only four urban rail tunnel projects in Sweden in this century so far have been Malmö’s Citytunneln, Citybanan, Nya Tunnelbanan, and the West Link. For example, the comparison of the use of benefit-cost analysis in Sweden and Norway concerns road projects (Eliasson et al. 2015), and Mandell and Nilsson (2010) compare different procurement mechanisms for roads as well. Trafikverket’s document about the procurement strategy for the West Link suggests that some of this work is leading to changes in rail megaproject procurement as well.
Nilsson and Nyström (2014) additionally compare track maintenance, claiming 12% reductions in cost from Sweden’s practice of contracting out maintenance to private firms. Nonetheless, they compare Sweden with Finland and the Netherlands, and explicitly say Sweden should imitate their practices of imposing more risk on the contractor relative to the client; the overall systems in Finland and Sweden are similar, but Finland’s model of fixed price with adjustable quantities adjusts fewer quantities than Sweden’s.
In this schema, there are two ways to do procurement, of which one is viewed as more traditional and the other as more globalized or modern:
Table 1
| Traditional | Globalized |
|---|---|
| Design-bid-build | Design-build |
| Itemized contracts (unit prices, cost-plus) | Lump sum contracts (fixed-price) |
| Smaller contracts (hundreds of millions of SEK) | Larger contracts (billions of SEK) |
| Product procurement | Functional procurement |
| Public client risk | Private contractor risk |
In practice, the five items on the table can be mixed-and-matched. For example, American practice has long favored lump sum contracts with no itemization, but only recently have American transit agencies begun to transition from design-bid-build to design-build. The traditional Nordic system of risk assumption has also been a hybrid of public and private, as detailed in the section on build contracts, and coexists with design-bid-build.
The justification for moving from the so-called traditional to the so-called globalized system, which is most complete in the United Kingdom, is to permit more private-sector innovation. Thus, a European benchmarking survey by Trafikverket (2016) says,
One advantage of DBB contracts is that a competent and experienced client more easily can ensure that they get the quality they want by specifying the design in detail (Cheung et al., 2001). When a certain level of quality (or safety) is critical, DBB-contracts may be preferable if the client has sufficient expertise and experience to know what he wants and how to achieve this. A disadvantage is that the client’s detailed specification reduces the contractors’ opportunities for innovation; there are simply not that many technical aspects to develop.
In the 1980-2007 period, construction labor productivity in Sweden grew only 0.8% per year, whereas economy-wide the figure was 2.6%, rising to 4.7% in sectors subject to international competition (Mandell and Nilsson 2010); Trafikverket’s procurement strategy as detailed for the West Link aims to boost annual construction productivity growth to the 2-3% range. However, in the United States, construction productivity over the same period fell per the work of Teicholz (2013)[4] and Stevens (2014), and Swedish infrastructure construction costs remain far below those of the target countries referenced positively by Trafikverket’s benchmarking report, the UK and the Netherlands.
It is also notable that while the Swedish government’s official procurement strategy speaks of openness to small- and medium-size enterprises, Trafikverket’s procurement strategy in the context of the West Link justifies its decision about project size in the opposite way: the main West Link contracts are scaled at SEK 3-4 billion in order to be more open to large international firms, while it’s the smaller domestic contractors that prefer smaller contract size.
It is equally notable that the academic and gray literature on infrastructure investment in Sweden is heavy on comparisons not just to the other Nordic countries but also to Germany, the Netherlands, and Britain, but never to Southern Europe, Turkey, or France. The way Scandinavia builds infrastructure – the traditional procurement procedure, some of the engineering decisions (such as the Copenhagen Metro technology), and the EU-wide labor force – has similarities to the systems detailed in the chapters on Italy and even Turkey, much more so than to the high-cost American examples, and yet direct comparisons with Southern Europe appear very uncommon in Sweden as well as elsewhere in Northern Europe.
Finally, while the literature in Sweden recommends many practices that center private-sector innovation and aim to imitate British and American procurement, it does not oppose the use of best-value contracts. The literature on procurement is mostly silent on the issue of whether contracts should be decided by lowest bid or by a combination of lowest bid and a technical score. Trafikverket’s benchmarking report treats the combined best-value system as the most modern, alongside early contractor involvement in bids, and the pan-Nordic report on design-build speaks favorably of best-value contracts too.
6.7 Engineering
Unlike the great majority of modern metro tunnels, the Stockholm Metro and commuter rail tunnels are built using drill-and-blast; no tunnel-boring machines (TBMs) are used, though there is discussion of using TBMs for the next tranche of construction in Stockholm after Nya Tunnelbanan, an extension to Älvsjö (Personal Interview F 2021). The West Link uses a combination of methods; through hard rock it uses drill-and-blast tunnels, but through softer ground it uses cut-and-cover, and the stations are cut-and-cover as well.
This choice of tunneling method comes from Stockholm’s hard gneiss geology; Gothenburg is a combination of gneiss and granite. Stockholm’s rock forms a natural arch, and therefore it is not necessary to line the tunnel with concrete as is done with a typical TBM. In most cases, there is no need for further sealing to prevent water intrusion, but in some it is necessary to use grout.
The upshot is that it is difficult to make direct engineering comparisons to urban rail projects that use the more conventional method of TBMs for the tunnels and cut-and-cover stations. It is also difficult to make direct comparisons with stations, because the dig volumes as mentioned in the reports for New York, Milan, and Istanbul can be given purely for stations, whereas in both Stockholm and Gothenburg it is common to combine stations and tunnels in citing volumes and even give contracts that do both at once.
Tunnel drilling
There are three kinds of tunnel used for Nya Tunnelbanan: access tunnels, single-track tunnels, and double-track tunnels.
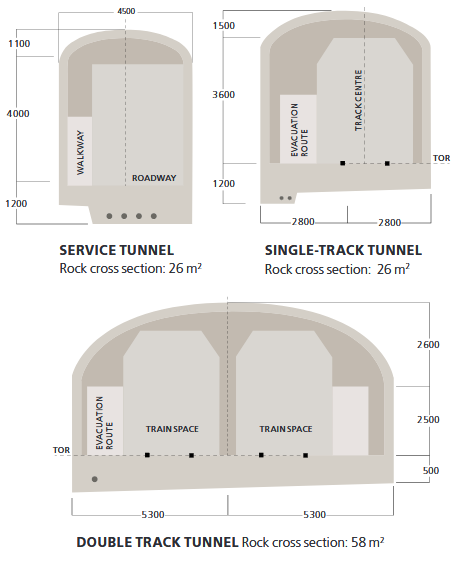
figure 3. Tunnel cross-sections
In practice, with access tunnels, the total length of single-track tunneling for Nya Tunnelbanan is far greater than 39 km, twice the route-length of the project. A service tunnel is required alongside all lines, regardless of whether they are built as twin single-track tunnels or as double-track tunnels; in addition, work tunnels for station access add to the dig volume, such that the planned tunnel between Söderstadion and Sockenplan allowing a connection from the Blue Line to take over the Green Line branch to Hagsätra, a distance of about 1.7 km, has 270,000 m3 of total dig.
Station construction
Underground stations in Stockholm are mined. However, the entry halls may be built with cut-and-cover, with escalator and elevator connections to the main cavern.
Station construction plans make an effort to reduce disruption. In residential areas, it is forbidden to truck muck out of the access tunnel overnight after 10 pm or before 7 am (Personal Interview F 2021); because the combination of drill-and-blast and mined stations does not rely on 24/7 construction, it is possible to pause the works overnight, and no additional infrastructure is needed to accommodate any overnight accumulation.
To further reduce disruption, stations are staged from off-street sites, to reduce street closures. When street closures are required, the priority is to keep the sidewalks open to the public and close the roadway, as part of Sweden’s strategy of feminist planning: women walk more than men whereas men drive more than women, and so, in conjunction with sidewalk prioritization for snow removal in winter, sidewalks are prioritized during underground disruption.
But most of the time, no street closure is required. Entry halls in developed areas are staged in public plazas and parks or mined via sideways access tunnels. Most stations for Nya Tunnelbanan are located in outlying areas and therefore can be built more easily, in open land near land to be redeveloped or Million Program projects with suitable open space to be used for construction. However, some of Nya Tunnelbanan’s stations are in the urban core of Central Stockholm, as are both of the stations of Citybanan, and yet their costs remain moderate.
The access tunnels are especially elaborate at Sofia, just outside city center. Sofia, built 100 meters below ground, is near the intersection of Folkungagatan, a 23 m wide street, and Renstirnas Gata, a 17 m wide street, but the station is offset to the east of the intersection and access for workers and materials is via service tunnels connecting the cavern to nearby arterial roads. Passenger entry is built in a park.
At Sofia, the access tunnels also double as evacuation routes. The station is so deep that it has no escalator access, only elevator access, but regulations still require timely evacuation of two full trains in an emergency (SLL 2016), to be provided by the elevators themselves in conjunction with emergency stairways and the access tunnels.
The cost of stations is not large. Sofia was a SEK 1 billion contract (Tunnel 2021), despite its depth. The stations for Citybanan, in more central areas underneath older T-bana stations, were not much more expensive; Implenia (2015) reports that a combined contract for the construction of Odenplan and a 2 km tunnel cost €147 million (about SEK 1.3 billion), and the cost of Stockholm City, built in city center beneath the surface intercity station and the two-level T-Centralen metro stop, was estimated at SEK 1.5-2 billion, as was that of Odenplan (Personal Interview D 2021).
One possible explanation for the relatively low cost of complex central stations is the limited dig volume. Odenplan is 250 m long, 25 m wide, and 14 m tall from floor to roof (Mas Ivars et al. 2016), and Implenia (2015) reports the cross-sectional area as 337 m², a total of about 85,000 cubic meters. There is little spare volume: the longest Pendeltåg trains are 214 m. With no cut-and-cover, the total dig volume is substantially lower than it would be if construction had to be done top-down, which would increase the total depth of the dig by a factor of about 2.5. This is related to the hard gneiss rock of Stockholm, which permits cheap mined stations; in Oslo, in contrast, the switch from building Løren cut-and-cover to deep-mining the stations of Fornebubanen is one of the reasons for the higher cost per kilometer of the latter project (Personal Interview A 2020).
This volume is sufficient for future upgrade to four tracks. Currently, Odenplan is a two-track station, matching Citybanan’s two-track capacity. However, in the future, there are plans to expand it to four tracks, so that each tunneled approach track splits into two station tracks, to permit higher capacity in case rush hour dwell times are too long; Stockholm City is already a four-track station.
It is notable that the two stations built for Citybanan only total about SEK 3 billion, less than a fifth of the total value of the project. Interviewees at Trafikverket and SLL instead explain the cost in terms of high additional design costs (2 billion) and a complex underwater tunnel built as an immersed tube in sections, also at 2 billion.
Labor and Wages
SEKO Tidingen, a newspaper published by the 72,000-strong union for railway, communications, and other service workers, profiled the tunnel workers building Nya Tunnelbanan (Lindgren Strömbäck 2021). The worker in focus, Micke Vilhelmsson, lives in Hagfors, an industrial town of 10,000 located 260 km from Stockholm; none of the tunnel workers building the system is a native Stockholmer, and it’s common enough to work abroad that Vilhelmsson spent six years in Norway. EU migration rules are creating an EU-wide labor market, and contractors have explained in a private interview that there’s a growing number of tunnel workers from Eastern European countries, who are subject to the same stringent labor laws as native Swedes when they come to work on Swedish projects. Slovakia and Poland are popular countries of origin for workers.
To house a mobile international and domestic migrant workforce, infrastructure builders provide temporary worker housing; this is also the case for maintenance workers, who are nationally mobile as they may work on track renewal projects anywhere within the country.
The difficult, skilled work leads to very high working-class wages. Stockholm tunnel workers earn SEK 70,000 a month before taxes (Personal Interview F 2021), or about $98,000 a year in PPP terms; the overall cost to the employer is twice that, including social security contributions (amounting to 31.42% of the payroll), temporary worker housing, overheads, and a profit margin on the cost-plus basis used for contracts.
The combination of high wages and a pan-European mobile workforce creates migrant labor dynamics that are not always healthy. A report by LO covering abuses in the 2000s on Citytunneln, Citybanan, and a road tunnel in Stockholm complains about regulatory arbitrage to suppress wages and avoid paying benefits (Jonsson et al. 2014). The report goes into the possibilities for bringing such migrant workers into the union, with a brief comparison to the situation in Oslo (where 40% of unionized building trades workers are Polish or Baltic) and Copenhagen (where it is only 3%).
And yet, the wages quoted are not low: in the 2000s, building workers in Stockholm averaged 190 SEK/hour; migrant workers building infrastructure, who are 45% of the workforce across those three projects, earn somewhat less, 100-150 SEK, but then specialists earn SEK 180-270/hour, the higher figure going to mining workers. Inflation over the last 15 years has not been high, but SEK 270/hour in 2007, when much of LO’s data comes from, corresponds to 320/hour in 2021 price levels, and with economic growth since then, the figure is not far from the SEK 70,000/month quoted to us by a civil servant. LO goes over the quality of housing benefits, and those scale with the class of worker; one worker complained about housing quality and got better housing, and was only fired later after he wanted to join a union.
Doing an exact comparison of labor productivity is difficult because Stockholm uses drill-and-blast for tunnels rather than the globally more common TBMs. However, Sweden has high labor efficiency, as a way of saving money while still spending about $200,000 a year per mining worker. At a given time, there are about 6-8 workers inside the tunnel head in Sweden, and the ratio of white-collar supervisors to line workers is low (per LO, the workforce splits as 70% blue-collar, 30% white-collar); one contractor said that TBMs require more labor-intensive maintenance than drill-and-blast, at least in the context of Stockholm’s rock (Personal Interview F, 2021; Personal Interview I, 2021). Overall, the LO report estimates that the share of labor costs in the contract for Citybanan is 23%, a comparable figure to what we have found in the reports on Istanbul and Italy despite much higher wages paid in Sweden.
6.9 The Nya Tunnelbanan cost overrun
While the absolute cost of Nya Tunnelbanan per kilometer is well below the global median for underground construction, there has been a substantial overrun from the budget. The current budget, SEK 32 billion, is higher than its original budget of 23 billion; this is not common in Sweden, where the retrospective lists of rail and road projects provided by Trafikverket (2017; 2019) show small or no overruns, even on big projects.
Unlike absolute costs of urban rail construction, cost overruns are well-studied in the literature. Flyvbjerg et al. (2003) identify strategic misrepresentation (that is, lying by civil servants and politicians) and optimism bias as underlying causes. Love et al. (2015; 2016; 2018) criticize Flyvbjerg, first arguing that cost overruns properly counted are much lower than Flyvbjerg finds, and second focusing on concrete causes in lieu of abstract issues of lying. Cantarelli et al. (2010; 2022) focus on the problem of early commitment, in which a political commitment to an incompletely designed project incentivizes overdesign and sticking with projects that turn out to be bad (high-cost or low-value) after further work. As a result, Sweden has taken great care to understanding its cost overruns for Nya Tunnelbana, much more so than the absolute costs.
As megaprojects are hotly politically debated, when we inquired regarding the ongoing cost overruns on the Nya Tunnelbana project, there was already a report explaining, written for EU reporting needs. A project progress report from 2021 lists the following changes in costs, in million SEK at 2016 price levels, between 2013 and 2021 (Personal Interview H 2021):
Table 2
| Section | Cost (in 2013 million) | Cost (in 2021 million) | % Increase (based on interviews) |
|---|---|---|---|
| Kungsträdgården-Sofia | kr2,308 | kr3,813 | 0.652 |
| Sofia-Sockenplan | kr4,386 | kr6,857 | 0.563 |
| Sofia-Nacka. | kr7,733 | kr10,214 | 0.321 |
| Odenplan-Hagastaden | kr2,424 | kr2,705 | 0.116 |
| Hagastaden-Arenastaden | kr2,308 | kr2,938 | 0.273 |
| Barkarby | kr3,347 | kr5,286 | 0.579 |
| Total | kr22,506 | kr31,813 | 0.414 |
One reason is that the negotiations with stakeholders took longer than expected, leading to delays; in addition, two of the contracts went to court due to lawsuits by bidders, creating further delay.
However, much of the reason has to do with mid-project changes in environmental regulations. In SLL’s report to the European Investment Bank and in interviews with experts and contractors, the following mid-project revisions were all mentioned as significant delay and cost factors:
- A regulation requiring contractors to dispose of waste rock, which they’ve had to truck to specific sites at high expense.
- A change in the maximum permitted level of water infiltration, which had direct and indirect impact on engineering, and was difficult to communicate with the client and is still leading to slowdowns in tunneling productivity.
A safety requirement for a third service tunnel parallel to the two track tunnels, increasing the amount of tunneling work to be done by almost 50%.
[1] Imputed from 1,265,900 daily riders on a winter workday, from SL 2019, pp. 51, 67.
[2] This point is also made in the retrospective analysis in Börjesson et al. (2014).
[3] In 2017, the year that Citybanan opened, Sweden’s GDP per capita was $45,193 in 2011 PPP dollars. The most comparable year for the analysis in Börjesson, Jonsson, and Lundberg is 1965, the year of opening of the midpoint of the present T-bana network by length, when Sweden’s GDP per capita was $17,239.
[4] See also the coverage of Teicholz’s paper in Garcia 2014.
New York
7.1 Introduction
New York has what is perhaps the world’s largest subway capital program measured by total spending. The Metropolitan Transportation Authority’s (MTA) five-year capital plan for 2020-2024 includes $54.8 billion in expansion, equipment purchase, facilities upgrade, and long-term renewal; of those, the subway’s share is about $37 billion, the rest going mostly to commuter rail projects and to a small extent to buses (Metropolitan Transportation Authority 2019a, pp. 50 & 145). Because the capital program is so large, local media, academics, and think tanks have asked, is the region getting its money’s worth for such a large program?
This case study examines the Second Avenue Subway, a project that spans multiple capital plans over the last 20 years and has been under planning since the 1920s. In 2005, as the present project was waiting for funding, longtime subway rider advocate Gene Russianoff said, “It’s the most famous thing that’s never been built in New York City” (Chan 2005). The full-length project was planned as a 13.7-kilometer line from 125th Street in Harlem to Hanover Square near the southern tip of Manhattan. Without the funding to complete the full line, the project was broken into four smaller, more affordable phases, of which only Phase 1 has been completed. Phase 2 is currently working its way through the engineering stage of the Federal Transit Administration’s (FTA) New Starts program. Phase 1 is a 2.7 km three-station extension of the Broadway Line carrying the Q train along a preexisting tunnel from 57th Street and 7th Avenue to the 63rd Street and Lexington Avenue Station and continuing along a newly-built tunnel to 96th Street and Second Avenue on the Upper East Side.[1]
There it connects to a preexisting tunnel at 99th Street (Figure 1). This short extension opened for revenue service in 2017 and cost $4.6 billion in current year-of-expenditure dollars, or $5.3 billion in 2020 dollars.[2]
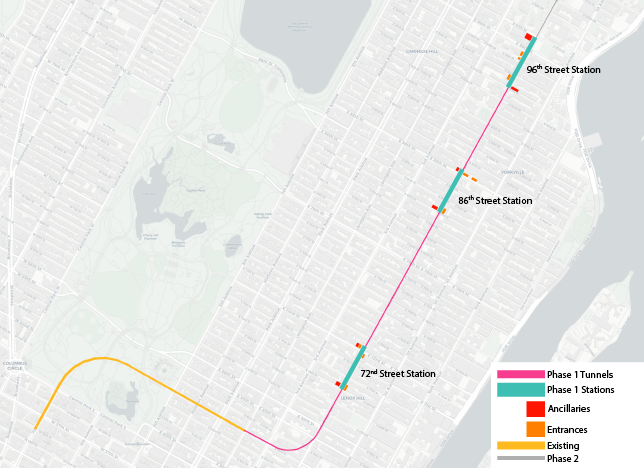
figure 1. Phase 1 of the Second Avenue Subway map.
According to our database of more than 900 rapid-rail transit projects from nearly 60 countries, Phase 1 of the Second Avenue Subway is the most expensive subway built in the world on a per-kilometer basis. This is about 10 times more expensive than the Italian and Swedish subways discussed in our other case studies, and more than 10 times as expensive as the Turkish subways we examined.[3]
Focusing solely on costs, however, misses the enormous benefits produced by Phase 1. In the Final Environmental Impact Study (EIS) (2004), the MTA projected Phase 1 ridership to reach 202,000 riders per weekday, and for the full four-phase build out to serve 560,000 riders per weekday. This high ridership estimate is the result of serving one of the densest neighborhoods in the densest city in the country (New York City Planning n.d.). The projected cost per rider, about $23,000 in year-of-construction dollars and about $26,000 in 2020 dollars, compares favorably to ongoing subway and commuter rail tunnel projects in peer European cities, and far surpasses current American subway and light rail construction projects, such as Los Angeles Metro’s Purple Line Extension Section 1, $83,000 per rider, and Sound Transit’s Lynnwood Link, $50,000 per rider. Prior to the onset of the pandemic, Phase 1 ridership approached 200,000 weekday riders, it successfully alleviated congestion on the Lexington Avenue Line, reduced travel times, and increased adjacent property values (Metropolitan Transportation Authority 2022; Gupta et al. 2022).
New York’s high construction costs, however, make it difficult to justify pursuing projects that produce fewer benefits than Phase 1. At roughly 200,000 projected riders per day, Phase 1 outperforms, on a per rider basis, less expensive projects with fewer riders, such as San Francisco’s Central Subway extension or Washington Metropolitan Area Transit Authority’s Silver Line extension. Phase 2 of the Second Avenue Subway, on the other hand, which is slated to run through East Harlem, also one of the densest urban neighborhoods in the United States with nearly 200,000 people per square kilometer in the areas surrounding the proposed stations, is currently estimated to cost $6.3 billion while serving 123,000 riders per day, producing a cost per rider ratio more than double Phase 1’s (Federal Transit Administration 2022).
As the costs per rider metric increases with subsequent phases of the Second Avenue Subway, the benefit of building those extensions diminishes. This is too bad because until costs decline, the MTA will struggle to add new capacity at more than a few kilometers at a time. If New York were to build rail more affordably, it could reasonably plan and realize projects through less dense neighborhoods where demand is still high, such as the Interborough Express connecting Brooklyn and Queens or extending the W line from Lower Manhattan to Red Hook, Brooklyn, and even attempt to match the scale and vision of Paris’s Grand Paris Express, a combination of rail projects that will add 200 kilometers and 68 stations via extensions of two existing lines and four new automated lines that will connect the inner suburbs. Grand Paris Express has seen its costs increase over time, but the current estimate is €36.1 billion in 2012 euros or $270 million/km in purchasing power parity (PPP)-adjusted 2020 dollars. With ridership expected to reach two million per day across the new services, Grand Paris Express will achieve a cost per rider comparable to Phase 1 (Vie publique 2020).
Our interest in the Second Avenue Subway, thus, stems from two overarching concerns. First, what is it about New York and more broadly the United States that makes it so expensive to build transit infrastructure? Second, if we are serious about getting people out of cars and accommodating population growth in New York and other American cities, we need to build extensive transit networks that connect major activity nodes, such as neighborhoods with housing, jobs, schools, and other amenities (Daganzo 2010). New York already has a developed transit network, but as more people move to the city and neighborhoods just beyond the reach of the subway, such as St. Albans and Maspeth in Queens, the transit system needs to expand.
Until the MTA can build transit for less, it will be difficult to add new infrastructure at a rate that keeps up with historical population growth trends. This is all the more critical as New York seeks to implement congestion pricing, upgrade its public realm, and reduce carbon emissions by 80% by 2050 (New York City Mayor’s Office of Sustainability 2014).
Overall, the remainder of this report is divided into a narrative description in Section 2 detailing the history of the project from aborted past attempts to the successful Phase 1 opened in 2017, analysis in Section 3 based on our review of project-specific documents, media accounts, and more than 80 one-on-one and group interviews with contractors, manufacturers, risk assessors, lawyers, cost estimators, sub-contractors, designers, engineers, laborers, suppliers, current and former MTA executives and staff members, current and former transit agency executives and staff members outside of New York, local officials who interacted directly with the project, and advocates, and a brief conclusion in Section 4. After completing our research, we identified four broad areas that drove costs by adding schedule delay, calling for more expensive construction techniques, relying on costly inputs, and sacrificing productivity:
- Intergovernmental coordination and utilities
- Labor wages and staffing
- Procurement and risk
- Station design
Stepping back, however, and examining the New York case in the context of our other cases and broader research, we believe that uncertainty and a lack of leadership and funding certainty at the state, local, and agency level enables the MTA’s costs to outstrip those found in Istanbul, Italy, and Stockholm.
The good news is that it is possible to reduce subway construction costs in New York; in our project overview, which includes our main findings and recommendations based on all of our cases, we go over more direct comparisons suggesting that if Phase 1 of the Second Avenue Subway had been planned, designed, managed, and constructed using similar methods to those found in our lower cost cases, its costs could have been reduced by as much as a factor of 8 to 12. Achieving these savings, however, is politically and administratively contentious.
Project timeline
7.2.1 Early planning and navigating the FTA
The Second Avenue Subway had been planned many times before; in the 1970s, it was partly built, before the city’s near bankruptcy forced construction to a halt. However, the project as built dates to 1988, when a group of MTA rail service planners recommended building a version of the Second Avenue Subway that would tie into the Broadway Line and extend from 63rd Street to 125th Street in Manhattan and continue to the Bronx (Figure 2) (Plotch 2021, pp. 124-132).[4]
The need for a Second Avenue Subway looked obvious: the parallel Lexington Avenue Line was the only north-south line on the East Side of Manhattan, and was crowded beyond capacity at rush hour (Metropolitan Transportation Authority 2001). But this group of planners recognized that no extension of this size had been completed since the opening of the 6th Avenue Line in 1940 (Regional Plan Association 2018; English 2021).[5] Just as earlier iterations of the Second Avenue Subway had struggled to be completed, it was uncertain that the agency could figure out how to both expand and maintain its aged and sprawling subway network simultaneously.
As the planners expressed skepticism about the agency’s ability to build a Second Avenue Subway, David Gunn, the President of the New York City Transit Authority, fought for its inclusion in the MTA’s Twenty Year Capital Needs Assessment: 1992-2011.[6] With champions inside of the MTA fighting for the Second Avenue Subway and the city and state’s fortunes improving after near bankruptcy in the 1970s, New York State, in 1991, allocated $22 million to update previous plans and designs from the 1960s and 1970s (Finder 1991). Even with this vote of confidence, there was a competition for resources as other operating agencies within the MTA, the Long Island Rail Road and Metro-North Railroad, also pursued large-scale megaprojects.
In 1995, the MTA began the $5.4 million Manhattan East Side Transit Alternatives Study (MESA). By not including Second Avenue Subway in the title of the study, the MTA wasn’t bound to anything specific, which was important because few believed the Second Avenue Subway would arrive anytime soon. Norman Silverman, a Senior Director of Route and System Planning at New York City Transit (NYCT), described the likelihood of building a full-length Second Avenue Subway to The New York Times (Kennedy 1995) as on the “outer bounds” of possibility.
With little hope of building a full-length Second Avenue Subway, the MESA study analyzed four alternatives, none of which included a full-length Second Avenue Subway. Two of the four alternatives did include a semblance of it. One proposal called for the extension of the Broadway Line from 63rd Street to 125th Street along Second Avenue. This was similar to what the planners discussed back in the 1980s, but this time, the project would terminate in Manhattan rather than carry on to the Bronx. The second proposal included the Broadway Line extension and added a mostly at-grade light rail from 14th Street down to the Financial District. While no one would mistake this alternative for the full-length Second Avenue Subway—in fact both options were roundly criticized as being inadequate—the addition of the at-grade service was an attempt to serve the length of the island without breaking the bank (Personal Interview NY A 2022). One New York City Deputy Mayor believed that the final cost for the full-length Second Avenue Subway Cost could surpass $20 billion (Lueck 1999). The MESA study estimated the cost of the 63rd Street to 125th Street subway extension at $3.88 billion and the light rail build out at an additional $1.21 billion (MacFarquhar 1999; MESA 1999, p.2-27).[7]
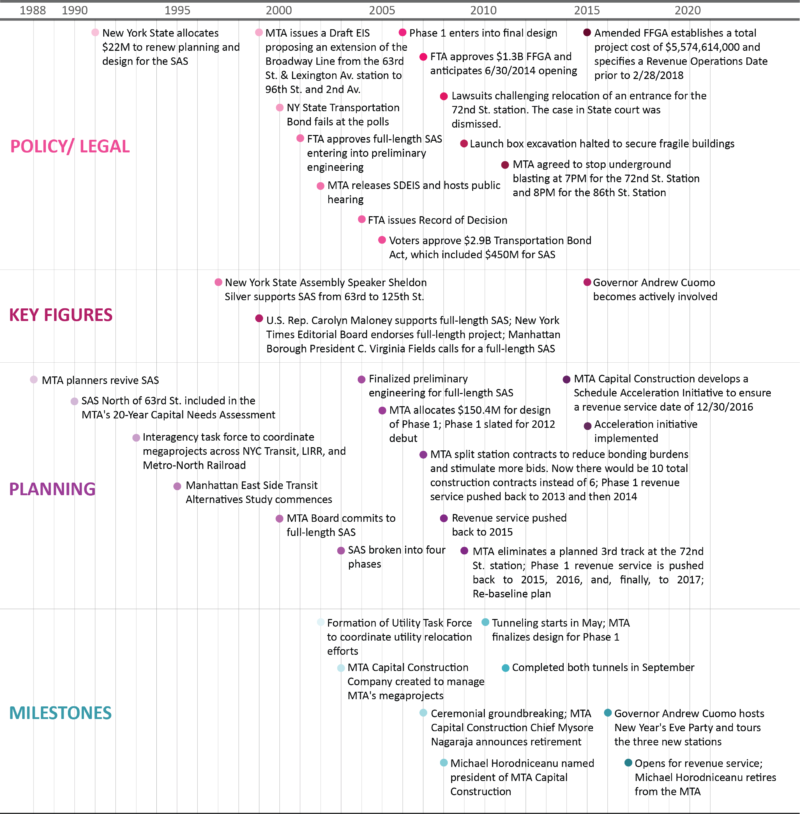
figure 2. Phase 1 of the Second Avenue Subway timeline: Policy, key figures, planning and milestones.
At the same time that these options were recommended, United States Representative Carolyn Maloney, Manhattan Borough President C. Virginia Fields, and The New York Times called for a full-length Second Avenue subway rather than a “stubway” north of 63rd Street. The primary sticking point for the MTA was money. The MTA couldn’t build a full-length Second Avenue Subway, LaGuardia Airport subway extension, and Governor George Pataki’s preferred project, East Side Access, without more money.[8] While the public supported a full-length subway, it didn’t support higher fares to pay for it. Similarly, Governor Pataki was loath to raise taxes or reallocate money from the State’s budget to finance a subway project in New York City, a city where he failed to win even 40% of the vote in either 1994 or 1998 (New York State Board of Elections 1994; New York State Board of Elections 1998).
In negotiating the New York State budget in 2000, State Assembly Speaker Sheldon Silver, who represented the Lower East Side, tipped the scales in favor of a full-length Second Avenue Subway. According to the New York Times (Perez-Pena 2000), Silver vowed “that there would be no state budget… until the Pataki administration commits to building the Second Avenue Subway the full length of Manhattan, and to a big increase in the state’s contribution to the project’s costs.” Once Silver forcefully joined the side advocating for a full-length Second Avenue Subway, Governor Pataki capitulated. Within weeks of Silver’s ultimatum, the governor and the legislative leaders agreed on a state budget, and capital programs for both the MTA and state highways. The MTA would allocate $1.05 billion in its 2000-2004 capital program for the Second Avenue Subway environmental review, design, and engineering in preparation of an Environmental Impact Statement (EIS) for the full-length route (Department of Transportation and Related Agencies 2002; Plotch 2021, 155).
Even with this concession from the Governor, the MTA still needed billions of dollars to build a full-length Second Avenue Subway. Over the course of 2001 and 2002, the MTA hired DMJM-Harris and Arup for $187 million to complete preliminary and final engineering and design documents (Lee 2002).[9] Now that the MTA had decided a full-length Second Avenue Subway was its preferred option for Manhattan’s East Side, it released a Supplemental Draft Environmental Impact Statement that outlined a 16-station 13.7-kilometer project from 125th Street to Hanover Square that would cost $16.8 billion, or $19 billion in 2020 dollars, and be completed by 2020 (MTA New York City Transit 2001; Federal Transit Administration 2002; Bennett 2008).[10]
With the contours of the project settled, the MTA moved into preliminary engineering and finalizing its EIS so that it could tender construction contracts in 2004. The only roadblock, at this point, was money. The MTA still needed to cobble together funding from state, local, and federal sources to proceed.
The Federal Transit Authority’s (FTA) New Starts program is the main federal program to fund transit-infrastructure projects. In order to qualify for a Full-Funding Grant Agreement (FFGA), applicants, usually a transit agency, submit projects that have passed through an Alternatives Analysis, Preliminary Engineering, and Final Design. Along the way, the FTA judges submissions and approves projects to move through the project-development process based on measures of mobility improvements, environmental benefits, operating efficiencies, cost effectiveness, land use, and other factors (Federal Transit Administration N.D.).
In 2002, while the full-length Second Avenue Subway project was still in the Preliminary Engineering phase, the MTA’s proposed grant request from the FTA was for $8,385,000,000, 50% of the projected total. While the FTA recommended funding the project, the MTA’s request was nearly four times greater than any of the almost 40 requests from project sponsors still in the preliminary engineering phase of development.[11]
During fiscal year 2003, the FTA called for funding slightly less than $1.2 billion for 34 projects (Figure 3).[12] If we assume that a full length Second Avenue Subway would be in construction from 2004 through 2020, the FTA would have to allocate close to $500 million per year, on average, for just the Second Avenue Subway. The project’s core benefit, alleviating congestion on the Lexington Avenue Line, was not a factor the FTA considered in its assessment. While the overall project rating was ranked medium-high, it scored “low” on the cost-effectiveness measure, which was based on projected new riders net of riders diverted from the Lexington Avenue Line and other mass transit lines (Federal Transit Administration 2002).
The MTA made two adjustments to combat these challenges on its way to securing an FFGA in 2007. First, the MTA lobbied the FTA to alter its cost-effectiveness metric to include the benefits of mitigating crowding on existing lines. Second, the MTA broke up the project into four smaller phases to reduce the size of the initial request to the FTA (Plotch 2021, pp. 172-175). The proposed Second Avenue Subway Phase 1 project would tie into the existing Broadway Line and run from 63rd Street and Lexington Avenue to 96th Street and 2nd Avenue. Its estimated cost was $3.883 billion, excluding financing, and the MTA sought $1.3 billion from the FTA (Neuman 2007; Urban Engineers 2007a).[13]
These changes paid dividends. According to a revised 2007 Phase 1 assessment by the FTA, the FTA ranked the overall project “high” and amended its cost-effectiveness rating from “low” to “medium-high.” The Cost per New Rider was still high, $170.32, but the newly included Cost per Hour of Transportation System User Benefit measure was low, $14.16 (Federal Transit Administration 2007).[14]
Even though the MTA published its Final Environmental Impact Statement and received a Record of Decision in 2004, the project remained in limbo because it was still uncertain how the MTA would pay for it. The FTA had not committed to an FFGA and the State of New York was unwilling to ratify the MTA’s requested 2005-2009 capital program, which called for $27.8 billion with $1.4 billion for Phase 1. The State, instead, approved a $21.1 billion capital plan with $2.4 billion to be spread across East Side Access, Second Avenue Subway, and a rail link between Lower Manhattan and JFK airport (Chan 2005; Metropolitan Transportation Authority 2006). The MTA pressed forward under these challenging circumstances, partially of its own making, recognizing that securing the funds to build Phase 1 would depend upon debt and shifting around other pools of money.
Despite these less than favorable conditions, the MTA’s funding picture did become clearer in 2005, 2006, and 2007. It didn’t receive the $1.4 billion infusion it had hoped for from the State, but, in November of 2005, after the State had approved the smaller capital plan, New Yorkers voted for a $2.9 billion Transportation Bond Act that funneled $450 million to Phase 1 (Nobbe and Berechman 2013). Now that the MTA’s local contribution to the project was firmer, the FTA allowed the project to advance into Final Design.[15] In 2007, three years after the MTA submitted its EIS and received a Record of Decision from the FTA, the FTA announced it would provide $1.35 billion to support Second Avenue Subway Phase 1 construction. Even with the FTA’s $1.35 billion commitment, the three-year gap between the Record of Decision and the FFGA meant that the MTA had to push back the opening date of the project to 2014 and escalate its cost projections.
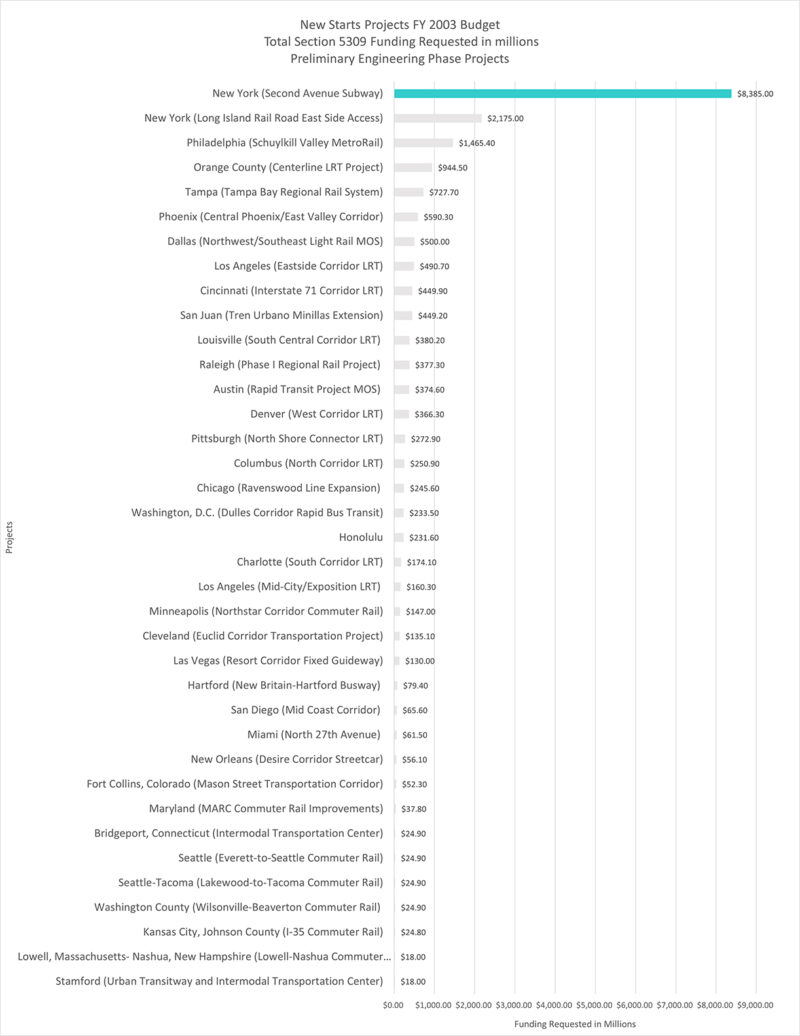
figure 3. FTA grant requests, Fiscal Year 2003.
7.2.2 The contracts
Second Avenue Subway’s construction costs eventually amounted to $3.16 billion across 10 construction contracts and an additional $656 million over two design and engineering and construction management contracts (Table 1).
This was not intended from the start. In 2007, when the FTA and MTA agreed on the $1.35 billion FFGA with a revenue service date of June 30, 2014, the Phase 1 project scope included 2.7 kilometers of subway from 63rd Street to 96th Street, tail tracks for train storage, three new stations, a renovation of the 63rd Street Station, track and signal power systems, and 68 new rail cars (Figure 4). The initial breakdown of construction contracts included six packages: Tunneling, 96th Street Station, 63rd Street Station, 72nd Street Station, 86th Street Station, and Systems (Urban Engineers 2007a). In this iteration of the project scope, the 72nd Street Station was designed to have three tracks, and 86th Street and 96th Street were planned as two-track stations with island platforms.
With these details in place and funding more secure, the MTA moved forward with two contracts. The first contract, the first of six proposed construction contracts, was a Tunnel Boring Machine (TBM) Tunnels contract that included a launch box for the TBM, twin-bore tunnels and two vertical shafts for station construction at 69th and 72nd Streets. The $337 million 40-month contract was awarded to S3 Tunnel Constructors (S3). The joint venture was made up of Schiavone Construction, J.F. Shea, and Skanska (Metropolitan Transportation Authority 2011). In addition to the winning bid, the MTA received only one additional $495 million bid. Both bids exceeded the MTA’s $290 million cost estimate (Urban Engineers 2007b; Rosenthal 2017).[16] The second contract was an $80.9 million Consultant Construction Management (CCM) contract with PB Americas to provide 91 months of construction management services, which include managing construction activities, coordinating between contractors and agencies, and performing inspections and documenting non-conformances (Urban Engineers 2007c).[17]
Table 1. Phase 1 of contracts, proposed and actual budgets and timelines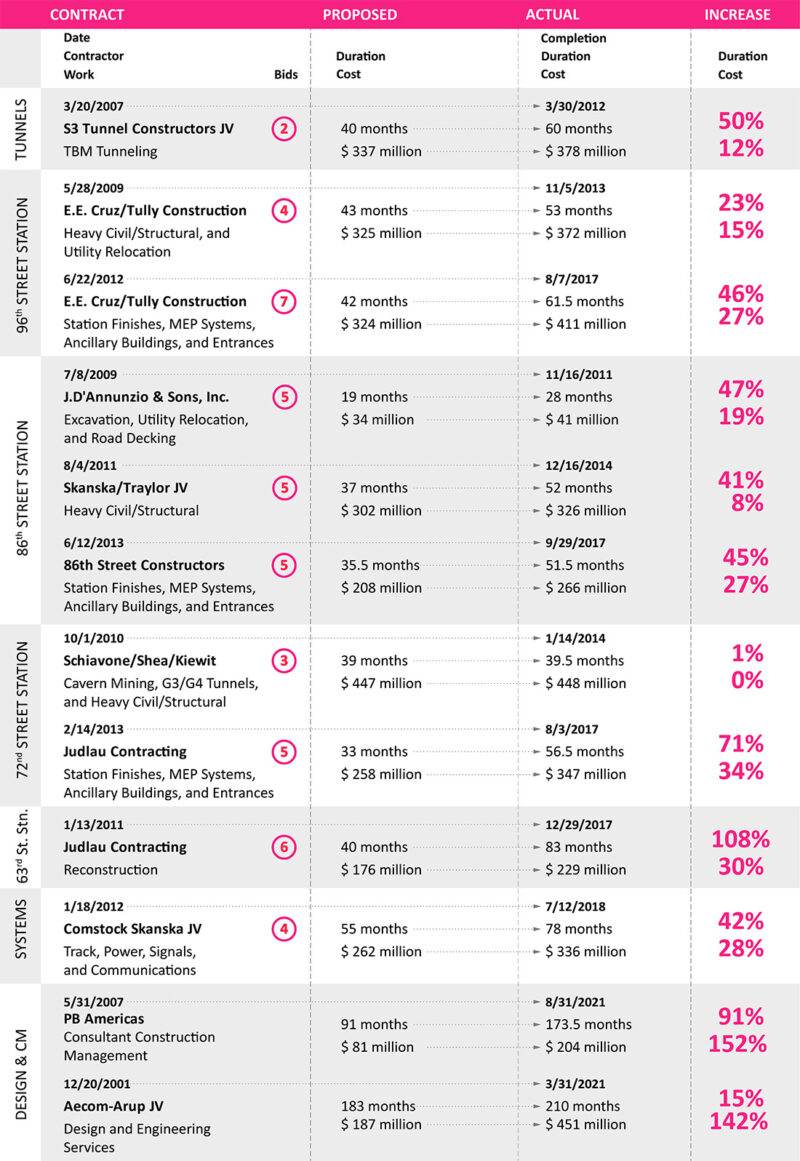
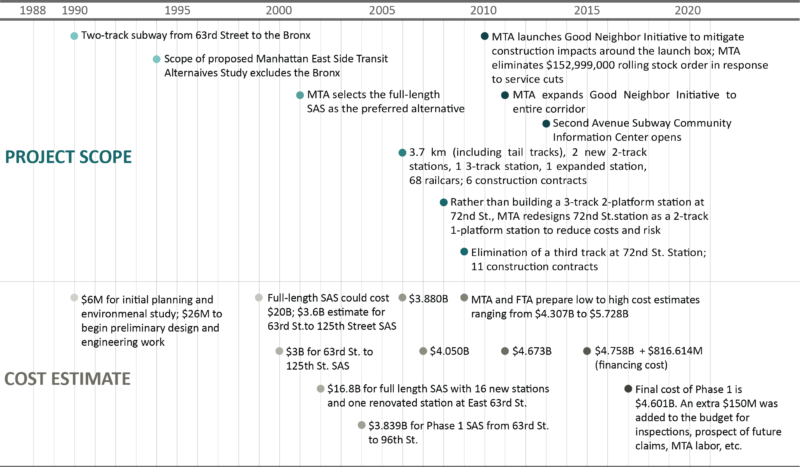
figure 4. Phase 1 of the Second Avenue Subway Timeline: Scope and cost estimate.
As soon as the project began things changed. While change is common on large-scale, multi-year projects, especially ones that rely on notoriously inaccurate as-built drawings for underground utilities, these changes invariably add costs and delay. At this early date in the project, the changes were largely programmatic, though the tunneling contract was delayed by the discovery of an unanticipated subsurface wall and utilities while relocating utilities to dig the launch box. Over the course of 2008, the anticipated revenue service date slipped from June 2014 to June 2015 to March 2016 because of contract repackaging and tunneling delays (Urban Engineers 2007c; Urban Engineers 2008a; Urban Engineers 2008b).[18]
First, the MTA broke the three station contracts into smaller packages to reduce the value of each contract to ensure bidders could secure payment and performance bonds and bid on the packages.[19] The MTA initially proposed going from six to nine contract packages before determining the ideal number of construction contracts was 12. This was later revised to 11, before settling on 10 construction contracts in 2010. The basic contract framework was: TBM tunneling and access shafts at 69th and 72nd Street, 63rd Street Station rehabilitation, systems, and then, finally, instead of one contract per station, as was initially planned, each of the three new-build stations would have three contracts each (Urban Engineers 2008b).[20] Second, in going from six construction contracts to 12, the CCM and the Design contracts had to be adjusted to account for the expanded coordination responsibilities, the redistribution of components and tasks from six to 12 contracts, and rephasing the bidding and construction sequence of each contract (Urban Engineers 2008b). In the case of the CCM contract, it had to be modified to account for the greater coordination responsibilities across 12 contracts. By December 2008, the value of the contract had increased from $80.9 million to $91 million.[21] Third, in 2008, the MTA redesigned the 72nd Street Station. The new design reduced the number of tracks from three to two and platforms from two to one. This change limited construction risk by reducing the overall station-cavern’s width from 30 meters to 21 meters and cut costs by an estimated $90 million, though the redesign work triggered a $26.5 million change order (Urban Engineers 2009a; Urban Engineers 2009b; MTA Capital Construction 2008).
7.2.3 The stress of construction
Decades-long capital projects invariably have the bad luck of overlapping with natural disasters, broader economic downturns, pandemics, and other unforeseen events. Phase 1 of the Second Avenue Subway construction started just as the price of commodities rose in 2008. In adjusting to the economic downturn, the MTA estimated that the costs of its megaprojects, including Second Avenue, East Side Access, and the Fulton Street Center, had increased by $1 billion dollars, from $15 billion to $16 billion. MTA Board Chair Dale Hemmerdinger tried to explain the additional costs, in part, by pointing out that “[t]he prices of steel and concrete, materials the MTA needs in bulk, have jumped 91% and 25% respectively” (Donohue 2008).[22] Thus, in 2008, as the State was finalizing the state budget and the MTA capital program, the MTA reviewed its projects and announced that the new cost estimate for Phase 1 of the Second Avenue Subway had increased to $4.347 billion (MTA Capital Construction 2009).
After receiving an FFGA in 2007, construction of Phase 1 began in earnest; however, early on, construction mostly meant relocating utilities and preparing to dig the launch box between just south of 95th Street to just south of 92th Street. Programmatic delays hampered the start of the construction phase, but once construction began and more contracts were tendered, the project encountered additional kinds of delays and cost drivers: namely interruptions to construction because of fragile buildings that needed repairs, support, and structural strengthening; unexpected ground conditions that required ground freezing to allow the TBM to drill safely; complaints about noise and air quality from blasting station caverns; and ongoing design changes such as the entrances of stations, ancillary facilities, and the overhaul of the 72nd Street Station design. Navigating these challenges would have been difficult regardless, but the lack of comparable subway-building experience in New York did not help things along, even with a growing team of consultants who took on final design, construction support, constructability reviews, construction management, and coordination responsibilities.
The MTA did have people working on Phase 1 who had worked on the 63rd Street immersed-tunnel project crossing the East River that opened in 1989 and new station projects. Additionally, some of the contractors had worked on projects in D.C. and Boston, but no one had immediate experience managing a project like Second Avenue. Furthermore, several people told us that the pre-construction work suffered from minimal engagement with property owners and relied on others to resolve challenges, like having the New York City Department of Buildings (NYC DOB) enforce code violations and contractors to implement construction methods that could achieve adequate excavation rates without disturbing fragile building foundations in the construction zone all delayed construction at the most inopportune time: once contracts had already been signed and construction was underway (Personal Interview NY A 2021; Personal Interview NY C 2022; Personal Interview NY D 2022; Personal Interview NY E 2022).
While New York is not as old a city as Rome, Istanbul, or Athens, it does have buildings in need of repair. During construction of the TBM launch box in 2009, S3 Tunnel Constructors was prepared to begin using drill and blast techniques to excavate the launch box, when NYC DOB issued emergency vacate orders and required building owners to stabilize their buildings before allowing anyone to return to the buildings or for blasting to proceed (Horodniceanu 2009; NYC Department of Buildings 2009).
Even though blasting had been prohibited, work moved forward. S3 reverted to slower mechanical methods of excavation, such as hoe ramming and rock drilling. Whether or not construction of the launch box caused damage to the buildings, there were building violations predating the start of construction, the tunneling contract was now six-and-a-half months behind schedule and each day of delay exposed the MTA to $30,000 to $60,000 in claims from the contractor. The MTA agreed to pay $785,000 to shore up the buildings and avoid additional delays and $1,200,000 to continue excavation using slower methods (Metropolitan Transportation Authority 2010; Metropolitan Transportation Authority 2011a).
Even as the pace of the launch box construction slowed, the MTA pressed ahead with two more contracts in 2009. First, in May 2009, an E.E. Cruz and Tully Construction joint venture was awarded a 43-month $325-million contract to build the 96th Street Station box, relocate utilities, and ancillary facilities, and rehabilitate and retrofit the existing tunnels running from 99th to 105th Street (Urban Engineers 2009c). Even though only two bidders submitted proposals for the first contract, this contract received four submissions. Initially, Perini/Tutor Saliba had been selected, and it was anticipated that the contract would be awarded in January 2009, but concerns about the group’s performance on other projects disqualified them and delayed the award (Urban Engineers 2009b). In July, J.D. Annunzio & Sons was awarded a 19-month $34-million contract to provide utility relocation, road decking, and vertical starter shafts for construction of the 86th Street Station (Urban Engineers 2009d). The MTA received five bids for this contract, and three of them came in under the revised $41 million estimate (Urban Engineers 2009e).
After three years of relocating utilities, fixing and stabilizing buildings, and, finally, digging the capacious 244-meter-long by 18.9-meter-wide by 19.8-meter-deep launch box, in May 2010, the first TBM drive began (Urban Engineers 2010a; Tirolo Jr. et al. 2013).[23] S3 Tunnel Constructors used a $25 million reconditioned 485-ton Robbins Main Beam 6.7-meter diameter TBM christened Adi. Over the course of 16 months and an average advance rate of 15 meters per day, S3 dug the northbound and southbound tunnels, a combined 4,600 meters (Urban Engineers 2011a; Urban Engineers 2011b). As with every other aspect of this project, uncertainty and change loomed large at the outset of the TBM drive.
While digging the starter tunnels for the TBM, S3 determined that the ground conditions on the east side of Second Avenue differed from the hard-rock conditions described in the geotechnical baseline report and were unsuited to its hard-rock TBM. Rather than getting a new machine designed to bore through softer ground, S3 initiated a ground-freezing program to make the ground conditions between 90th and 91st Streets more conducive to using a hard-rock TBM (Urban Engineers 2010b; Robinson 2011; Tingley 2012). [24] Since the tunneling contract was behind schedule and ground freezing would take three months to complete, S3 ended up tunneling the west tunnel first and extending the TBM drive 675 meters to 65th Street.[25] In addition to triggering design changes, re-sequencing tunneling operations, and modifying contract packaging, S3 received $18.7 million in Additional Work Orders (AWOs) for tunneling work; $6.6 million for ground freezing above the east tunnel, and $2.6 million for drilling through the freeze zone and construction of a concrete inner liner (Metropolitan Transportation Authority 2011b MAY; MTA Capital Construction 2011; Urban Engineers 2011c).
As ground freezing plans were being drawn up, the MTA received three bids for the 72nd Street Station Cavern contract. Two of the three bids came in under the MTA’s $448 million estimate; however, one bidder informed the MTA that it had made a computational error, which led to its bid being 29% less than the estimate. This contract, in particular, had its scope reduced by about $150 million over the course of repackaging and reallocating scope because of the decision to eliminate the third track at 72nd Street and by adding the 675 meters of tunneling to S3’s contract (Urban Engineers 2010c). The MTA selected Schiavone, J.F. Shea, and Kiewit’s (SSK) 39-month, $447,180,260 bid (Urban Engineers 2010d).
2011 was a busy year for Phase 1 of the Second Avenue Subway. S3 completed tunneling both the northbound and southbound tunnels, the MTA awarded two more station-construction contracts, and J.D. Annunzio & Sons completed its utility relocation and starter shaft work for the 86th Street Station. In January, the MTA awarded a 40-month, $176 million 63rd Street Station retrofit contract to Judlau (MTA Capital Construction 2011a). In August, Skanska/Traylor JV beat out four other bids and was awarded the 37-month, 86th Street Station cavern and heavy civil contract for $302 million. The Skanska/Traylor bid came in at nearly $100 million under the construction cost estimate and $33 million less than the next lowest bid. Even though the MTA received these bids in February, the Skanska/Traylor submission needed additional clarification to ensure it complied with Buy America, which delayed approval until August (Urban Engineers 2011a).
7.2.4 Localized impacts
In addition to reaching meaningful project milestones in 2011, there was increased public pushback as construction impacts became unavoidable. General complaints about garbage, noise, and disruptions were amplified by more specific complaints about drilling and blasting the 72nd Street Station’s cavern. The MTA instituted three broad changes in response to greater scrutiny. First, the MTA extended its Good Neighbor Initiative to the entire construction zone. The Good Neighbor Initiative began as an effort to make the launch-box area tidier by increasing garbage collection, installing additional wayfinding signage, wrapping the construction-zone fencing, and tending to local businesses’ concerns. Second, the MTA launched a community outreach effort to address the concerns of those living within the construction zone. This effort included opening a community outreach center on second avenue and holding quarterly public meetings to solicit feedback about how it could better mitigate construction impacts (Heckscher 2011; Metropolitan Transportation Authority 2012a). Third, the MTA decided to reduce the blast window for heavy construction from 18 hours to 12 hours (MTA Capital Construction 2011b). In addition to limiting the blasting schedule, SSK, the joint venture building the 72nd Street Station, was tasked with improving efforts to contain the dirt and dust impacts from blasting, which, inadvertently, got worse as the blasting schedule became shorter and reduced the gap between blasts (Sharp and Zimmer 2011).
Responding to neighborhood concerns is critical to managing a project like Phase 1. Addressing these concerns, however, comes at a cost. In late November, the MTA halted blasting at the 72nd Street Station construction site for two weeks while the contractor figured out how to address these concerns. This was in addition to restricting the blast schedule, which meant change orders: SSK received $2,175,000 for rescheduling construction 72nd Street Station, and Skanska/Traylor agreed to a $5,200,000 change order for the 86th Street Station work (Metropolitan Transportation Authority 2011b; MTA Capital Construction 2013 Q1).[26] In addition to these efforts around blasting, the MTA paid the CCM $1,117,100 to conduct air quality studies at the 72nd Street and 86th Street Station sites and develop a mitigation strategy (Metropolitan Transportation Authority 2012b). Expanding the Good Neighbor Initiative to the entire work zone cost an additional $3,716,340 (Metropolitan Transportation Authority 2012a).
While 2012 and 2013 saw the MTA finalize the four remaining Phase 1 construction contracts, in 2012, New York State committed to funding, or, more accurately, allowing the MTA to take on more debt to fund the missing $13 billion from its capital plan. Funding for Phase 1 stretches across multiple capital plans, but the 2010-2014 plan accounted for about $1.5 billion of the project’s local match, which by 2012 was projected to be around $3 billion (Haughney 2012; Urban Engineers 2015a). By securing these funds, uncertainty about how to pay for the four remaining contracts, mainly station finishes contracts, was put to rest. Since large capital construction projects like Phase 1 are carried out in stages, it is not critical to bid out every contract at the same time; however, uncertainty over funding can lead to tendering delays, which inevitably, at its most benign, lead to inflation-driven cost escalation and schedule delay, which was a frequent concern of the Project Management Oversight Consultant (PMOC) retained by the FTA to monitor the project (Urban Engineers 2012a, p.4).
Even after securing the funding to pay for Phase 1 construction, the MTA still needed to manage construction mishaps, community objections to specific station locations, and Superstorm Sandy, which wrought more than $5 billion in damage to the existing subway system (Metropolitan Transportation Authority 2013a). While the MTA had taken precautions to minimize the impacts of mining station caverns and shafts—restricting the blast schedule, studying the air quality along the corridor, and improving muckhouse facilities and dust collection—in August 2012, while excavating a 22.5 meter by 22.5 meter shaft for the 72nd Street Station, an errant blast sent a steel deck plate used to secure the site rocketing into the air. Fortunately, no one was injured, though there was some property damage. The MTA immediately suspended all work at the site while it investigated the incident and addressed shortcomings in its blast monitoring (MTA Capital Construction n.d.).
Blasting challenges aside, the MTA faced fierce pushback from building owners when it came to siting entrances for the 72nd Street and 86th Street stations. Three years after finalizing Phase 1 designs and awarding the 72nd Street Station construction contract, the MTA moved the 72nd Street Station entrance planned for 301 East 69th Street to the sidewalk. Rather than wrestling with unwieldy utilities and a disgruntled co-op board, the MTA took advantage of a new bicycle lane along Second Avenue to gain approval from the New York City Department of Transportation (NYC DOT) to use the sidewalk for two entrance canopies (Chung 2004; Federal Transit Administration 2013). As with all midstream changes, this change cost money: the MTA approved a contract modification for $9,470,000 in 2019 including compensable delays from this redesign (Metropolitan Transportation Authority 2018).
At 86th Street, Yorkshire Towers filed a second lawsuit challenging the location of two sidewalk entrances sited on either end of the building’s horseshoe-shaped driveway. While this lawsuit was dismissed, again, the localized impact and reception of Phase 1 was not uniform in New York and along the corridor. Joseph Ceccarelli, one of the lawyers representing Yorkshire Towers, captured the mixed reception of the project when he told DNAinfo (Zimmer 2011) during the initial lawsuit that “‘We’re not against the Second Avenue subway. We’re New Yorkers. We need it,’ Ceccarelli said. ‘We’re just against the siting of the entrance.’”
Superstorm Sandy wreaked havoc on the existing subway system causing billions in damages. Its immediate effect on the Second Avenue Subway was less catastrophic. Following the damage done to the recently opened $530-million-dollar South Ferry Station, which required another $340 million in repairs, Sandy prompted design changes meant to protect against similar storms (Rivoli 2017). This meant redesigning elements vulnerable to flooding, such as station entrances, manhole covers, sidewalk ventilation grates, and entrances to ancillary buildings rather than rebuilding tunnels and stations (Taylor et al. 2019).
7.2.5 Managing contract interface challenges
In 2014, seven years after construction started, more than 50% of the project had been completed. The MTA’s focus shifted from tendering contracts to closing them out, transitioning from initial contract construction milestones to access dates for the later contracts, coordinating interfaces, and figuring out how to meet the target revenue service date of December 30, 2016. The 86th Street utility relocation contract and the tunneling contract wrapped up in 2011 and 2012. At the end of 2013, the 96th Street heavy civil structural contract achieved substantial completion (Urban Engineers 2013). Similarly, 2014 was bookended by the completion of the 72nd Street Station heavy civil structural contract in January and the 86th Street heavy civil structural contract in December (Urban Engineers 2014a; Urban Engineers 2014b).
Since Phase 1 had 10 construction packages, and basically followed a structure of one contract to build the station box and another for finishes, the integration of these workflows determined the schedule. Slippage in the station-construction contracts, meant slippage in the finishes contracts, and slippage in the systems contract, all of which threatened the December 30, 2016 revenue service date target. Plotch (2020, pp.233-234) details these contract interface challenges when he describes the difficulties encountered by systems contractor Salvatore DeMatteo:
DeMatteo began installation where he could, but he had to wait until many other contractors completed their assignments. His workers needed to connect equipment to permanent power supplies that were not yet available, and to install cables through conduits that had yet to be put in place. His team could not hang antennas until ceiling panels were installed or connected heat detectors to elevators that had not been lowered into stations.
Even though there had been delays since 2007 and half of the construction contracts had achieved substantial completion, now that 2016 was only a year or two away, it was hard to picture a scenario where everything was delivered on time. In September 2015, the PMOC (Urban Engineers 2015b SEPTEMBER) warned that “[e]ach of the five remaining construction contracts has experienced significant delays,” and “there is diminishing evidence to support [MTA Capital Construction’s] position that it can achieve the [revenue service date] by December 30, 2016.”
7.2.6 December 31, 2016 or else
At the start of 2016, the MTA implemented a $66 million acceleration program to ramp up construction, testing, and management efforts to open Phase 1 of the Second Avenue Subway on time. The MTA agreed to pay an additional $17.5 million to extend shifts, work weekends, add laborers, and establish specific contract milestones to complete the 72nd Street Station so that testing and training could begin on September 1, 2016. The MTA repeated this process by paying an additional $18.5 million to finish the 86th Street Station, $14 million to close out the 96th Street Station, and $16 million to ensure the systems contractor installed all 22,000 linear feet of track, communications systems, and traction power (Metropolitan Transportation Authority 2016a; Personal Interview NY F 2022).
While more money meant more laborers, greater productivity per day, and more support for construction, the other catalyst for completing the project on time was Governor Andrew Cuomo. Even though Governor Cuomo was first elected governor in 2010, he became interested in the project in late 2015. In our interviews, a number of people told us that the governor pushed every button and pulled every lever to get the project done before the close of 2016 (Personal Interview NY B 2021; Personal Interview NY C 2021; Personal Interview NY D 2021; Personal Interview NY F 2022; Personal Interview NY G 2022). One senior consultant who had been hired in 2015 to help complete the project on time told us that transit projects move slowly because coordinating across a handful of general contractors and dozens of subcontractors and vendors requires waiting. During Phase 1’s acceleration period, however, there was a palpable urgency to get things done; thus, instead of taking weeks and months to make a decision about who would move a conduit or pour concrete or fix a problem with the escalators and elevators, “people were jumping on planes [from across the country and globe] to get the job done the next day” (Personal Interview NY F 2022). Without the governor’s direct involvement, Phase 1 would not have opened on time, but, as Plotch (2022, pp.234-235) explains, getting things done on time came at an enormous cost to the MTA’s other priorities:
When making decisions about the Second Avenue subway, MTA officials always had to balance various factors, including budget, schedule, and quality. Cuomo changed the MTA’s priorities to emphasize speed. As a result, some factors were deemphasized, such as NYC Transit’s concerns about maintainability, budget officials’ worries about cost overruns, and engineers’ expectations that they would thoroughly test every single component. The governor’s insistence on meeting the New Year’s deadline would consume the MTA as it turned its attention from other projects, other escalators, and other signal systems.
Once the governor decided that the project had to open by the end of 2016, he elevated the project schedule above everything else.
Even though the Second Avenue Subway’s alignment is entirely underground, Second Avenue itself was ripped up to relocate utilities, dig access shafts, and station entrances. Working with the NYC DOT and New York City Parks Department (NYC Parks), the MTA paid to replace street trees, paint newly adopted bus and bicycle lanes, and rebuild streets and sidewalks to a higher standard along Second Avenue and many of the intersecting side streets. In March the MTA granted E.E. Cruz/Tully Construction an additional $4 million, plus an earlier infusion of $3.75 million, to attend to these street-level issues (Metropolitan Transportation Authority 2016b). It’s worth noting that the MTA agreed to surface restoration improvements from 88th Street to just north of 105th Street in order to create a consistent streetscape along Second Avenue, even though the southernmost portion of the 96th Street Station is just south of 92nd Street.
On December 31, 2016, Governor Cuomo hosted a 500-person New Year’s Eve party at the 72nd Street Station. While party goers started at 72nd Street, they eventually boarded a 96th-Street-bound Q train and visited all three newly built stations (Barone 2017). The next day, January 1, 2017, Phase 1 of the Second Avenue Subway opened for revenue service. Despite achieving this milestone, the project was incomplete. In order to host the party and get Phase 1 ready for revenue service, New York City Transit issued Temporary Code Compliance Certificates, but according to the PMOC there were still 17,260 discrepancies on the “Observations List,” which was a product of accelerating construction and eschewing regular procedures (Urban Engineers 2017a).[27] By trading speed for normal procedures, the PMOC worried that construction quality was compromised.
As soon as Phase 1 opened, cracks began to emerge. On January 1, there were already reports of out-of-service elevators, leaks in stations, and repairs to structural elements (Urban Engineers 2016; Fitzsimmons et al. 2017). In May, an entrance at the 86th Street Station had to be closed because three escalators were out of service after faulty sensors set off station sprinklers (Weaver 2017). A 2019 MTA Inspector General report found that after 15-months of observation only three of 32 escalators in the newly built stations met NYCT’s escalator performance goals (Pokorny 2019). To add insult to injury, all of this happened after the MTA approved an additional $5 million for enhanced maintenance and repair services for escalators and elevators at the 72nd Street, 86th Street, and 96th Street Stations from December 31, 2016 to June 30, 2017 (Metropolitan Transportation Authority 2017a).
While these breakdowns were obvious to riders, there were also less visible system integration and safety testing delays that were still being addressed after January 1, 2017. Problems with the fire safety system were so dire that the MTA spent $6.5 million to hire human fire watchers at each station while the system was reprogrammed (Rubenstein 2017).[28]
In addition to these challenges, now that the system was operating 24 hours a day, finding time to address outstanding items, namely compliance issues rather than significant operational concerns, became more difficult because trains were in service, passengers were in the stations, and consultants were transitioning to other projects. Even though revenue service began on January 1, 2017, the consultant construction management contract didn’t achieve substantial completion until August 31, 2021.
7.3 Analysis
In this section we shift from the narrative timeline presented in Section 2 to a deeper investigation of project specific elements that drove costs. Specifically, we show how intergovernmental coordination and utilities, labor wages and staffing, procurement and risk, and station design impacted costs throughout the course of Phase 1. Furthermore, by focusing on these factors, more general themes related to a lack of leadership, strict adherence to existing protocols and regulations, tensions between capital and operations funding, power asymmetries all contribute to schedule delay, over design, and greater costs. There is no single solution that will immediately cut budgets by 50%. We believe, however, that highlighting these issues and showing how they drive costs, slow construction, and increase payouts, especially in contrast to some of our other cases, should begin a conversation about why we insist on doing things the way we do them. Leadership, especially from the governor and mayor, needs to empower the MTA to use the same creative problem solving it deployed to secure a $1.35 billion FFGA to reduce costs and speed up construction.
We assembled data for this section from typical sources, such as newspaper articles, books, project documents, reports, articles, and presentation materials prepared by the MTA, FTA, and people who worked directly on the project. We also conducted more than 80 one-on-one and group interviews with contractors, suppliers, manufacturers, risk assessors, lawyers, cost estimators, sub-contractors, designers, engineers, laborers, current and former MTA executives and staff members, current and former transit agency executives and staff members outside of New York, local officials who interacted directly with the project, and advocates to better understand specific moments and cost drivers in the project’s development.[29]
7.3.1 Intergovernmental and utility extraction
Staging construction
Before Phase 1 construction began, the MTA had to figure out how to build underneath Second Avenue’s maze of legacy and more recent urban infrastructure. This meant securing agreements from the New York City Department of Transportation (NYC DOT), New York City Department of Environmental Protection (NYC DEP), New York City Parks Department (NYC Parks), New York City Department of Buildings (NYC DOB), Fire Department of the City of New York (FDNY), Consolidated Edison (Con Ed), Verizon, Empire City Subway (ECS), and others to close lanes of traffic, cut open streets for starter shafts and the TBM launch box, move pipes and utilities, get permits to use explosives, and stage construction. In Istanbul or Milan, those local governments contributed land to the project to build station entrances or shut down traffic on key streets to ease conflicts and keep the project moving. For Phase 1 of the Second Avenue Subway, the MTA had to negotiate separate agreements with city agencies and utility companies and agree to improvements, be it replacing old pipes with newer, larger ones made of more expensive materials, and usage payments to stage construction in an NYC Parks playground on Second Avenue. Overcoming these barriers was key to getting the $4.601 billion project built, but satisfying every third party who has the ability to withhold a permit or slow down construction came at a cost. A review of project documents suggests $250-300 million was spent on these kinds of arrangements, but this doesn’t include the delays incurred by contractors, which add costs in additional claims (Torres-Springer 2022).[30]
Early on in our interviews, we spoke with contractors, consultants, and former MTA staff members who were named in media reports and project documents. When we interviewed these experts, we often began by asking an open-ended question, “So why did Phase 1 cost $4.6 billion?” Invariably, respondents would rattle off a litany of plausible reasons. What helped focus our inquiry, however, was when these experts offered concrete examples. The first interesting lead we received that had not been mentioned explicitly in our document review was a $15 million deal the MTA made with NYC Parks in 2004 to temporarily stage construction at the Marx Brothers Playground on Second Avenue between 96th and 97th Streets (Figure 5) (Personal Interview NY E 2021).
MTA leaders like Joe Lhota, the former MTA Chair, and Dr. Michael Horodniceanu, the former head of MTA Capital Construction (MTA CC), often mentioned the sheer population density along Second Avenue on the Upper East Side as a significant driver of costs (Rosenthal 2017). While population density does drive costs, the more relevant driver in this instance was land saturation. The roughly $15 million deal the MTA struck with NYC Parks to use the westernmost section of the Marx Brothers Playground illustrates how challenging it is to find enough space in a crowded urban environment where buildings occupy most lots and traffic and parked cars blanket the roadways. Under these conditions, where was the MTA to find enough space to store construction materials, provide locker rooms for laborers, or office space for field engineers and supervisors who need to manage and dig the 244-meter-long by 18.9-meter-wide by 19.8-meter-deep TBM launch box and the 490-meter long 96th Street Station? In the Final EIS (2004, 3-24), the dimensions of these sites are described precisely:
In addition [to the launch box], equipment storage and construction activities at each shaft site would require that a staging area with a minimum of 40,000 square feet surface area (and a preferred 50,000 to 80,000 square feet [4,645 meters to 7,432 square meters]) abut each shaft site. The minimum of 40,000 square feet [3,716 square meters] is the equivalent of approximately half the width of Second Avenue for approximately four blocks. Ideally, each staging site would measure about 200 feet [61 meters] by 200 feet [61 meters]; however, given the approximate 100-foot [30 meters] width of Second Avenue from building line to building line and the density of development along the avenue, sites with those dimensions would be difficult to find, even if adjacent off-street properties are identified for use in combination with portions of the street right-of-way.
Paying $15 million to use Marx Brothers Playground allowed the MTA to secure a convenient site to get underground without going through a contentious and potentially more costly and uncertain eminent domain process. A former NYC Parks official who participated in the negotiations told us that there was no standard process for this type of deal; thus, officials at NYC Parks asked themselves, “If [the MTA] has to buy this land what would it cost? What is the most money [NYC Parks] could get” (Personal Interview NY I 2022)? This official acknowledged that the MTA negotiated in good faith and was “very honorable,” and that NYC Parks did not want to obstruct Phase 1, especially since Marx Brothers Playground was “lightly used.” Despite embracing this spirit of cooperation, NYC Parks officials understood that they were in a position to extract some of the project’s $4-$5 billion budget for themselves and that “a smart [agency] is going to ask for as much as they can” (Ibid.). Ultimately, NYC Parks received $11 million in 2004 ($15 million in 2020 dollars) to stage construction at Marx Brothers Playground, $1,925,000-$2,500,000 to restore the playground once construction was completed, $1,322,000 to plant 444 new trees, and more than $600,000 to hire five park employees to work in nearby playgrounds (Lapp 2004; New York City Parks Department n.d.).
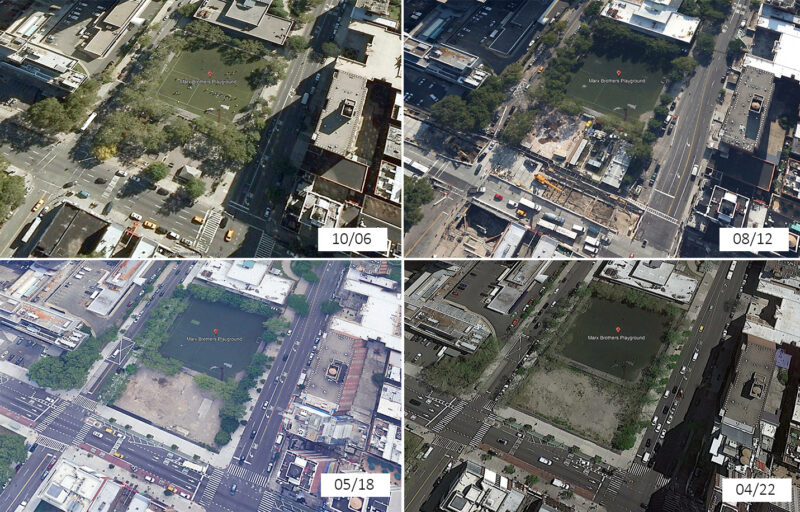
figure 5. Marx Brothers playground, before (10/06), during (08/12), after (05/18) construction and in 2022
When we described this scenario to our contacts in Italy and Istanbul, they seemed confused as to why the MTA would have to pay to use public land. In fact, the city did contribute land to the MTA for the construction of the 7 Train extension to Hudson Yards. The MTA had to pay for this land because neither the governor nor mayor intervened to help move the project along. Without champions with the power to bring agency heads to the table and work things out to benefit taxpayers, each agency holds out for its payout to help renovate facilities or hire additional staff. Compounding this issue is the federal government’s largesse. With money coming in from Washington D.C., the MTA had additional resources to take on the extra costs to get things done.
Getting to yes
When looking at the proposed plans for Phase 2 of the Second Avenue Subway, one thing that stands out is that project delivery will follow a different format than Phase 1. Rather than procuring a final design before tendering contracts to build Phase 2, a traditional Design-Bid-Build procurement, the extension from 96th Street to 125th Street and Lexington Avenue will be delivered via a Design-Build procurement with four contract packages. The first contract will be an advanced utility relocation contract (MTA Construction & Development 2021). For our immediate purposes, we highlight this because the former head of MTA CC, Dr. Michael Horodniceanu, explained at a New York Law School lecture that one of the main lessons learned from Phase 1 was the need to better locate utilities and move them prior to the start of construction (Horodniceanu 2017). In our interviews with planners, designers, contractors, and engineers, we were told that in the design for Phase 1, the decision to build deep mined stations and deploy a TBM, was made, in part, to avoid the conflicts that arise during utility relocations (Personal Interview NY F 2021; Personal Interview NY G 2021; Personal Interview NY C 2021; Personal Interview NY G 2021).
Similar to the challenge of finding a suitable location to stage construction in a city where buildings and active roadways dominate the landscape, New York has power, water, electrical, gas, steam, communications, and sewerage infrastructure running beneath its streets. When building a subway, it is inevitable that conflicts will emerge as access shafts and launch boxes are excavated from the surface. As an additional challenge, the exact location of all of these utilities is not well known. One expert described digging up New York’s streets as, “performing surgery without knowing where anything is” (Personal Interview NY K 2022). Finally, the MTA was required to coordinate and obtain approvals from utility companies and city agencies, namely Con Ed and NYC DEP, to ensure these conflicts were managed satisfactorily.
During Phase 1 construction, the MTA did issue one advanced utility contract. Rather than target the whole corridor, this contract focused on the 86th Street Station area.[31] Even though this $40.5 million contract is a tiny fraction of the overall construction costs, our interviews and review of project documents demonstrate that utilities drive costs, design decisions, and schedule delay in New York and across North America.[32] One Canadian transit agency manager went so far as to say that “transit projects are just very large utility projects with a bit of rail added on. The lion’s share of my work is moving pipes and ducts out of the way for a very quick and easy installation of some concrete and rail” (Personal Correspondence A 2022). As glib as this quote is, it does capture the magnitude of utility-related challenges faced by agencies and contractors when planning, designing, and constructing projects.
The 86th Street Station advanced utility contract called for excavating two starter shafts to provide access to carve out the 86th Street Station box, including the ancillary caverns. The contractor replaced, supported, and relocated all of the utilities in the vicinity of 82nd and 84th Streets and 86th and 87th Streets and installed a road decking system to maintain the flow of traffic along Second Avenue while digging those shafts.
Even though the contract began in July of 2009, NYC DEP failed to approve the MTA’s utility replacement plans until February of 2010 (Urban Engineers 2010e).[33] Part of the delay stemmed from NYC DEP’s desire to have the MTA replace the existing 48-inch diameter cast-iron pipes in the northern and southern construction zones with 60-inch diameter steel pipes (Urban Engineers 2010 March; Personal Interview NY K 2022). While the MTA and NYC DEP renegotiated terms, the contractor was unable to move, support, or replace any of NYC DEP’s water mains, which delayed construction and impacted future 86th Street Station contracts. This delay also entitled the contractor to a $2,240,000 lump sum impact cost settlement, going beyond just the DEP-driven delays (Metropolitan Transportation Authority 2013b). The MTA balked at this request, exposing itself to $15,000 a day impact costs, because swapping out a 48-inch diameter cast-iron pipe for a 60-inch diameter steel pipe is not as simple as a one-for-one substitution.[34]
First, installing a 60-inch diameter pipe of any material calls for a tapered design to transition from the new 60-inch diameter pipe to the existing 48-inch diameter pipes on either side of it. Thus, the contractor needs to buy and replace more lengths of pipe and carry out additional excavation, removal, support, and backfill rather than a more straightforward one for one swap. Second, connecting steel and cast iron requires customized flanges and in-field welding, all of which add costs, delay, and risk. Third, utilities are laid side by side and stacked above and underneath one another underground, expanding the footprint of one pipe impacts the layout of other utilities. Thus, installing a 60-inch diameter pipe would also mean moving and reorganizing the adjacent water and gas mains and telephone ducts, an additional cost and risk, in order to accommodate the larger pipe. Fourth, steel is more expensive than ductile iron and the cost of pipes scale with diameter so a 60-inch diameter pipe is more expensive than a 48-inch diameter pipe.
After six months of back and forth between MTA CC managers and NYC DEP managers, the head of MTA CC and the head of NYC DEP met and agreed that the MTA would only replace the 48-inch diameter cast-iron pipe at 83rd Street with a 48-inch diameter ductile-iron pipe and redesign the utility plan at the northern shaft to avoid replacing it (Personal Interview NY L 2022).[35] Even though the MTA didn’t accede to all of NYC DEP’s demands, it still bought and installed a replacement 48-inch diameter ductile-iron pipe, purchased additional lengths of pipe per NYC DEP’s request in the event more pipes needed to be replaced, had its designers redesign the utility plan, and executed multiple contract modifications to compensate the contractor for additional work and impact costs.
This brief example highlights four main utility-related challenges that drive costs: first, the MTA put together a $34 million 19-month contract package that included precise utility designs and the cost of replacing utilities. Once NYC DEP reopened that process, after the contract had been finalized, it meant the MTA had to issue change orders to both the contractor executing the work and the designers who designed the utility plan. Second, and this is a more relevant and more abstract finding, the difficulty coordinating with NYC DEP led to the MTA eliminating the replacement of the 48-inch diameter pipe in the northern shaft. Without arguing the merits of the new design, the MTA had to do its design work twice, at a minimum, and delay construction while it came to terms with NYC DEP.[36] Rather than taking 19-months and spending $34 million, this contract ended up with a smaller scope, but still took nearly 50% longer to complete, 28 months, and cost close to 20% more than the initial budget, $40.5 million. Early on in our interviews with people who worked on Phase 1, we were told that “you’re never not going to be in a situation where you are going to be challenged continuously” (Personal Interview NY H 2021). Thus, the MTA opted for a design program that minimized interactions with utilities to minimize those challenges. This meant that stations and running tunnels had to be deeper than traditional New York City subway stations, even though they would eventually connect with shallower tunnels at 99th Street. Third, when labor costs are high, costs increase as more labor, both direct and indirect, is needed to complete redesign work or extend the construction period by replacing more pipes. Fourth, this back and forth between MTA CC and NYC DEP wasn’t resolved until the two agency leaders hashed out their differences directly. Stronger leadership from a governor or mayor, better communication at the staff level to resolve disputes, unambiguous standards regarding replacements, or legislation holding agencies and utilities accountable for impact costs could have avoided these delays and added costs.
New standards, new costs
The designs and policies governing New York City’s streets changed between the start of construction in 2007 and the start of revenue service in 2017. In 2008, the NYC DOT announced it would launch Select Bus Service along First and Second Avenues in 2010 (New York City Department of Transportation n.d.a). The launch of this new service was accompanied by new designs such as painted bus lanes, concrete bus pads, and electrical work embedded in the sidewalk to power ticket machines, bus shelters, and information boards (Figure 6).[37] In 2009, NYC DOT began testing new LED street lights. According to the agency (n.d.b, p.12), the average cost of a standard cobra head street light fixture, the light fixture that dotted the corridor before construction, was $160. The new LED fixtures, the one that replaced the cobra head, had an average cost of between $1,050 and $1,650. In 2012, the NYC DOT announced it would install protected bicycle lanes along First and Second Avenues (Federal Transit Administration 2013). Again, this change necessitated roadway changes: new markings, floating curbs, bulb outs, and new traffic signals. In 2014, New York City adopted Vision Zero, yet another policy that reshaped New York’s streets (City of New York n.d.). All of these changes occurred in the midst of construction, which meant the design consultant had to redesign the street restoration work that had been included in the initial station contracts to reflect NYC DOT, NYC DEP, and NYC Parks requirements, and the contractors had to replace trees, benches, street lights, fire hydrants, and streets to a new standard.[38]
In theory, signing cooperative agreements, memoranda of understanding, and other documents that lock in replacement agreements with city agencies and utilities should insulate the MTA from unanticipated changes. Our review of these documents in New York and elsewhere showed that these agreements often include a clause or paragraph that leaves open the possibility of change at the discretion of the third party. When we asked why it was so difficult to lock down an ironclad master agreement with third parties during Phase 1, we were told that the project’s 10-year construction timeline made it impossible for an agency like NYC DOT to freeze its street design plans during subway construction (Personal Interview NY L 2022). Another senior level agency official explained that there have been attempts to develop those kinds of agreements, but because agencies and the MTA interact across so many projects beyond Second Avenue, it is difficult to find common ground across each one, which ends up derailing the process (Personal Interview NY N 2022). Others explained that personnel turnover at agencies and at the MTA meant that even though one person or group agreed to something, new leadership at an agency wanted new deals and finding the right staff member posed a challenge (Personal Interview NY O 2022; Personal Interview NY P 2022). NYC DEP, for instance, had at least six commissioners between the start of planning and Phase 1 reaching substantial completion (Personal Correspondence B 2022).[39]
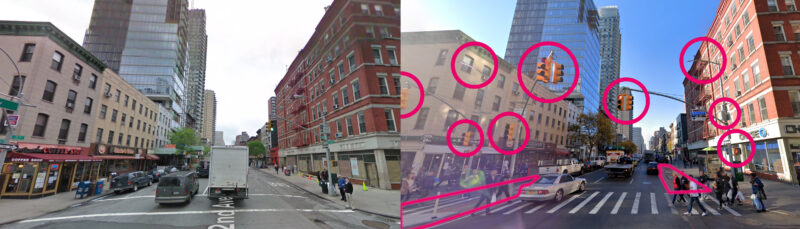
figure 6. Street design improvements: before and after SAS, corner of 86th street and 2nd avenue
7.3.2 Labor wages and staffing
When American railroad construction began in the first half of the 19th Century, labor costs were high relative to extremely low land costs (United States Department of Labor 1830). As a result, American railroad builders traded labor-intensive tunnels and embankments for curved alignments that consumed more land but could be constructed more cheaply. In England, the economic logic was reversed: labor and capital were cheap compared to land; thus, English railroad builders minimized land costs by building the straightest routes possible, even if it meant more expensive civil works. Schivelbusch (1986, p.97) describes the differences between American and English railroad construction logic at length:
All European observers noted how the American railroad lines proceeded by curves rather than straight lines: from the very beginning, this was the main characteristic of American railroads. As early as 1827, when the first reports of the English railroad experiments inspired the proposal for the first American railroad (the Baltimore and Ohio), one of its promoters, Minus Ward, stated that the English innovation would have to be modified to suit American conditions: among other things, he mentioned ‘the necessity of departing from the transatlantic system of straight rail-roads’. In a survey report for the Baltimore and Ohio Company, S.H. Long concluded in 1830 that the English mode of construction would be uneconomical in American circumstances. He expressed his preference for a line with numerous curves, justifying it by the observation ‘that…the expense of avoiding a hill or valley, by prolongation of the route, in a manner to maintain uniformity in its vertical direction, is less than that of cutting and fitting’. (Italics in original.)
This thinking no longer applies to contemporary transit projects. Like early railroaders, we argue that costs are a key project evaluation metric. By focusing on costs, projects can be optimized around overall production per dollar spent so that the types of projects that get built in the United States are extensive enough to connect and stimulate the development of vibrant population centers and neighborhoods. This doesn’t mean that costs are the only thing that matters. Our hope is that by highlighting costs and cost impacts of certain decisions, tradeoffs between scope and schedule can be better understood by the public and decision makers.
During our research, both a review of articles focusing on construction costs and interviews with project managers who staffed Phase 1 projects we were told that direct labor costs account for 40%-60% of construction costs in New York (Munfah and Nichols 2020; Personal Interview NY I 2021; Personal Interview NY E 2021; Personal Interview NY Q 2022; Personal Interview NY R 2022). When we compared the proportion of labor costs to construction costs in our Italian, Turkish, and Swedish cases, we found that labor costs comprised 19%-31% in Italy, 20% in Turkey, and 20-25% in Sweden.
Labor costs consume a greater proportion of construction costs in New York for three key reasons. First, wages in New York are higher than in other cities we have examined, even to a small extent Stockholm. Second, staffing levels for tunneling, drilling and blasting, and utility replacement all require more laborers than in cities like Madrid, Milan, Stockholm, and Istanbul. Third, external constraints and work rules all limit labor productivity; thus, each labor hour produces less TBM launch box or station cavern than in other cities we have compared against.[40] In addition to the wages paid to laborers, American consultants also receive high hourly wages, in many cases even higher than the laborers building the projects, to do design work, construction management, and studies that agencies in low-cost countries like Chile, Sweden, Norway, and Italy carry out internally or with academic support.
Part of the problem is that high wages and low productivity are spun positively. In 2009, United States Representative Carolyn Maloney, an early champion of the full-length Second Avenue Subway, trumpeted the 38,000 jobs, $2 billion in wages, and almost $7 billion in economic activity generated by Phase 1 of the Second Avenue Subway and East Side Access, despite both projects being many years away from completion and realizing any of their transportation benefits (Chan 2009). Similarly, if one follows the press releases from the California High-Speed Rail Authority, one quickly sees that there is always a paragraph detailing the number of jobs created to date (California High-Speed Rail Authority 2022a; California High-Speed Rail Authority 2022b). If these infrastructure projects are viewed primarily as job creation vehicles, high costs become less relevant as the transportation benefits fade into the background.
If we make the leap that costs matter, labor costs also matter. Knowing that New York’s construction labor rates are continuously the highest or among the highest in the world should either compel elected officials to re-examine the deals they have supported with trade unions, emphasize cost-saving designs that reduce the number of labor hours required to build, or examine rules that limit productivity so that New York’s costs can begin to resemble those in other cities (Arcadis 2016; Arcadis 2017; Turner and Townsend 2022, Torres-Springer 2022).
Rosenthal (2017) quoted experts and reports that found that New York staffed two to three times more laborers on the TBM and more broadly up to four times as many people for underground construction than in Asia, Europe, or Australia. In our own data collection efforts from Spain, Turkey, and Italy, we found that staffing levels in New York were higher. When we compared the direct labor to staff one eight-hour shift in New York, we found that it took 46 laborers to operate and support the TBM used for Phase 1. When we sat down virtually with contractors and project managers who worked on Second Avenue Subway and East Side Access, they independently confirmed that staffing levels could have been pruned without sacrificing safety or production.
Not only did Phase 1 move three times slower than counterparts in Istanbul and Madrid when it came to digging the launch box, but also operating and supporting the TBM used more than 50% more laborers than needed. The experts we interviewed told us that instead of the 46 laborers per shift who coordinated work, operated the TBM, maintained the locker rooms above ground, transported supplies to the labor crews in the tunnel, and ran the elevator to the surface, it was possible to operate and support a TBM with 30 laborers (Personal Interview NY I 2021; Personal Interview NY J 2021; Personal Interview NY S 2022). One former tunnel worker we interviewed was less certain of the overall numbers in terms of operating and supporting the TBM, but was adamant that tunnel workers have a culture of working hard and competing against one another so as to “work [themselves] out of a job” (Personal Interview NY K 2021).
Table 2. SAS TBM staff numbers
| Actual and Proposed Tunnel Boring Machine Staffing for Second Avenue Subway Phase 1 | |||||
| Team | Title | Number | Fully-Laden Employment Cost | Proposed Number | Fully-Laden Employment Cost of Proposed Scenario |
| TBM Crew | General Foreman | 1 | $12,103.35 | 1 | 12,103.35 |
| Walking Boss | 1 | $12,103.35 | 0 | --- | |
| Journeymen | 6 | $6,2464.86 | 5 | $5,2054.05 | |
| Miner- Mole Nipper | 1 | $10,221.27 | 0 | --- | |
| Miner- Brakeman | 2 | $20,821.62 | 1 | $10,410.81 | |
| Electricians | 2 | $22,872 | 1 | $11,436 | |
| Operating Engineer (OE)- TBM | 1 | $12,103.35 | 1 | $12,103.35 | |
| OE- Locomotives | 2 | $24,206.7 | 2 | $24,206.7 | |
| OE- TBM Maintenance Engineer | 1 | $12,103.35 | 0 | --- | |
| OE- Main Man | 1 | $12,103.35 | 0 | --- | |
| Laborers | 2 | $20,056.32 | 2 | $20,056.32 | |
| Labor Foreman | 1 | $9,645.36 | 1 | $9,645.36 | |
| Laborers | 2 | $19670.22 | 2 | $19670.22 | |
| Miner- Superintendent | 1 | $11,723.85 | 0 | --- | |
| Miner Foreman | 1 | $10,951.38 | 0 | --- | |
| Miner Change House | 1 | $9,075.72 | 0 | --- | |
| Miner Safety | 1 | $9,076.02 | 1 | $9,076.02 | |
| Minor Top Bellman | 1 | $10,028.16 | 1 | $10,028.16 | |
| Miner Top Laborer | 1 | $9,835.11 | 1 | $9,835.11 | |
| Miner Top Nipper | 1 | $10,221.27 | 0 | --- | |
| Support gang- Shaft Service Crew, Bottom, and Top Crews | Miner Bottom Bellman | 1 | $10,028.16 | 1 | $10,028.16 |
| Miner Bottom Laborer | 1 | $10,410.81 | 1 | $10,410.81 | |
| Miner Bottom Dumpman | 2 | $20,056.32 | 1 | $10,028.16 | |
| Miner Bullgang Foreman | 1 | $10,777.35 | 1 | $10,777.35 | |
| Miner Bullgang Laborers | 2 | $20,821.62 | 2 | $20,821.62 | |
| OE- Crawler Crane | 1 | $11,723.85 | 1 | $11,723.85 | |
| Oiler- Crawler Crane | 1 | $9076.02 | 0 | --- | |
| OE- Loader | 1 | $11,723.85 | 1 | $11,723.85 | |
| OE- Compressor | 1 | $11,723.85 | 0 | --- | |
| OE- Muck Conveyor | 1 | $11,723.85 | 1 | $11,723.85 | |
| OE- Master Mechanic | 1 | $11,723.85 | 0 | --- | |
| OE- Maintenance Foreman | 1 | $11,723.85 | 0 | --- | |
| Surveyor | 1 | $9,076.02 | 1 | $9,076.02 | |
| Teamsters | 1 | $9,076.02 | 1 | $9,076.02 | |
| Total per Shift | 46 | $163,684.01 | 30 | $116,528.6 | |
| Total | 138 | $491,052.03 | 90 | $349,585.8 | |
Digging tunnels
Tunnels and subways are tied up with one another, and tunnel construction in New York has received a disproportionate amount of critical attention despite only accounting for $380 million, or 12% of Phase 1’s total construction costs.[43] Additionally, from a performance standpoint, while the TBM work encountered a number of challenges at the outset, the average production rate, 15 meters per day approached the high end of expectations described in the Final EIS and was seen as a success internally (Final EIS 2004 3-7; Personal Interview NY C 2021; Personal Interview NY Q 2022).
However, the largest cost of TBM tunneling is digging the launch box to get the TBM into the ground. We spoke to three experts with access to project documents who explained that digging the 244-meter-long by 18.9-meter-wide by 19.8-meter-deep TBM launch box, two starter shafts for the 72nd Street Station, and storing and hauling muck was the largest expense. Two of the experts said that this phase of construction consumed 40-50% of the $380 million tunneling contract. The balance of the contract was spent on the two tunnels (Personal Interview NY A 2021; Personal Interview NY I 2021). It took three years to dig the launch box and 16 months to construct the tunnels, which largely explains the cost differentials. When we compared how long it took to set up TBM operations in Istanbul and Madrid, we were told that in both cities it takes one year or less instead of the three it took in New York (Personal Correspondence C 2022; Personal Correspondence D 2022).
When labor costs are high, it is critical to speed things up rather than slow them down. In addition to concerns over fragile buildings, unexpected geological conditions, and obstructions, all of which delayed construction, workers’ time was spent unproductively. One senior tunneling manager explained that work-window constraints, which were spelled out in the contract, forced S3 Tunnel Constructors to dig an additional storage space and build a conveyor system to move the excavated earth to the storage area behind the launch box so that it could store the muck before loading it onto trucks during the hours hauling was permitted. This meant that instead of handling muck once and carting it out, S3 had to dig, then haul, and then haul a second time to dispose of it. It also meant that when trucks could haul muck, S3 had to hire three times as many of them as it would have had trucks been allowed to make roundtrips throughout the day. One contractor told us that because of these hauling restrictions, S3 spent an additional $20-30 million double-handling material, building an underground storage facility and conveyor system, and ramping up trucking within the approved work window, usually from 9AM to 8PM.[44] In short, this manager explained, “trucking changed our entire [tunneling] operations” (Personal Interview NY I 2021).
Consultants versus in-house capacity
American transit agencies rely heavily on consultants rather than in-house staff to complete planning, design, engineering, and construction management services for capital projects. As a result, American soft costs, the cost of hiring consultants, are far greater than what we have seen in our international case studies in Italy, Turkey, and Sweden.[45] The American preference for consultants and non-government employees dates back to at least the 1960s. Dilulio (2014) explains that starting in the 1960s, under the guise of making government “work better,” federal agencies reduced the number of full-time employees while expanding the number of federal agencies, taking on debt to pay for more services, increasing spending by five times, and ceding control of policy implementation and development to proxies, contractors and consultants, who now do the work of government. This Leviathan by Proxy model, Dilulio’s term, also applies to transit agencies, where agency staff now manages grants, contracts, and the innumerable interfaces between contractors and the agency rather than planning, designing, engineering, and managing the construction of transit projects. Additionally, transit agencies take advantage of federal grants and transportation bond acts for capital projects to pay for consultants to do jobs that previously would have been done by in-house engineers and planners.
Traditionally, NYCT bucked this trend. Prior to the creation of MTA CC in 2003, NYCT had an in-house engineering and construction management group, Capital Program Management (CPM), with about 1,600 full-time employees; it performed 60% of capital-project-design work and 95% of the construction management itself (Personal Interview NY B 2022; Personal Interview NY T 2022). MTA CC, conversely, follows the Leviathan by Proxy approach outlined above. Instead of a large in-house team, MTA CC employed 124 full-time employees in December 2011, a time when it was responsible for delivering close to $20 billion worth of projects: Phase 1, the 7 Line Extension, East Side Access, and the Fulton Transit Center (Metropolitan Transportation Authority 2012; Metropolitan Transportation Authority 2019b).[46] By moving away from the CPM model of robust in-house capacity, MTA CC turned to consultants to carry out design and construction management during Phase 1 and navigate the MTA’s internal processes and politics. Just as federal spending skyrocketed while the number of full-time employees shrank over the last half century, the MTA capital plan has doubled between the $27 billion (in 2020 dollars) 2010-2014 and the proposed $54.8 billion 2020-2024 plan, even though the labor-intensive CPM has given way to MTA Construction & Development, the entity that replaced MTA CC.
In the Leviathan by Proxy model, the federal government got neither better nor smarter by trading full-time government employees for consultants. Instead, the federal government fragmented and sprawled as more proxies needed to be managed and audited, new programs and grants needed to be administered, new procedures and guidelines governing new work flows needed to be created, and intra- and inter-agency demands needed to be integrated into this approach to public administration. For MTA CC, it was tasked with coordinating with design contractors, construction management consultants, general contractors, city agencies, and dozens of NYCT user groups, such as signal maintainers and train operators.
A review of detailed work modifications shared with us show that managing these interfaces between NYCT and Phase 1 designers meant that MTA CC had to instruct and pay its designers millions of additional dollars to redesign turnstiles after specifications changed, lay out new floor-tiling plans because NYCT objected to the proposed tiles’ dimensions, add internal partitions to public toilets, relocate CCTV locations, and revise the fire alarm system. Since NYCT had exacting standards, perhaps with new, experienced leadership who had a track record of planning, designing, and managing a megaproject, it could have designed the extension it wanted while also maintaining the project’s scope, schedule, and budget.
While there is an accounting logic to eliminating the ongoing operating expenses and long-term liabilities of full-time employees, international best practice recommends a different approach. Dilulio is quick to point out that in his research, the English, French, Japanese, German, and most other democracies he surveyed place more restrictions on what governmental work can be contracted out than in the United States. In our Italian and Swedish case studies and in work we have done on Spanish and French projects, all countries with medium and low costs, we see agencies retain greater control of projects by doing early planning and design, procurement, and construction management themselves rather than hiring consultants (Maynar 2003; Eno Center 2022). By doing this work themselves, these agencies spend less on consultants than American agencies and are better equipped to maintain control over projects rather than being led by consultants.
During Phase 1, the MTA spent $656 million on consultants to design and engineer the full-length Second Avenue Subway and support and manage Phase 1 construction.[47] Thus soft costs were 21% of Phase 1’s $3.16 billion hard costs. Phase 1’s soft costs compare favorably to other domestic projects where in-house teams are smaller and less experienced. Projects like Los Angeles Metro’s Regional Connector and Purple Line Extension projects and the MBTA’s Green Line Extension have all seen their soft costs exceed 25-30% of hard costs. In our international research and case studies, we found that Italian soft costs are only 10% of hard costs, and French, Spanish, and Turkish ones are 5-10%.
This large difference between international and domestic soft costs is all the more alarming because American hard costs tend to be greater, too. It makes sense that soft costs scale with hard costs. As we detail below, Phase 1 stations are larger than those in our other cases, and this raises the hard costs but also the costs of design and construction management; we expect that if stations are right-sized in the future, then design costs will shrink proportionately. However, not all hard costs work like this. In particular, if there is overstaffing in the tunnel and if wages are higher than normal, then it has no impact on the design costs, which do not include these workers’ supervisors or their benefits.
The upshot is that reducing the share of craft labor in the overall cost is independent of cuts in the share of soft costs, unlike the case for other items such as station costs. In our closest-wage comparison case, Stockholm’s Citybanan, labor was 23% of the contract cost, compared with about 50% in New York, both figures including white-collar workers (such as utility supervisors in the Second Avenue Subway tunnels). Shrinking the labor share from 50% to 25% while keeping the non-labor costs constant involves, in effect, transitioning from spending $75 on labor and $75 on everything else to spending $25 on labor and $75 on everything else; this is a factor of 1.5 reduction in hard costs, without any effect on soft costs. Thus, the management and engineering costs are really 31% over the base hard cost with labor at a globally normal rate.
The large premium of design and engineering costs has to be understood in terms of consultant finances. Among people we have interviewed in the corporate world, the commonly cited figure is that hiring management consultants means paying triple the amount one would pay if it were done in-house. People we have spoken with in the consulting industry have likewise told us that their employer charges about three times their actual wage for their time. This factor of three figure needs to be tempered by the issue of overheads and worker benefits, but private-sector white-collar norms are that overheads and benefits add about 30% to the cost of a worker, rather than the 100% premium more common in unionized public-sector jobs with extensive pension agreements.
Now just because a consultant or an army of them has been retained, managing and utilizing them effectively requires expertise and knowing what one wants, especially when things deviate from the plan. According to our interviews with former MTA employees and consultants who worked for the MTA, consultants, like construction labor, were overstaffed and not always used in the most efficient manner. Without a developed in-house team to fall back on during construction, every wrinkle, from redesigning the 72nd Street cavern to studying the fragile buildings along the construction zone to retooling the construction packages, re-estimating costs, and developing smoke mitigation for blasting, required pressing the consultants into service beyond their contractual agreements. The AECOM-Arup design, engineer, and construction support contract began as a $187 million contract, but with a planned $143 million option picked up and unanticipated contract modifications, it grew to a 210-month $452 million behemoth. The WSP contractor construction manager contract began as a 91-month $80.9 million contract and grew to a 173.5 month $204 million one. When we examined cost overruns for these kinds of contracts in Turkey and Italy, we found that they also often run over budget and schedule because of unexpected challenges and delays.
The benefits of the consultants were clear. First, they could be scaled up and down much more quickly and precisely, in theory, than MTA CC. Second, they completed specialized work, from redesigning the 72nd Street cavern to conducting air quality monitoring to carrying out public outreach. Third, they helped MTA CC navigate delicate relationships with other agencies within the MTA, namely NYCT. On this last point, a number of people told us that MTA CC had a difficult time wrangling NYCT even with its consultants, but without the consultants it would have been impossible.[48] Based on our review of documents and interviews with consultants, we have found that architects, planners, and engineers working on Second Avenue Subway billed the MTA between $75 and $310 an hour in 2011, or $86 to $357 in 2020 dollars, including hourly wages, overheads, and the consultant’s fixed fee.
The drawbacks of the consultants were also obvious. First, MTA CC clung to the consultants “like a security blanket” (Personal Interview NY L 2021). Whenever there was a question, uncertainty, or problem, project managers asked the consultants to study it. One former MTA CC manager explained to us that the agency leaned on its consultants, perhaps too much, in part because there was a perception that the consultants were “an endless resource to study everything… but how many different iterations of a transformer do you need to see [before making a decision]” (Personal Interview NY H 2021)? When it came time to redesign the construction contract packages, the consultants looked at every option between 6 and 29 contracts (Personal Interview NY E 2021; Personal Interview NY H 2021). Having a consultant on call meant that any request could be entertained and give cover to delaying a decision, a problem we saw in our GLX case, too.[49] Second, several consultants who worked on Phase 1 told us that the lack of internal capacity and a clear sense of what the agency wanted meant that consultants wasted time solving basic problems that should have been determined prior to hiring a consultant (Personal Interview NY F 2021; Personal Interview NY V 2022; Personal Interview NY W 2022). Specifically, we were told that instead of being handed design guidelines at the start of the project, it was the consultants who developed those guidelines first, sometimes in conflict with NYCT standards (Personal Interview NY W 2022).[50] This is especially surprising since the MTA had completed new station construction projects in the late 1980s. Third, the MTA developed a four-phase plan for delivering a full-length Second Avenue Subway. With Phase 1 complete, knowledge and lessons learned from Phase 1 have been retained by the consultant teams, and many of the most experienced managers from Phase 1 who learned by doing have left the agency, some have retired and others now work in the private sector. An agency staffer at another large North American agency we spoke to about its reliance on consultants explained that at her agency, it was the consultants who knew everything about past projects rather than agency staff (Personal Interview NY M 2021).
7.3.3 Procurement and risk
Procurement costs cannot be neatly separated as line items, since they affect the costs of many individual items, some direct rather than indirect. Nonetheless, a picture emerges in which the totality of the procurement system used in New York doubles the overall costs of major MTA infrastructure projects.
Traditionally, procurement in the United States has been done using design-bid-build, including Phase 1 of the Second Avenue Subway. Design-bid-build stresses the separation of design and construction, with strong public-sector input in the planning and design phases. As we saw above with the transition to the Leviathan by Proxy mode of public administration, design-bid-build runs counter to its key tenets, namely contracting out and ceding control to consultants. As such, it is no surprise that as transit agencies have reduced headcounts and hired teams of consultants to plan, design, engineer, and manage construction, design-bid-build has lost popularity, as methods that give more control to contractors and consultants by merging the design and construction contracts into one, called design-build, have gained popularity. Managers we have spoken to at the MTA express mixed opinions about design-build, some say it is reducing costs for Phase 2 and others the opposite (Personal Interview NY H 2021; Personal Interview NY B 2021).
Design-build is being pursued because the recent American experience with design-bid-build has not been positive. In our interviews, we were told repeatedly that design-bid-build is too adversarial; the GLX case details the same criticism, leading to the adoption of Construction Manager/General Contractor and more recently design-build, as in New York and other American cities. A consultant who worked on the 7 Extension and East Side Access told us that design-bid-build gives the agency more control via its construction management consultants to direct contractors down to telling them what materials to use (Personal Interview NY N 2021). This retained control, however, leads to conflict between the agency and the contractors and the design and construction contractors.
Design-build has not resolved these problems. Agencies still want to be able to exert control over projects and contractors, sometimes this is done through an owner’s representative, a third-party private firm that is hired to do design review, by requesting changes or establishing precise, though perhaps inappropriate, design specifications.
The real issue regardless of whether the MTA uses design-bid-build or design-build is risk allocation. The more risk the private contractor is required to bear, be it geological or schedule risk, the higher the bids are (Ryan 2020; Personal Interview NY N 2021; Personal Interview NY O 2021; Personal Interview NY W 2022). The MTA has six mechanisms that impose an unusual extent of risk on the private contractors, which we detail below.
First, the bids involve extensive use of private information. The MTA has independent cost estimates that it uses to benchmark private bids, but those are held from the public as trade secrets, so the bidders have to produce their own estimates when preparing their bids.[51] The only itemized costs that are transparent are those of labor, which are subject to collective bargaining and published for both wages and benefits. This contrasts with the transparent itemized costs in low-cost countries like Italy, in which the private bidders get to see the internal estimates and work from them.
Second, contracts are not itemized, but are instead let as lump sum. The contractors prefer this system, since they get paid faster under lump sum and have less paperwork to do, though contractors we have spoken to have complained that working with American transit agencies is time and labor intensive (Personal Interview NY N 2021; Personal Interview NY X 2022). However, when changes are required, there is no prior schedule for establishing how to cost them, and sometimes, conflict between the MTA and the contractors is resolved through costly litigation.
Third, the MTA puts the onus of underground geotechnical risk on the contractors. This is unusually risky because of the unpredictability and poor records of underground utilities in New York. TBMs require continuous maintenance, which adds down time to the project during which tunneling workers still have to be paid; both an S3 manager and a Turkish contractor with a history of low-cost intercity rail tunneling estimate that TBM uptime varies from 25%-40% (Personal Interview NY I 2021; Personal Interview NY Y 2022). Between inevitable geotechnical risk and what contractors view as capricious MTA requirements, contractors hedge against all risk by bidding higher.
Fourth, state regulations are heavy-handed whenever costs run over prior estimates. The Cuomo administration added a debarment rule blacklisting contractors whose final costs go 10% above their bids. In a letter to the MTA Board, the Citizens Budget Commission (2019) argued that the threat of debarment reduced competition because contractors were afraid to submit bids on MTA projects and risk being banned from bidding on future New York State contracts. One source at the MTA compared the threat of debarment as the state pointing a gun at contractors, for which they respond with a bazooka, bidding anything from 15% to 40% higher, the latter including all risks (Personal Interview NY O 2021).
Fifth, early planning includes large contingencies to account for unanticipated delays, design changes, or increases in unit costs. For example, the ongoing MTA accessibility mandate is costed at $70 million per station, but this is really $50 million per station plus a large risk factor. Once contingency is in the budget, the money will be spent; there is always some local demand, betterment, or related project that could use the money, for example see the description of back-of-house space in the stations section below, and the soft cost is thus converted to a hard cost.
Sixth and finally, in New York, conflict between the MTA or other transit agencies and the utilities is endemic. Utilities do not cooperate with the MTA, and do not properly document underground infrastructure (Personal Interview NY N 2021; Personal Interview NY O 2021; Personal Interview NY I 2021). For example, electric cable relaying is planned to coincide with alternate street parking rules, but some car owners forget to move their cars, and then Con Ed lays the cable around the parked car, which may not be marked on a map at all (Personal Interview NY 2019). At the NYC DEP, even more cooperative managers cannot get an up-to-date map of the water and sewer mains from planners and middle managers, who are used to withholding information. A project begun in the late 1990s to map the underground stalled after the 9/11 attacks, when the mood turned toward secrecy and agency officials justified their decisions on grounds of national security (Milner 2017). This leads to high costs but also high uncertainty in costs: even installing an elevator at an above-ground station may run into utilities conflict while the contractor digs up the sidewalk to lay foundations.
Risk is a two-sided affair, and the MTA has long attempted to reduce its exposure to cost overruns. This has evolved into detailed specifications, under design-bid-build and design-build procurements, in which the agency determines which materials to use and is inflexible about changes based on the inevitable geotechnical surprises that happen during underground construction. This has the triple effect of increasing overall costs to the contractor, increasing risk, and reducing the number of contractors available to do business with the MTA.
The result, in part, is that this limits competition among contractors because only those with enough experience or financial resources are willing to work under these conditions. The station and tunnels contract for the 7 extension was a one-bid contract, and the TBM tunnels contract for Phase 1 only had two bidders. The most competitive Second Avenue Subway contracts were those that came in at the depth of the Great Recession, when contractors could not get private-sector work and therefore competed for public-sector jobs, leading to below-estimate bids. Even then, contractors and current and former MTA employees told us that client-contractor relations raise costs because of “the MTA factor,” which has parallels in other American transit agencies.
When contractors are pushed away due to the mutually hostile relationship with the MTA, the few that are left can charge a hefty premium for their work. We were told that the profit rate for Second Avenue Subway Phase 1 was 5-20% on MTA contracts, between risk compensation and the small pool of available bidders (Personal Interview NY O 2021; Personal Interview NY I 2021).
7.3.4 Station design
The station contracts are Phase 1’s largest cost center. After summing the eight station contracts, we see that $2.44 billion of the $3.16 billion in total construction costs, or 77%, was spent on the four stations.[52] Now because these contracts are not disaggregated and some elements like ancillary facilities span multiple contracts, it’s impossible to pull out and compare specific elements. This is one of the challenges of lump sum contracts, a practice we discourage. Without an ability to scrutinize itemized costs it is difficult to know exactly where the money is going, which, in turn, makes it difficult to learn from projects and reduce costs in the future.
Station designers, some of whom worked on Second Avenue, told us that in general, stations should be standardized boxes that are only customized enough to fit into unique settings. Underground stations require greater customization than above-ground stations because of the challenges of finding suitable surface-level entrances and exits and shafts for ventilation. In a crowded city where there aren’t open expanses, properties have to be acquired. In cities like Copenhagen, London, Naples, Istanbul, and Rome, which are old and built up, the development of new subways catalyzed the creation of plazas and pedestrian spaces designed to reclaim the public realm from vehicular traffic and make it easier to site a station, stage construction, store materials, and adopt more standardized station designs. In New York, NYC DOT mandated that the MTA maintain four lanes of traffic throughout construction and no new plazas or pedestrian spaces were created in former rights of way for automobiles, though new bicycle and bus lanes were added by NYC DOT. Because of the inflexibility of New York’s built environment and the policies that regulate it, it was impossible to standardize the three newly built stations and apply lessons learned from one station to the next. The 72nd Street, 86th Street, and 96th Street Stations differ from each other in terms of overall length, depth, construction techniques, location of ancillary facilities, finishes, number of elevators and escalators, crossovers, and the amount of back-of-house space for technical rooms and rooms for different NYCT user groups that operate and maintain the subway (Table 3).[53]
Table 3. Phase 1 Station statistics
| Station | 96th Street | 86th Street | 72nd Street | 63rd Street | |
|---|---|---|---|---|---|
| Length | feet | 1,591 | 969 | 1,305 | 1,140 |
| meters | 485 | 295 | 398 | 347 | |
| Width | feet | 57 | 64 | 64 | 58 |
| meters | 17 | 20 | 20 | 18 | |
| Depth* | feet | 54 | 84 | 100 | 129 |
| meters | 16 | 26 | 30 | 39 | |
| Platform Length | feet | 615 | 615 | 615 | 615 |
| meters | 187 | 187 | 187 | 187 | |
| Platform Width | feet | 30 | 30 | 30 | 30 |
| meters | 9 | 9 | 9 | 9 | |
| Back-of-House Space** | square feet | 95,553 | 76,535 | 59,760 | 71,736*** |
| square meters | 8,877 | 7,110 | 5,552 | 6,664*** | |
| Customer Space | square feet | 36,776 | 39,994 | 38,797 | 5,304**** |
| square meters | 3,417 | 3,716 | 3,604 | 493**** | |
| Escalators | 9 | 13 | 10 | 12 | |
| Elevators | 2 | 2 | 7 | 7 | |
| Entrances | 3 | 2 | 3 | ||
| Costs | millions | 837 | 656 | 812** | 246 |
| Excavation | cubic yard | 316,382 | 172,500 | 190,358 | |
| cubic meter | 241,891 | 131,886 | 145,539 | ||
| Million $/cubic meter | 3,460 | 4,974 | 5,579 | ||
| * Depth is street level to running track | |||||
| ** Back-of-House-Space doesn’t include ancillaries | |||||
| *** Excluding existing station area, 63rd Street added 5 new elevators; total back-of-house is 82,296 square feet and total customer space is 28,094 square feet | |||||
| **** 72nd Street station shafts are not reflected in these costs | |||||
The three new stations are underground cathedrals measuring 305, 400, and 490 meters long with full-length mezzanines above the platform level and two above ground ancillary facilities for air tempering and ventilation (Figure 7). The station platforms measure 187 meters long. These three new stations have station-box lengths that are between 60% and 160% longer than the platforms and back-of-house areas that are between 150% and 260% larger than the passenger areas (Figure 8). In our Italian case, we found that Rome’s MB and MC station boxes were 3% to 47% longer than their platforms. In our Sweden case, we found that the station box for Odenplan in Stockholm is 250 meters long and the trains are 214 meters, an extra 17%. In our Istanbul case, we found that the current thinking is that rather than building one station box, the latest designs for M3 Phase 3, which is a heavy rail line with 180 meter long platforms, is to build smaller cut-and-cover boxes down to the mezzanine level and connect them to the platform via escalator tubes; thus, the station boxes are shorter than the platforms.[54] Back-of-house space, such as technical rooms and staff changing rooms are a level above the mezzanine while tunnel ventilation and drainage rooms are located between the platforms (Figure 9). The result is smaller excavations, which have grown even smaller over time without sacrificing ridership capacity. We underscore this difference to show that Phase 1’s stations are uniquely large relative to their platform lengths and that this design decision contrasts sharply with stations in lower-cost countries.[55]
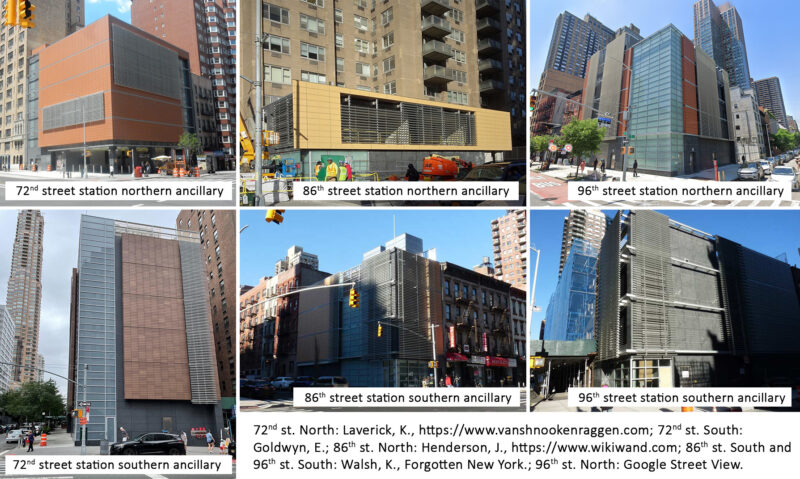
figure 7. Ancillary facilities.
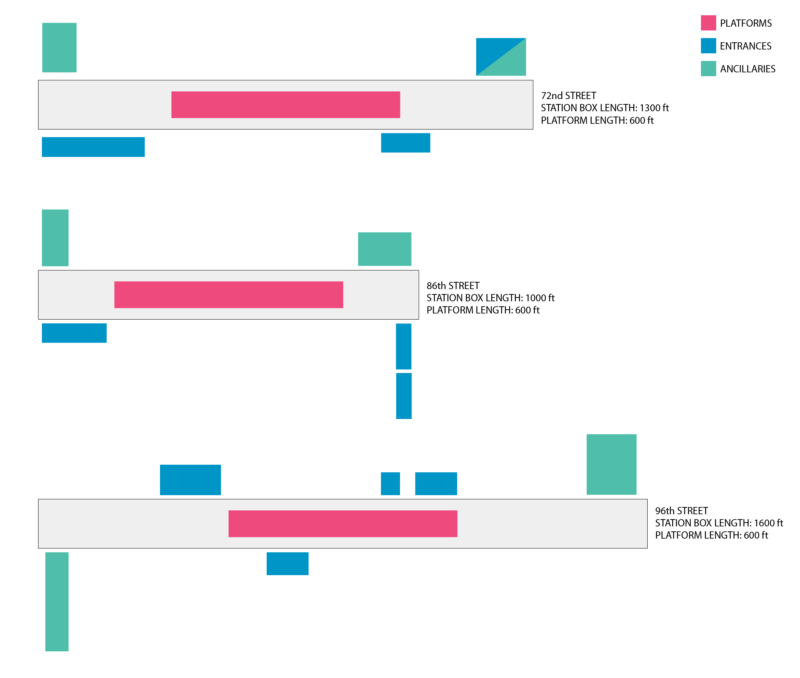
figure 8. Phase 1 station vs. platform lengths.
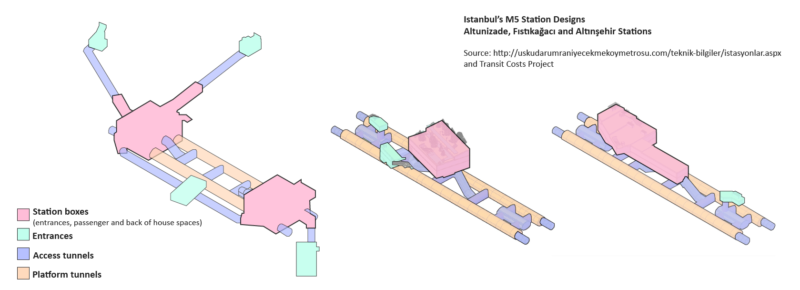
figure 9. Istanbul M5’s station design.
Phase 1’s stations extend so far beyond the platforms because of the addition of extensive back-of-house space for NYCT user groups and the introduction of new ventilation and air tempering systems. In multiple interviews with high-ranking officials from NYCT, MTA CC, and different consultants involved with station design, we were told that NYCT lobbied for more back-of-house space at every opportunity. One former NYCT head told us that “Back-of-house space is important. You can never have enough of it…. If you don’t get it during construction, you’re never going to get it” (Personal Interview NY G 2022). There are two important pieces of context unstated in this quote. First, NYCT didn’t pay for Phase 1. Since MTA CC was in charge of delivering the project, it was tasked with managing scope, schedule, and budget. A former senior MTA CC official told us that because NYCT was MTA CC’s client, NYCT made requests of MTA CC and had the power to withhold its approvals if it didn’t get what it wanted (Personal Interview NY K 2022). Since NYCT’s budget wasn’t at risk, it asked for the moon, just as NYC DEP wanted larger pipes and NYC Parks wanted money for additional park employees, and received independent rooms for each user group.[56] Further frustrating any attempt to control costs, MTA CC lacked the stature to push back on NYCT’s requests forcefully. Contractors and former MTA employees acknowledged that NYCT employees routinely disrespected MTA CC in meetings (Personal Interview NY J 2022; Personal Interview NY W 2022).
Second, though not stated outright in the quote, there was a perception that existing stations lacked adequate space for different NYCT user groups; thus, this was an opportunity to ensure that there would be enough offices, changing rooms, and storage facilities in these new stations. Whether or not this was strictly true is debatable. One former MTA employee told us that during a space audit in the 1990s, a number of unassigned rooms had either been claimed informally by different user groups or had been completely forgotten by time (Personal Interview NY U 2022).
So how much back-of-house space is even necessary? One design and engineer consultant who worked on Phase 1 asked us, “Why do you need lighting storage at every station? Why can’t the hydraulic guy and track guy share a room?” (Personal Interview NY C 2022). We were told that each user group needs its own room because each user group bears responsibility for cleaning and maintaining its own room; thus, how would those responsibilities be distributed if multiple groups shared a room (Personal Interview NY E 2022)? As unsatisfying as this answer is, it suggests that this issue can be resolved if there’s a desire to resolve it. In fact, early renderings for Phase 2 suggest that back-of-house rooms will be consolidated. The next question becomes why do all of these spaces have to be underground where construction is most expensive? Paris’s Line 14 extension includes stations with surface technical rooms surpassing 3,000 square meters (Personal Correspondence E 2022).
Beyond these general cost and space drivers, each station has unique characteristics that increase costs. 96th Street, the largest of the three new stations, is longer than the Empire State Building is tall for three specific reasons. First, bedrock runs relatively close to the surface along the majority of Phase 1’s alignment, which is why a hard-rock TBM was selected for Phase 1. North of 92nd Street, however, the bedrock slopes down 60 meters from the surface, leaving a layer of varved silts and clays extending down from the surface. This transition from hard rock to softer earth meant that a hard-rock TBM worked best if it went directly into the hard, abrasive Manhattan Schist at 92nd Street. Second, in order to take advantage of the pre-existing tunnel extending north of 99th Street, a connection had to be made between where the TBM went in and 99th Street. Third, the 96th Street Station is currently the terminal station for the Broadway Line. According to our interviews, terminal stations, in general, are larger because they require more back-of-house space to accommodate greater staff needs and crossover tracks to ease train operations.[57]
72nd and 86th Streets differ from 96th Street in how they were constructed: deep mining. Nearly all subways globally use cut-and-cover stations, underneath wide city streets or parks or other open spaces in more constrained city neighborhoods. No such constraints exist on the Upper East Side: Second Avenue is 30 meters wide, and in the early 20th century the forerunners of the MTA built four-track cut-and-cover stations under such avenues. 72nd and 86th Streets were not built this way: instead, the MTA dug small shafts and used them to blast the cavernous halls described above.
Deep mined stations have a clear impact on costs. Wickens (2020) observed this relationship between greater costs and deeper stations when he detailed growing costs in Toronto. When we examined the characteristics of the three new stations in New York, we saw differences in the number of entrances, escalators, and elevators, all of which affect costs. In general, we see similarities in space dedicated to passengers, roughly 3,600 square meters per station. Back-of-house space, spaces dedicated to non-passenger needs like mechanical rooms for elevators and escalators and NYCT user groups, on the other hand, varies greatly at each station, ranging from 5,500 to 8,900 square meters per station.[58] According to the MTA’s (2019) Mega Projects dashboard, which reports costs as of 2019, we see that the 96th Street Station cost $837 million, the 86th Street Station cost $656 million, and the 72nd Street Station cost $812 million. When we control for station volume, based on the excavations for each station, we see that 96th Street cost $3,460 per cubic meter, 86th Street cost $4,974 per cubic meter, and 72nd Street cost $5,579 per cubic meter (Table 3). Thus, on a per cubic meter basis, 96th Street has the lowest per volume costs, and the 72nd Street Station has the highest. Thus, 72nd Street is 61% more expensive than 96th Street on a per cubic meter basis and 86th is 44% more expensive than 96th Street. Since 72nd and 86th Street were constructed using the same technique, we expect their costs to be relatively similar. The main differences between those stations after controlling for volume is in the number of station entrances, two versus three, and elevators, two versus six.[59]
7.4 Conclusion
Costs are soaring throughout the English-speaking world. There is mounting evidence from Seattle, Los Angeles, Toronto, Sydney, Singapore, Hong Kong, Melbourne, and the Bay Area that the cost of rapid rail projects in the United States and other English-speaking countries is going to exceed $1 billion per kilometer even outside of New York. The best way to address these soaring costs is to empower experts at transit and capital construction agencies to plan, design, and manage the construction of these projects rather than relying on agency staff to manage contracts, grants, and the interfaces between consultants and agency departments. We argue that by elevating the transit agencies’ authority, and this unequivocally means bringing in experts who have a track record of delivering megaprojects at reasonable costs, this will temper downstream cost drivers.
Based on our research in New York, Phase 1 costs are so much greater than other projects in our database because the MTA struggled to manage intergovernmental and utility coordination, achieve cost savings in labor wages and staffing, increase contractor competition by making bidders take on all of the risks associated with underground construction, and reject expensive station designs that differ from what we have found in our lower cost case studies. In each instance, the MTA paid more than agencies in Italy, Sweden, or Turkey because it was unable to secure agreements with NYC Parks, Con Ed, or NYC DOT without agreeing to millions of dollars in mitigations, staff construction according to international standards, share risk more equitably with its contractors, or say no to NYCT’s excessive back-of-house space demands.
Phase 1 remains an important project that delivered enormous benefits to New Yorkers. Our worry, however, is that because costs continue to rise, it is only the projects with the largest benefits, like Phase 1, that are worth the enormous costs and political fights to pay for them. By tackling the issues outlined above, we believe that projects across the city that previously looked too expensive to build will become achievable, from the Interborough Express to the decades-promised extensions along Nostrand and Utica Avenues in southeastern Brooklyn to farther-out plans like a 6 extension to Co-Op City in the Bronx and a 7 extension to Whitestone in Queens. The key, however, is to reduce costs so that building more projects is politically feasible rather than turning to creative financing mechanisms like public-private partnerships or value capture.[60]
There’s widespread agreement in New York that investment in the subway is an important political goal. The limiting factor is always money. A New York that keeps building at today’s extreme costs is one in which Phase 2 or the Gateway tunnel is a massive generational project, requiring calling in every favor to get funding. A New York that addresses its construction cost crisis and increases its efficiency to what we see in low- or even medium-cost countries is one in which both of these projects are affordable and even the extra projects we mention above are viable alongside many more.
[1] We use 2.7 kilometers instead of 3.4 kilometers as Phase 1’s measure because in our database we only count in-service portions of projects and exclude non-revenue components like tail tracks and maintenance facilities in our measurements. We do count those elements when detailing project scopes.
[2] Costs are reported in year-of-expenditure dollars, but to convert to 2020 dollars, we use the midpoint of construction, 2011, and inflate $4.6 billion to 2020 dollars based on the Consumer Price Index.
[3] These are small sample size comparisons, and we recognize that no two projects are perfectly alike, some have automated trains, others have shorter platforms, and the geology in Istanbul varies greatly from New York’s.
[4] Since there have been multiple Second-Avenue-Subway plans since the 1920s, some plans extended into the Bronx and others left open the possibility of connecting to Brooklyn. What is constant, however, is the north-south service along Second Avenue in Manhattan.
[5] There were extensions and new stations completed after 1940, most importantly the 63rd Street Station that would later connect with Phase 1 of the Second Avenue Subway opened in 1989.
[6] The MTA comprises multiple operating agencies. While it’s confusing to alternate between the New York City Transit Authority, later New York City Transit, and the MTA, we will mainly use MTA throughout this case. We will specifically reference New York City Transit and MTA Capital Construction when describing internal dynamics.
[7] MESA Cost estimates include hard costs and rolling stock, but exclude soft costs. Furthermore, these estimates were based on early-stage conceptual designs.
[8] There was also the procedural issue of not having studied a full-length Second Avenue Subway. The MTA would have to file a Supplemental Draft Environmental Impact Statement that considered this alternative.
[9] DMJM+Harris later became AECOM. The joint venture would later have an option picked up by the MTA to provide construction phase support once construction began.
[10] The cost estimate is in year-of-expenditure dollars, but to convert to 2020 dollars, we use the midpoint of construction, 2012, and inflate $16.8 billion to 2020 dollars based on the Consumer Price Index. The project scope includes 16 new stations and a renovated 63rd Street Station to tie into the existing Broadway line.
[11] The MTA’s East Side Access request was the next closest request at $2,175,000,000. Neither MTA request was representative of the scale of funding requests. Of those nearly 40 requests, only three of them were over $1 billion, with 13 more falling into a range between $200 million and $500 million, and 18 requesting less than $200 million.
[12] The federal government’s fiscal year runs from October 1st through September 30th.
[13] Ironically, Phase 1 of the Second Avenue is even stubbier than the “stubway” from the MESA study.
[14] Compared to the other projects in Final Design during Fiscal Year 2008, Second Avenue Subway Phase 1 had the highest Cost per New Rider and the lowest Cost per Hour of Transportation System User Benefit.
[15] In one interview, a former senior official told us that many within the agency expected the bond act to fail, which would have ended any chance of building the Second Avenue Subway (Personal Interview NY B 2022).
[16] Clearly only receiving two bids is not ideal. When we looked at other transit tunnel projects in the US from around 2007, we found that in 2004 Sound Transit also received only two bids for a 1.6-km tunnel. The winning bid was almost 20% greater than Sound Transit’s estimate (Lindbloom 2004). In 2005, the winning bid for the North Shore Connector Light Rail tunnel in Pittsburgh was 25% greater than the estimate (Born 2012).
[17] PB Americas became WSP.
[18] In reading through the Project Management Oversight reports, it’s clear that from month to month the outlook on the start of revenue service changes. So even though a 2008 report claimed March 2016 as the opening date, there are later reports that point to June 2015. Since we already know the project didn’t open for revenue service until January 1, 2017, we think it’s reasonable to chronicle this uncertainty. Additionally, even though the Oversight reports state one thing, the agency and the media have different understandings of the project timeline.
[19] A payment bond guarantees that contractors can pay their subcontractors, laborers, and cover any other costs they may incur. A performance bond, similarly, guarantees that the contractor will complete the work. If the contractor is unable to complete these tasks, the bond allows the MTA to recoup the cost of the contract.
[20] Based on interviews and document review, it is clear that the MTA studied and considered a range of contract packages before settling on the 10 primary construction contracts.
[21] Again, change is extremely common for transit projects. Just as we see in Turkey, Boston, and Italy, things change once construction starts. Thus, it’s normal for the construction management functions to expand and be pressed into overtime to account for these changes. On the one hand, this is a good reason to have the right mix of internal experts at the agency, a la Metropolitana Milanese in our Italian case, to navigate this challenging process rather than relying on a mix of expensive consultants who require new scopes of work, change orders, and an additional layer of coordination to mobilize. On the other hand, Mysore Nagaraja, the former head of capital construction at the MTA, has stated that relying on consultants allowed him to hire specialized experts quickly and avoid bureaucratic red tape (Plotch 2021, pp.195-196).
[22] While this explanation is intuitive, Phase 1’s post-2008 contracts came in below cost estimates as more bidders competed for MTA work.
[23] As a point of contrast, in our Istanbul and Italian cases, we learned that launch boxes can be dug in one year or less.
[24] Ground freezing was also used for the 7 Line Extension to Hudson Yards.
[25] The initial plan was to stop the west bore at the northern crossover, literally where tracks cross over, by the 72nd Street Station. One of the 72nd Street Station contracts would include tunneling the remaining 675 meters.
[26] At the 86th Street Station site, blasting was allowed until 8:00 PM rather than 7:00 PM.
[27] The Temporary Code Compliance Certificates required that all work be completed by March 1, 2017, 60 days after the certificates were issued. This deadline was not met (Urban Engineers 2017b). Discrepancies are any deviations from the designs. This could be as benign as an outlet plate missing.
[28] During this period in the MTA’s history there were approximately 1,000 fires per year (Metropolitan Transportation Authority 2017b).
[29] Many of these interviews also included extensive follow up, such as clarifying emails, drawings, charts, documents, and follow up interviews.
[30] These kinds of arrangements aren’t unique to New York. In addition to examples we documented in our Green Line Extension case study, transit leaders in other American cities have told us about buying fire trucks for municipalities that complain that they don’t have the resources to fight fires at newly built rail stations or along a stretch of guideway or funding construction on university campuses (Personal Interview NY H 2022).
[31] Utility relocation was bundled into the other station contracts.
[32] The initial contract had an award value of $34 million. Over the course of the 28-month contract there were an additional $6.5 million in contract modifications.
[33] While final designs were signed off on prior to tendering contracts, agencies and utilities updated requirements, shared new drawings, etc. after contracts were finalized. Con Ed also requested multiple changes to this contract after it had been tendered. One contractor we interviewed explained it plainly, “Con Ed is the worst, but there’s really nothing you can do about it” (Personal Interview NY J 2022).
[34] Technically, contractors are only entitled to time claims when the MTA delays construction itself. Delays imposed by utility companies and city agencies are supposed to be factored into the contract price. While this may sound reasonable on paper, contractors still try to claw back these costs through claims and other means.
[35] There were other DEP related utility relocations negotiated in the overall contract.
[36] We assume the MTA had its designers redesign this utility more than twice because it is likely that the MTA went through a redesign including a 60-inch diameter pipe, too.
[37] A concrete bus pad is a rectangular, durable strip of concrete designed to withstand the greater heat and weight of buses at a bus stop.
[38] As noted in the previous section, the decision to redesign the streets allowed the MTA to move one of the 72nd Street Station entrances from 301 East 69th Street to a sidewalk location because of the addition of the bicycle lane and wider sidewalks. Presumably this should provide similar opportunities to use the sidewalk for entrances in future phases.
[39] NYC DEP shared a list of every commissioner and the duration of his or her term with us.
[40] According to Goolsbee and Syverson (2023) domestic construction productivity has fallen at a rate of about one percent a year since 1970 so this is not isolated to transit construction.
[41] Overtime rules vary by trade, but the basic rules for tunnel workers are double time after an eight-hour day, double time for Saturdays and Sundays, and double time for specified holidays.
[42] While the initial plan for TBM operations was not to operate on the weekends, when wages are paid at double the standard rate, as the schedule slipped, weekend work was necessary, which meant labor costs increased.
[43] It should be restated that the initial tunneling contract also included starter shafts for the 72nd Street Station so that $380 million includes the majority of the tunnel work and additional excavation and utility relocation. A portion of the tunnel lining work was relocated to the 86th Street Station heavy civils contract.
[44] Overnight trucking is also much less susceptible to being upended by traffic.
[45] Consultants are used extensively in Istanbul. Wages are just much lower, even after PPP transformation.
[46] It is important to recognize that by the 2000s, CPM, became more reliant on Indefinite Quantity contracts, consultants, to design and manage its projects as nearly 50% of CPM’s technical staff approached retirement age (Personal Interview NY U 2022).
[47] When you combine similar costs from East Side Access, Fulton Transit Center, and the 7 Extension, more than $2 billion has been spent on design, planning, engineering, and construction management consultants (MTA 2019)
[48] It should be noted that this issue of fraught intra-agency communication is a feature of the Leviathan by Proxy approach. Without consultants, perhaps, the agencies could work together to resolve differences rather than allow consultants to sit between them and conduct additional studies.
[49] The endless studies and consultant work is a feature of the Leviathan by Proxy model described earlier. When managers within an agency aren’t empowered to make decisions, consultants become a necessary stamp of approval. Unfortunately, this also means that the agency staff itself likely does not have the appropriate experts to tell the consultants what to do.
[50]These same consultants said that this problem arose at transit agencies across the country.
[51] The New York State Department of Transportation, conversely, does publish itemized unit cost prices. We have been told this is a common practice among state departments of transportation.
[51] This is not entirely accurate. The $378 million TBM contract also included two starter shafts for the 72nd Street Station. Presumably the costs of those shafts were similar to the $40.6 million 86th Street Station contract that specified the same kind of work. The $336.5 million systems contract included work within the stations. Finally, additional third-party costs that were not paid directly to the contractors, and thus not included in the station contracts, totaled another $110 million.
[52] Back-of-house space is the area in a station that is dedicated to New York City Transit staff rather than passengers. These spaces include storage rooms, offices, work spaces, mechanical rooms, etc.
[53] This is not a comprehensive examination of descriptive station data. In general, this data is not publicly available, often seems unreliable, and is difficult to access. We use these examples as an illustration to show that based on the data we have seen and trust, New York’s station lengths and volumes are far larger than anything else we have found.
[54] In our attempts to gather this information, we believe that stations in China have large back-of-house spaces more akin to what we find in New York.
[55] It is worth noting that conceptual designs included in the Supplemental EIS for Phase 2 combine some of these spaces rather than giving every group its own room.
[56] By building in phases, the terminal stations for the Second Avenue subway shift with each phase, though the northern terminal will be fixed by the completion of Phase 2.
[57] 96th Street, as mentioned earlier, is uniquely large because of geology and need to connect to existing running tunnels at 99th Street. Despite this caveat, the back-of-house spaces at 72nd and 86th Streets are still substantially larger than the passenger spaces.
[58] We were told in an interview with a former CEO of the MTA that Second Avenue Subway Phase 1 entrances cost $100 million each (Personal Interview Q 2021). No one else ever confirmed that number so it’s hard to know how accurate it is, but we assume a former MTA CEO would be well informed about these issues. If we deduct $100 million from 72nd Street’s total costs, the costs per cubic meter decline from $5,579 to $4,892, which is 1.65% less than 86th Street’s $4,974 per cubic meter costs, or, they are roughly identical.
[59] We were told in an interview with a former CEO of the MTA that Second Avenue Subway Phase 1 entrances cost $100 million each (Personal Interview Q 2021). No one else ever confirmed that number so it’s hard to know how accurate it is, but we assume a former MTA CEO would be well informed about these issues. If we deduct $100 million from 72nd Street’s total costs, the costs per cubic meter decline from $5,579 to $4,892, which is 1.65% less than 86th Street’s $4,974 per cubic meter costs, or, they are roughly identical.
[60] We aren’t uniformly dismissing alternative financing mechanisms, but first we need to bring down costs before tapping additional pools of money.